Management of Acute Coronary Syndromes - part 10 docx
Bạn đang xem bản rút gọn của tài liệu. Xem và tải ngay bản đầy đủ của tài liệu tại đây (1020.39 KB, 78 trang )
as patients become disabled and require more health care services over the ensuing
months and years.
ACS represent an acute event that can have continuing costs, and thus differs from
and is more complicated than a single form of therapy or diagnostic test (Table 1). When
considering a new therapy for ACS, there is generally a clear starting point but often no
clear stopping point (other than death). The natural history of ACS may vary substan-
tially, as may management. The patient may be stable but then decompensate, resulting
in a hospitalization and intensified therapy, presumably with a somewhat worse health
state and associated costs. The goal of therapy is to return the patients to their baseline
health state and maintain them there. Economic considerations should include direct
cost as well as indirect costs, which may be substantial due to lost productivity. ACS
may also have a considerable impact on how people feel (quality of life) and how they
function (health status). A good design for an outcomes study in heart failure should
take into account all of these possibilities.
BACKGROUND ON ECONOMIC ANALYSES
In an environment in which society cannot afford all possible medical services, all
forms of care compete for resources based on effectiveness and cost. A comparison of
cost between contending therapies can involve a simulation in which costs and outcome
are estimated from nonrandomized comparisons and randomized controlled trials. Even
within randomized trials, an economic analysis can range from a simulation to a very
detailed component of the trial with extensive primary data collection. For any of these
designs, the simplest type of economic study is a comparison of costs or a cost-mini-
mization study. Such a study is useful when it is reasonable to assume that the two treat-
ments offer similar outcomes.
When effectiveness cannot be assumed to be the same for competing therapies, there
are three related forms of economic analyses that can be used to study the relationship
of cost to outcome: cost-effectiveness, cost-utility, and cost-benefit. Cost-effectiveness
analysis assumes that there is one overall measure of effectiveness, often survival (2).
This method breaks down when there are multiple measures of effectiveness. For
instance, one form of therapy may increase the risk of death, but offers improved symp-
tomatic status. This may, in principle, be addressed through cost-utility analysis, in
which all measures of effectiveness are incorporated into one measure, utility (2). A
706 Weintraub
Table 1
What is Different About the Economics of ACS?
Episode in a chronic disease rather than a procedure.
Clear starting point.
No clear stopping point.
Disease course may vary widely.
Management may vary widely.
Boundaries of what to include may be difficult.
Indirect costs may be substantial.
Health status may be affected significantly.
third and somewhat less popular form of analysis is cost-benefit analysis, in which
measures of both cost and effectiveness are reduced to dollars or other currency (2).
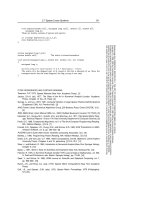
We can begin to understand the approach of cost-effectiveness analysis by consider-
ing competing therapies, A and B, to treat the same condition (Fig. 1). In panel 1, ther-
apy A is less effective but more expensive than therapy B. In this setting, B is said to
dominate A. Similarly, in panel 4, A is more effective and less expensive than B. In this
setting, A would dominate B. Commonly, however, the more effective therapy or test is
also more expensive. Thus, in panel 2, A is more effective but also more expensive. Sim-
ilarly, in panel 3, B is more effective but also more expensive. When a therapy is both
more effective and more expensive than the competing therapy, cost-effectiveness analy-
sis can help decision makers choose whether to allocate resources to the more effective
service.
The perspective in these analyses can have an important impact on their structure and
outcome. For instance, an analysis from a hospital’s perspective might not include the
long-term consequences of a particular clinical strategy, whereas this issue may be most
important to the patient and the payer. The perspective of all of the various stakeholders
may be viewed in aggregate as “society”. To be most useful in serving societal goals,
cost and cost-effectiveness analyses should be performed from a societal perspective, in
which an attempt to measure all of the costs and measures of outcome associated with
a particular treatment is made. These costs should include those incurred by the patient,
the costs of medical resources that could have been used for other patients, and any loss
of income that the patient sustained because of poor health, as well as the loss of income
for those who may have provided informal care to the patient. Outcome should include
events, quality of life, and survival. By looking at the sum of all of these costs in rela-
tion to outcome, a policy maker could decide, for example, whether the public good ben-
efited more by allocating limited health care resources to preventive services or a new
therapy for ACS.
Economics of Acute Coronary Syndromes 707
Fig. 1. Decision matrix.
DETERMINING COSTS
Nomenclature for Costs
Economists are more concerned with how society chooses to allocate limited
resources rather than what something costs per se (3). Cost may be used to sum resource
use of several type, permitting an economic comparison of services with a common
scale. Accounting methods are used to develop costs from resource use; a summary of
accounting names is shown in Table 2.
Costs must be considered from one of several possible perspectives (4). For hospi-
tals, costs are their expenses related to providing a service. For payers, the cost is what
the providers charge, plus their administrative expenses. In principle, cost studies often
seek to determine societal costs, which can be used in cost-effectiveness analyses to gain
the widest perspective. However, societal costs are never directly measurable, and thus
combinations of cost proxies from one or several stakeholders, where measurable, are
often used as estimates.
Costs are classified as direct or indirect (5). Varying definitions of indirect costs may
lead to uncertainty categorizing a particular cost. Theoretically, direct costs are those
incurred by a stakeholder for a therapy or test, and indirect related costs are those
incurred by other societal groups. More commonly, direct costs relate to the provision
of medical care, while indirect costs are other societal costs.
Medical costs can also be divided into three components: in-hospital direct costs, fol-
low-up direct costs, and indirect costs. Inpatient costs are comprised of hospital costs
(e.g., room, laboratory testing, pharmacy, etc.) and physician professional billings. Fol-
low-up direct costs include physician office visits, outpatient testing, medications, home
health providers, and additional hospitalizations. In this setting, indirect costs reflect lost
patient or business opportunity and may be referred to as productivity costs (6).
A final way of thinking about costs is that direct costs are realistically linked to a
particular service, while indirect costs are not. This type of indirect cost is also called
overhead (7).
708 Weintraub
Table 2
Nomenclature for Costs
Cost perspective:
Provider, i.e., hospital or professional.
Payer, i.e., insurance carrier.
Patient.
Cost category:
Direct costs.
Indirect costs.
Accounting method:
Top-down.
Bottom-up.
Costs per service:
Average cost.
Marginal (incremental) cost.
The appropriate length of time over which to measure costs is dependent upon the
procedures being studied and outcomes being measured. The cost of a hospitalization
for ACS could be considered the initial hospitalization alone. Alternatively, the cost for
a hospitalization for ACS could be considered to include the “induced” cost related to
that hospitalization during a period of follow-up (8).
Often in the United States, hospital provider costs are used as a proxy for societal
costs. What a hospital charges for a service is not its cost (9). Measuring hospital cost
is difficult and has been approached by using what is called either top-down or bottom-
up accounting (10). Top-down costing involves dividing all the money spent on a hos-
pitalization or procedures by the number of episodes of care of the particular type
performed. In contrast, a bottom-up approach involves individually costing all resources
used for a service, i.e., supplies, equipment depreciation and facilities, salaries, etc. All
methods involve a set of assumptions and limitations. When considering the cost of a
specific procedure using top-down costing, it must be assumed that costs in the depart-
ment in which the procedure is provided can be separated from costs in other depart-
ments. There may also be variability within a department. Bottom-up methods also are
limited by the ability to account for all resources consumed and to appropriately apply
costs.
Another issue involved in measuring hospital costs is average vs marginal or incre-
mental cost (11). Average cost is calculated by dividing all costs for a therapy or test by
the number of that particular type. In contrast, the marginal cost is the cost of the next
similar procedure. Average costs include all resources used, including overhead, whose
costs would not be decreased if not utilized. Marginal costing accepts fixed costs as a
given and focuses only on variable costs or those additional resources consumed by each
additional patient. Variable costs are analytically separated from fixed costs by estab-
lishing the perspective and time-frame as fixed. For instance, facilities’ costs are com-
monly considered fixed, but how should marginal personnel costs be assigned? If an
older test such as Swan Ganz catheters decreases as echocardiography becomes more
common, how is the decrease in intensive care unit (ICU) nurse activity and increase in
echocardiography technician activity reflected? Because of these difficulties, most cost
and cost-effectiveness studies use average costs.
Cost Measurement
There is a detailed approach to top-down costing based on the UB92 summary of hos-
pital charges, which is commonly used in the United States (12). The UB92 is a uniform
billing statement used by all third party carriers. The relationship between costs and
charges, in the form of global specific cost to charge ratios, must be developed using
American Hospital Association guidelines and then filed annually with Health Care
Financing Administration (HCFA) in a Hospital Cost Report, which is in the public
domain.
An alternative approach is to use bottom-up cost accounting and assign cost weights
to each type of resource used (13). The sum of resources times their cost weights yields
total cost. However, the methods are sufficiently laborious that they are rarely used.
Another approach is to use a payer perspective (14). In the United States, Medicare
diagnosis-related group (DRG) reimbursement rates can be used to define cost. Similar
methods are available in other countries. The use of DRGs to assign cost does not account
for variation in cost within that DRG and may not even reflect average resource use.
Economics of Acute Coronary Syndromes 709
To assess professional costs, it is not sufficient to consider only the primary physicians’
fees alone, as other professionals provide services (15,16). The goal must be to capture all
of the professional services for an episode of care. In the United States, there has been an
effort to rationalize physician payments by developing a set of scales for services (17).
This system, the resource-based relative value scale (RBRVS), was developed over time
to try to assess the relative time, physical, and cognitive efforts associated with physician
services (17). Each service is assigned a number called the relative value unit (RVU). If
the profile of physician services for a procedure or hospitalization is known, then RVUs
for each service may be used to develop a proxy for the physician costs. The total RVUs
may be converted to a dollar figure by a conversion factor from Medicare or private insur-
ance carriers. Developing a profile of professional services is quite laborious and rarely
undertaken. An alternative approach is to use published data in which professional serv-
ices by DRG are estimated as a percent share of hospital costs (18).
Determining the costs of outpatient services presents different challenges in assess-
ing resource utilization, including direct and indirect medical costs. Direct costs include
physician office visits, medications, procedures and testing, rehabilitation, nursing
home stays, and home health services, as well as patient out of pocket expenses, includ-
ing travel. Services can be assigned a cost using the Medicare Fee schedule as discussed
above. Medication costs can be estimated from compiled prices by sampling pharma-
cies or using published wholesale pharmaceutical prices.
Indirect productivity costs include missed time from work by the patient or family
members. In any case, it is not possible to directly measure all of the indirect costs. For
instance, if an executive in a company has a myocardial infarction and is out of work for
6 wk, there may or may not be loss of pay, but the effect on the business cannot readily
be determined. Indirect costs, if measured at all, are often confined to family loss of
income, and the numbers must be examined with both interest and skepticism.
Inflation and Discounting
Costs in the future should be deflated by multiplying by a constant to convert from
any one year to another, based on the medical inflation rate or the general inflation rate
of the consumer price index (CPI) (19). The medical inflation rate is generally larger
than of the overall CPI and will give somewhat different figures. Future costs should
also be discounted to reflect the opportunity costs of current dollars, i.e., future costs
should be expressed at their present value (20). For instance, if a policy maker were
given the alternative of spending $1000 now or $1000 in 5 yr to treat a given condition
and obtain the same outcome, the decision would always be the latter. Costs are gener-
ally discounted at a rate of 3–5%/yr (20).
COMPARING COSTS TO OUTCOME
Determination of Patient Utility and Quality Adjusted Life Years
In the treatment of ACS, it is unusual for one measurement of outcome to be of suf-
ficient clinical importance that all other outcome measures may be ignored in clinical
decision making. While death generally overwhelms all other outcome measures in
importance, these patients may also suffer from considerable disability. Thus, a therapy
may be justified based on improved health status alone, even if not life saving.
Improved health status should not be thought of as independent of a disease process.
710 Weintraub
The relationship of health status to disease process, with a focus on ACS is shown in
Fig. 2 (21). Health status includes, symptoms, functional limitations, and the reaction
to these limitations, which we may call quality of life. Decreased health status is
dependent on the severity of the disease process. To incorporate health status measures
into a cost-effectiveness analysis, an overall measure of health status is needed. In prin-
ciple, this task may be accomplished through the determination of patient utility.
The utility of a therapy or test is the sum of benefits, both positive and negative, that
accrues to a patient over time as the result of the procedure (22). More technically, util-
ity is a measure of patients’ preferences for one health state over another. We may con-
sider the assessment of utility beginning with a decision tree (Fig. 3), which takes a
patient at a specific point and then considers, in principal, all possible events up to some
Economics of Acute Coronary Syndromes 711
Fig. 2. Measures of health status and their relationship to disease status or severity.
Fig. 3. Idealized decision tree for a decision on diagnostic strategy or therapeutic choice.
712 Weintraub
point in the future. In this model, nodes with squares represent choices, and nodes with
circles represent chance events. In the simplified model shown, a single choice is made,
and for each choice, there are two possible outcomes. Each outcome is called a health
state. Each health state has a utility and a probability of occurrence. The utility of choice
A in Fig. 3 is the sum of the utility of health state 1, times its probability plus the util-
ity of health state 2, times its probability. Unlike this simplified model, for any one treat-
ment, there may be multiple possible health states; it is generally difficult to determine
the probability and utility health states.
Utility changes over time, corresponding to changes in health state. The utility of two
alternative treatments after suffering an ACS are compared in Fig. 4. After initiating
therapy A, the patient may feel well and utility rises. A recurrent symptomatic period
between yr 1 and 2 causes utility to fall. With successful treatment, utility rises again.
For therapy B, there is no episode of recurrent symptoms, and utility gradually rises.
Ultimately, the patients get to the same point, but the patient who has the episode of
recurrent heart failure suffers a period of decreased utility. Utility measurement reflects
patient preference. One patient may dislike the disability of chest pain enough to be will-
ing to undergo more aggressive therapy with revascularization. Another patient may dis-
like the difficulties involved with more aggressive care enough to be willing to put up
with more functional limitation.
Utility may be measured indirectly using either a validated survey, such as the Health
Utilities Index (23) or the EuroQol (24) or by directly assessing patient preference. The
patient preference methods, Standard Gamble and Time Trade-off (2), ask patients to
directly evaluate their current state of health and then evaluate what they would give up
or risk to achieve perfect health. The patient preference methods are probably superior
to surveys because the evaluation of a patient’s view of his/her own state of health is
measured directly, but they are more difficult to administer. In the Time Trade-Off
Fig. 4. Theoretical time course of utility for two different therapies for heart failure. With therapy A,
there is a dip in utility followed by recovery, while for therapy B, utility gradually rises.
Economics of Acute Coronary Syndromes 713
approach, patients weigh the fraction of expected survival they are willing to give up to
live in perfect health. With the Standard Gamble, patients weigh what risk of death they
are willing to take to live in perfect health. The Standard Gamble is probably superior
because it includes the element of risk (2).
Utility alone does not provide a final summary measure of outcome, because it does
not include life expectancy. A summary measure can be created by combining utility and
survival to obtain quality-adjusted life years (QALYs) (Fig. 5) (21,25). Survival, as with
cost presented above, is generally discounted, which means that patients value a year of
survival at the present time more than a year of survival in the future. The “true” dis-
count rate for survival is unknown. Values in the literature for the discount rate have var-
ied from 2% to 10%, with 3% being the most popular, and it should be discounted at
the same rate as cost (20). Thus, with a discount rate of 3%, next year’s survival is 3%
less important than this year’s survival. QALYs is the best summary measure of outcome
in a cost-utility analysis because, it incorporates patient value, risk aversion, expected
survival, and a discount rate.
Cost-Effectiveness and Cost-Utility Analysis
Cost-effectiveness is defined as the change in cost per unit increase in effectiveness.
If the summary effectiveness measure is in QALYs, then the marginal or incremental
cost-effectiveness of therapy or test A compared to therapy or test B is defined as:
COST
A
– COST
B
/QALYs
A
– QALYs
B
. The cost-effectiveness ratio combines the three
important outcome measures of utility, survival, and cost (Fig. 5).
Cost-effectiveness analysis involves multiple assumptions in measuring both cost and
outcome, which introduces uncertainty or error. Uncertainty in clinical microeconom-
ics is generally approached through sensitivity analysis. With sensitivity analysis, meas-
urements in which there is uncertainty are varied between appropriate ranges, and the
analysis is repeated. However, the appropriate ranges for the variables for sensitivity
Fig. 5. Interrelationship between survival, utility, and cost to create a cost-utility analysis.
analysis may not be clear. Sensitivity analysis offers a sense of the stability of the cost-
effectiveness ratio; in some studies the variation in the ratio with sensitivity analysis may
be small, while in others it may be sufficiently large that the original point estimate may
have little meaning. Therapies that appear cost-effective using only the central point esti-
mate may not seem as cost-effective when the underlying assumptions are varied, or a
ratio that was marginally cost-effective may seem quite cost-effective when the assump-
tions are varied; this may be especially true concerning the cost of a new therapy which
may decline over time. In studies in which cost and effectiveness are directly measured,
the variability of the cost-effectiveness ratio can be expressed with a 95% confidence
interval (CI) determined by boot-strap analysis.
COST-EFFECTIVENESS OF THERAPY IN ACS
Clinical trials and subsequent economic evaluations have been carried out in most
areas of medical decision making concerning ACS. These studies are discussed below
and summarized in Table 3.
Coronary Care
Patients with an acute myocardial infarction, whether ST-segment elevation or not,
often suffer life-threatening complications that require rapid high-level intervention.
Consequently, the standard of care is generally to admit patients with an acute myocar-
dial infarction to a coronary care unit. Admission to these units is costly and relatively
few patients benefit from the units’ advanced capabilities. The value of this triage for
specific groups of patients can be illuminated through an economic analysis.
To address this issue, Tosteson and colleagues made use of clinical and resource uti-
lization data from 12,139 emergency department patients who presented with acute
chest pain (26). They compared a coronary care unit with admission to an intermediate
care facility with central electrocardiographic monitoring and personnel to detect and
treat in-hospital complications. Information on the effectiveness of coronary care units
is sparse, particularly in this setting of alternatives with some of the same capabilities.
Based on data from the Multicenter Chest Pain Study, the authors estimated that mor-
tality for patients with an acute myocardial infarction would be 15% higher for admis-
sion to an intermediate care unit compared with a coronary care unit (27). Using this
assumption, the value of admission to a coronary care unit varied depending on the age
of the patient and the initial probability of an acute myocardial infarction. In 1992 dol-
lars, for patients who were 55–64 yr old and had a 1% probability of infarction, admis-
sion to a coronary care unit had a cost-effectiveness ratio of $1.4 million/yr of life saved,
while the same age patients with a 99% probability of an infarction had a cost-effec-
tiveness ratio of $15,000/yr of life saved. The cost-effectiveness ratio was less than
$75,000/yr of life saved if the probability of infarction exceeded 20%. The cost-effec-
tiveness of coronary care units was less favorable for younger patients because of their
lower underlying risk of a life-threatening complication.
Pharmacologic Reperfusion
With the advent of information about the efficacy of thrombolytic therapy for the
treatment of patients with suspected acute myocardial infarction, interest turned to
the economic value of this intervention. Since the two largest and earliest trials of
714 Weintraub
Table 3
Summary of Economic Studies in Acute Coronary Syndromes
Study Study basis Study Study Cost and
(reference) Intervention (reference) size type cost-effectiveness
Tosteson et al. (26) Coronary care Multicenter 12,139 Nonrandomized $15,000–1.4 million/yr of life saved,
Chest Pain Study depending on patient characteristics.
Krumholz et al. (28) Reperfusion Literature NA Simulation $21,200–$50,000/yr of life saved
in elderly.
Mark et al. (33) tPA vs streptokinase GUSTO 41,021 Partial simulation $13,410–$203,071/yr of life saved,
survival based on depending on patient characteristics.
23,105 randomized trial
resource
use
Kalish et al. (34) tPA vs streptokinase GUSTO NA Simulation based Under $27,400 to over $1000/QALY
on randomized trial depending on patient characteristics.
Reeder et al. (41) PTCA vs tPA in Clinical Trial 99 Based on Inconclusive.
ST-elevation MI randomized trial.
Stone et al. (42) PTCA vs tPA in PAMI 358 Based on PTCA dominates.
ST elevation MI randomized trial
Mark et al. (50) Low-molecular-weight ESSENCE (49) 655 Based on LMWH dominates unfractionated
heparin randomized trial heparin in non-Q MI.
Mark et al. (52) GP IIb/IIIa in EPIC (51) 2038 Based on Cost saving for drug cost less
high risk PTCA randomized trial than $1270.
Weintraub et al. (54) GP IIb/IIIa in RESTORE (53) 1920 Based on Effective at no increased cost.
high risk PTCA randomized trial
Weintraub (61) Invasive strategy TACTICS-TIMI 18 1722 Based on Effective at no increased cost.
in UA/NSTEMI randomized trial
Goldman et al. (63) b-Blockade Literature NA Simulation $3,623–$23,457/yr of life saved,
depending on level of risk.
Tsevat et al. (65) ACE Inhibition SAVE 2231 Simulation based $3600–$60,800/QALY depending
on randomized trial on level of risk.
McMurray et al. (66) ACE inhibition Literature NA Simulation based 1752–3110 British pounds/yr of
on randomized trial life saved, depending on model
characteristics.
Ades et al. (67) Rehabilitation Literature NA Simulation $4950/yr of life saved.
MI, myocardial infarction; LMWH, low-molecular-weight heparin; UA/NSTEMI, unstable angina non-ST-segment elevation myocardial infarction
thrombolytic therapy used streptokinase, the early economic evaluations focused on
this agent (28–32).
A cost-effectiveness analysis published in 1992 examined the use of streptokinase
compared with no treatment, since the two largest and earliest trials of thrombolytic
therapy used streptokinase (28). The investigators focused on the treatment of elderly
patients with suspected acute myocardial infarction, a group for which there is less
enthusiasm about using thrombolytic therapy. Based on data available from Gruppo Ital-
iano per lo Studio della Streptochinasi nell’ Infarto Myocardio (GISSI)-1 and Second
International Study of Infarct Survival (ISIS-2), the relative benefit of thrombolytic
therapy was assumed to be lower in elderly patients and the risk of thrombolytic ther-
apy was higher, but the absolute risk after an acute myocardial infarction was much
higher compared with younger patients. The smaller relative reduction in the higher risk
associated with infarction offset the higher risk of complications. Thus, the decision
analysis suggested that thrombolytic therapy was economically attractive over a broad
range of assumptions about the risks and benefits. After considering the costs of the
treatment, complications, and long-term health care of survivors, the authors estimated
that the cost-effectiveness ratio of streptokinase compared with conventional medical
therapy was $21,200/yr of life saved for an 80-yr-old patient. The authors calculated
similar estimates for younger patients. Several studies have found similar results. One
analysis has even suggested that thrombolytic therapy could be cost saving because of
its impact on reducing rehospitalization (32).
With the emergence of tissue-type plasminogen activator (tPA) as a more expensive
and more effective alternative to streptokinase, studies addressed whether the incre-
mental benefit was large enough to justify the incremental cost. The Global Utiliza-
tion of Streptokinase and tPA for Occluded Coronary Arteries (GUSTO) trial
investigators performed a substudy to address this issue specifically (33). The inves-
tigators collected detailed information about resource consumption in a subgroup of
the GUSTO subjects. They found that both treatment groups were similar in their use
of resources in the year after enrollment. The treatment groups had a mean length of
stay of 8 d, including an average of 3.5 d in the intensive care unit. During the initial
hospitalization, the treatment groups had a similar rate of bypass surgery (13%) and
angioplasty (31%). Overall, the 1-yr health costs, excluding the difference in the cost
of the thrombolytic agent, were $24,990/patient treated with tPA and $24,575/patient
treated with streptokinase. The major difference in the cost of the therapies was the
cost of the drugs: $2750 for tPA and $320 for streptokinase. The primary analysis
assumed no increase in costs for the tPA group after the first yr. Based on the GUSTO
results and an estimate of the patients’ life expectancy, the additional life expectancy
per patient treated with tPA was estimated to be 0.14 yr. Based on these estimates,
the authors concluded that the cost-effectiveness ratio of using tPA instead of strep-
tokinase was $32,678/yr of life saved. This ratio varied considerably based on the
infarction site and the age of the patient. In general, the younger and lower risk patients
had higher cost-effectiveness ratios. For example, the cost-effectiveness ratio for tPA
in a patient aged 40 yr or younger with an inferior infarction was $203,071/yr of life
saved compared with $13,410/yr of life saved for a person aged 75 yr or older with
an anterior infarction. An analysis conducted independent of the GUSTO trial reached
similar conclusions (34). Comparisons with other new agents await strong evidence
of their superiority to tPA.
716 Weintraub
Pharmacologic Reperfusion Vs Primary Percutaneous Coronary Intervention
Mechanical approaches to reperfusion have been employed with increasing fre-
quency. The clinical or economic advantage of primary angioplasty have been somewhat
controversial (35–37). Several studies have suggested a substantial advantage of primary
angioplasty (38–40). Economic analyses based on early studies suggested that primary
angioplasty is associated with a reduction in mortality without increasing cost (41,42).
In an early study by Reeder et al. (41) 99 patients with acute myocardial infarction pre-
senting within 12 h after onset of symptoms were randomized to tPA or immediate
angioplasty as the initial revascularization strategy. The primary outcome determinants
were direct and indirect costs, including duration of hospital stay and return to work. No
significant difference in cost between the two initial treatment strategies was noted. A
trend was noted toward a briefer hospital stay and fewer late in-hospital procedures in
patients treated initially with angioplasty. Other measures of indirect costs were not sta-
tistically different. The two strategies were considered to have similar cost-effectiveness.
In a larger and somewhat more recent study Stone et al. (42) evaluated the cost-effec-
tiveness of acute percutaneous coronary intervention (PCI) in the Primary Angioplasty
in Myocardial Infarction (PAMI) trial. A total of 358 patients in the U.S. with acute
myocardial infarction were randomized to tPA or primary percutaneous transluminal
coronary angioplasty (PTCA). Compared with tPA, primary PTCA resulted in lower in-
hospital mortality (2.3 vs 7.2%, p ϭ 0.03), reinfarction (2.8 vs 7.2%, p ϭ 0.06), recur-
rent ischemia (11.3 vs 28.7%, p Ͻ 0.0001), and stroke (0 vs 3.0%, p ϭ 0.02), as well as
shorter hospital stay (7.6 Ϯ 3.3 d vs 8.4 Ϯ 4.7 d, p ϭ 0.04). Despite the initial costs of
cardiac catheterization in all patients randomized to PTCA, total charges tended to be
lower with PTCA ($27,653 Ϯ $13,709 vs $30,227 Ϯ $18,903, p ϭ 0.21). At a mean fol-
low-up time of 2.1 Ϯ 0.7 yr, no major differences in postdischarge events or New York
Heart Association functional class were present between PTCA and tPA-treated patients,
suggesting, but not proving, similar late resource consumption. Compared with tPA,
reperfusion by primary PTCA was felt to improve clinical outcomes with similar or
reduced costs, suggesting a dominant strategy. However, the ability to generalize these
results to the community setting where access to the catheterization laboratory may be
limited has been less certain. Thus, additional studies of actual practice, however, have
provided less impressive results associated with the use of primary angioplasty (37,43),
making estimates of the effectiveness more difficult.
A fundamental problem in the area of reperfusion, both pharmacologic and mechani-
cal is that the field is moving rapidly. Changes in costs and techniques require rapid access
to recent data in order to develop relevant economic models. For example, stents, initially
considered to be contraindicated in acute myocardial infarction because of concerns that
they would incite thrombus formation, have become the standard for primary mechanical
reperfusion therapy (44). As evidence of the efficacy of stents accumulates, there will be
a need to examine their economic impact compared with balloon angioplasty and throm-
bolytic therapy. Also, as more rapid discharge protocols evolve for patients who receive
reperfusion therapy, the balance of costs and effectiveness may shift (45).
Antithrombotic Agents
Aspirin reduces mortality and morbidity for patients with ACS. As a result of the
marked benefit and the minimal cost of the therapy, no formal economic analysis of
aspirin for the treatment of ACS has been published in the mainstream journals. The
Economics of Acute Coronary Syndromes 717
ISIS-2 trial found that aspirin avoided 25 deaths for every 1000 patients with suspected
acute myocardial infarction (46). In addition, the 1 mo of aspirin therapy in ISIS-2 was
associated with halving the risk of stroke or reinfarction. Aspirin avoided about 10 rein-
farctions and 3 strokes for every 1000 patients treated. The avoidance of complications
would likely translate into cost savings, leading aspirin to be considered a “strongly
dominant” therapy.
Heparin for the treatment of acute myocardial infarction has also not been formally
evaluated in an economic analysis, since it has not been shown to provide a strong ben-
efit for acute myocardial infarction in the aspirin era (47). In addition, while aspirin plus
heparin is the standard of care for patients hospitalized with unstable angina, a meta-
analysis of the unstable angina studies found only borderline significant results in favor
of heparin (48). Given the uncertainty about its effectiveness, heparin would only be a
favored therapy if there were evidence that heparin reduces cost. No studies have
revealed an economic advantage to heparin therapy in this setting.
New agents are emerging with increasing frequency. For example, low-molecular-
weight heparin is emerging as an effective therapy for unstable angina (49). The greater
cost and benefit of this new treatment makes it ideal for economic analyses. Mark and
colleagues performed an economic analysis for a subset of patients enrolled in the Effi-
cacy and Safety of Subcutaneous Enoxaparin in Non-Q-Wave Coronary Events Study
Group (ESSENCE) (50). Patients treated with enoxaparin had lower resource use dur-
ing the initial hospitalization, and this benefit persisted at 30 d, with a cumulative cost
savings associated with enoxaparin of $1172 (p ϭ 0.04). The investigators concluded
that enoxaparin both improves important clinical outcomes and saves money relative to
therapy with standard unfractionated heparin, making it a strongly dominant therapy.
Use of Glycoprotein IIb/IIIa Inhibitors in the Setting of High-Risk PCI
The use of the monoclonal antibody fragment abciximab inhibitor of the platelet
receptor glycoprotein (GP) IIb/IIIa has become common in the setting of PCI, but espe-
cially so in patients undergoing PCI in the setting of ACS. Treatment of high risk patients
undergoing coronary revascularization reduces the short-term risk of the composite of
death, myocardial infarction or coronary revascularization (51). An economic analysis
of the Early Postmenopausal Intervention Cohort (EPIC) trial found that the use of this
therapy for high-risk patients was associated with a cost savings of $622/patient during
the initial hospitalization from reduced acute ischemic events (52). During the 6-mo fol-
low-up, the therapy decreased repeat hospitalization rates by 23% (p ϭ 0.004) and
repeat revascularization by 22% (p ϭ 0.04), producing a mean $1270 savings/patient
(exclusive of drug cost) (p ϭ 0.018). If the cost of the drug were less than $1270, then
the strategy would be effective and cost saving.
The Randomized Efficacy Study of Tirofiban for Outcomes and Restenosis
(RESTORE) trial found that in patients undergoing coronary angioplasty for ACS,
tirofiban protects against early adverse cardiac events related to abrupt closure (53). A
subsequent economic analysis reported that the use of tirofiban (including drug costs)
was not associated with an increase in health care costs (54).
Neither of these studies directly examined the use of these agents in patients with
acute ischemic syndromes. TACTICS-TIMI 18 trial has specifically addressed this issue
(55).
718 Weintraub
Invasive vs Conservative Strategies in Non-ST-Segment Elevation ACS
The relative value of an invasive strategy with early catheterization and possible
revascularization compared with a conservative strategy with exercise testing in patients
with unstable angina or non-ST-segment elevation acute myocardial infarction has been
studied in several clinical trials in the pre-stent, pre-GP IIb/IIIa blocker era, with equiv-
ocal results (56–58). More recently the Fast Revascularization during Instability in
Coronary Artery Disease (FRISC) trial, which included the use of coronary stents,
showed a reduction in events at 6 mo with an invasive strategy. None of these trials
included a prospective economic component.
An invasive vs a conservative strategy for non-ST-segment elevation ACS was stud-
ied in the TACTICS-TIMI 18 trial. TACTICS-TIMI 18 included the use of both intra-
coronary stents and the GP IIb/IIIa blocker aggrastat. It is also the first trial in this area
with a formal cost and cost-effectiveness analysis built into the structure of the trial
(55,59). In TACTICS-TIMI 18, 2220 patients with unstable angina were randomized to
an early invasive strategy with routine catheterization within 4–48 h and revasculariza-
tion as appropriate, or to a more conservative (“selective invasive”) strategy, with
catheterization performed in the event of recurrent ischemia or a positive stress test
(60). The primary end point was a composite of death, myocardial infarction or rehos-
pitalization for an ACS at 6 mo. The primary end point was reduced with the early inva-
sive strategy compared to the conservative strategy, 15.9 vs 19.4%, odds ratio 0.78,
95% CI: 0.62–0.97, p ϭ 0.025. The incidence of death or myocardial infarction at 6 mo
was similarly reduced (7.3 vs 9.5%, respectively, OR 0.74, 95% CI: 0.54–1.00, p ϭ
0.0498). Direct costs examined included those associated with: hospitalizations, emer-
gency room visits, inpatient rehabilitation, nursing home stays, office visits and proce-
dures, and cardiac-related medications (61). Indirect costs resulting from lost
productivity were estimated from work days missed and patient-reported work effec-
tiveness levels according to employment classification. Total 6-mo costs did not differ
significantly between the two treatment arms. Average total cost for the invasive arm
was $20,616 vs $19,987 for the conservative arm. The 95% CI for the $629 difference
(invasive minus conservative) was (–$1237, $2455). Mean cost of the initial hospital-
ization was significantly higher for the invasive arm ($14,660) than the conservative
arm ($12,666); the 95% CI for the $1994 cost difference was ($610, $3288). However,
mean 6-mo follow-up costs incurred postdischarge were significantly higher for the
conservative arm: $7203 vs $6063, largely due to rehospitalizations. The –$1140 cost
difference had an associated 95% CI of (–$2238–$36). In patients with unstable
angina/non-ST-segment elevation myocardial infarction treated with the GPIIb IIIa
inhibitor tirofiban, the clinical benefit of an early invasive strategy is achieved without
an economically relevant increase in cost.
b-BLOCKER THERAPY
b-blocker therapy has been shown to reduce mortality following an acute myocardial
infarction (62). Goldman and colleagues conducted the most widely cited economic
analysis of the costs and effectiveness of b-blocker therapy (63). Using data from the
literature, they estimated that b-blocker therapy produced a relative reduction in mor-
tality of 25% in yr 1–3 after an infarction and a 7% reduction for yr 4–6. They evalu-
ated the cost-effectiveness of the therapy under the assumption that the benefit did not
Economics of Acute Coronary Syndromes 719
persist after yr 6. Costs were calculated using 1987 dollars. The investigators stratified
potential patients by their estimated mortality into low risk (1.5% in the first yr),
medium risk (7.5% in the first yr), and high risk (13% in the first yr). The cost-effec-
tiveness ratio was strongly associated with the underlying risk of the patient. For a 45-
yr-old man with low risk, the cost-effectiveness ratio was $23,457, with medium risk
was $5890, and with high risk was $3623.
Angiotensin-Converting Enzyme Inhibition
Several large randomized trials have demonstrated a reduction in acute myocardial
infarction for patients with left ventricular dysfunction after an acute myocardial infarc-
tion who are treated with an angiotensin-converting enzyme (ACE) inhibitor (64). Tse-
vat and colleagues (65) examined the cost-effectiveness of this intervention using
resource utilization, survival, and health-related quality of life information from the Sur-
vival and Ventricular Enlargement (SAVE) trial, a randomized trial of captopril for sur-
vivors of a myocardial infarction with an ejection fraction of 40% or less. The
investigators conservatively estimated that the benefit of captopril did not persist beyond
4 yr. The trial found that captopril improved survival at 3.5 yr by about 20%. Costs were
calculated in 1991 dollars. The cost-effectiveness ranged from $60,800/quality-adjusted
life year for 50-yr-old patients to $3600 for 80-yr-old patients. McMurray and col-
leagues also found that ACE inhibitors are an economically attractive intervention after
myocardial infarction (66).
Rehabilitation
In a decision analytic model, Ades et al. (67) studied the cost-effectiveness of car-
diac rehabilitation to coordinate exercise training and secondary prevention after acute
myocardial infarction. The cost-effectiveness of cardiac rehabilitation, in dollars/yr of
life saved, was calculated by combining published results of randomized trials of car-
diac rehabilitation on mortality rates, epidemiologic studies of long-term survival in
the overall postinfarction population, and studies of patient charges for rehabilitation
services and averted medical expenses for hospitalizations after rehabilitation. Car-
diac rehabilitation participants had an incremental life expectancy of 0.202 yr. In
1988, the average cost of rehabilitation and exercise testing was $1485, partially off-
set by averted cardiac rehospitalizations of $850/patient. A cost-effectiveness value
of $2130/yr of life saved was determined for the late 1980s, projected to a value of
$4950/yr of life saved in 1995. A sensitivity analysis was conducted to support these
findings.
SUMMARY
ACS remain a serious medical problem, which can be associated with death and dis-
ability on one hand, and considerable resource utilization on the other. The primary
driver for choice of therapy must remain clinical efficacy. Once efficacy is established,
cost-effectiveness analysis has an important role. Resources are limited, and responsi-
ble choices must be made. The methods involved in cost-effectiveness analysis are com-
plicated, and data for the analysis are generally not fully optimal. Nonetheless,
cost-effectiveness analysis offers the best method for helping society make rational
medical decisions. Good therapy at a reasonable price for the treatment of ACS have
720 Weintraub
generally proven to be cost-effective. Thus, most of the major therapies for ACS,
including reperfusion, acute PCI, use of GP IIb/IIIa blockers, use of an invasive strat-
egy in high risk patients, use of aspirin, b-blockers, and ACE inhibition are quite rea-
sonably cost-effective.
REFERENCES
1. American Heart Association. 2001 Heart and Stroke Statistical Update. American Heart Association,
Dallas, 2000.
2. Drummond MF, Stoddart GL, Torrance GW. Methods for the Economic Evaluation of Health Care
Programmes. Oxford University Press, Oxford, 1990.
3. Schlander M. Rational resource allocation in the health care system, part 1—Why rationing may
become inevitable. Medizinische Welt 1999;50:36–41.
4. Weintraub WS, Warner CD, Mauldin PD, et al. Economic winners and losers after introduction of an
effective new therapy depend on the type of payment system. Am J Managed Care 1997;3:743–749.
5. Weintraub WS. Microeconomic methods in cardiovascular care. In: Talley JD, Mauldin PD, Becker ER
eds. Cost-Effective Diagnosis and Treatment of Coronary Artery Disease. Williams & Wilkins, Balti-
more, 1999, pp. 17–29.
6. Rothermich EA, Pathak DS. Productivity-cost controversies in cost-effectiveness analysis: review and
research agenda. Clin Ther 1999;21:255–267.
7. Evans DB. Principles involved in costing. Med J Aust 1990;153:S10–S12.
8. Hlatky MA. Analysis of costs associated with CABG and PTCA. Ann Thorac Surg 1996;61:S30–S32.
9. Finkler SA. The distinction between costs and charges. Ann Intern Med 1982;96:102–109.
10. Finkler SA, Ward DM. Essentials of cost accounting for Health Care Organizations. 2nd edition. Aspen
Publication, 1999, pp. 11–43.
11. Hlatky MA, Lipscomb J, Nelson C, et al. Resource use and cost of initial coronary revascularization:
coronary angioplasty versus coronary bypass surgery. Circulation 1990;82(Suppl. IV):IV-208–IV-213.
12. Weintraub WS, Mauldin PD, Talley JD, et al. Determinants of hospital costs in acute myocardial infarc-
tion. Am J Managed Care 1996;2:977–986.
13. Lefebvre C, Van Der Perre T. Activity based costing. Acta Hospitalia 1994;34:5–16.
14. Coulam RF, Gaumer GL. Medicare’s prospective payment system: a critical appraisal. Health Care
Financ Rev 1991;13:45–77.
15. Becker ER, Mauldin PD, Culler SD, Kosinski AS, Weintraub WS, King SB III. Applying the Resource-
Based Relative-Value Scale to the Emory Angioplasty vs Surgery Trial. Am J Cardiol 2000;85:685–691.
16. Becker ER, Mauldin PD, Bernadino ME. Using physician work RVUs to profile surgical packages:
methods and results for kidney transplant surgery. Best Practi Benchmarking Healthc 1996;1:140–146.
17. Hsiao WC, Braun P, Yntema D, Becker ER. Estimating physicians’ work for a resource-based relative
value scale. N Engl J Med 1998;319:835–841.
18. Mitchell JB, Burge RT, Lee AJ, McCall NT. Per case prospective payment for episodes of hospital care.
Final Report to HCFA for Master Contract No. 500-92-0020. Health Economics Research, Inc. Oct.
6, 1995.
19. Weintraub WS, Craver JM, Jones EL, et al. Improving cost and outcome of coronary surgery. Circu-
lation 1998;98:23–28.
20. Gold MR, Siegel JE, Russell LB, et al. Cost-Effectiveness in Health and Medicine. Oxford University
Press, New York, 1996.
21. Spertus JA, Tooley J, Poston C, et al. Expanding the outcomes in clinical trials of heart failure: the
quality of life and economic components of EPHESUS (Eplerenone’s neuroHormonal Efficacy and
Survival Study). Am Heart J 2002;143:636–642.
22. Alchian A. The meaning of utility measurement. Am Econ Review 1953;43:26–50.
23. Feeny DH, Torrance GW, Furlong WJ. Health utilities index. In: Spilker B, ed. Quality of Life and
Pharmacoeconomics in Clinical Trials. Lippincott-Raven Press, Philadelphia, 1996, pp. 239–252.
24. Cook TA, O’Regan M, Galland RB. Quality of life following percutaneous transluminal angioplasty
for claudication. Eur J Vasc Endovasc Surg 1996;11:191–194.
25. Loomes G, McKenzie L. The use of QALYs in health care decision making. Soc Sci Med 1989;28:
299–308.
Economics of Acute Coronary Syndromes 721
26. Tosteson AN, Goldman L, Udvarhelyi IS, Lee TH. Cost-effectiveness of a coronary care unit versus
an intermediate care unit for emergency department patients with chest pain. Circulation 1996;94:
143–150.
27. Beamer AD, Lee TH, Cook EF, et al. Diagnostic implications for myocardial ischemia of the circadian
variation of the onset of chest pain. Am J Cardiol 1987;60:998–1002.
28. Krumholz HM, Pasternak RC, Weinstein MC, et al. Cost effectiveness of thrombolytic therapy with
streptokinase in elderly patients with suspected acute myocardial infarction. N Engl J Med 1992;327:
7–13.
29. Laffel GL, Fineberg HV, Braunwald E. A cost-effectiveness model for coronary thrombolysis/reper-
fusion therapy. J Am Coll Cardiol 1987;5(Suppl. B):79B–90B.
30. Simoons ML, Vos J, Martens LL. Cost-utility analysis of thrombolytic therapy. Eur Heart J
1991;12:694–699.
31. Midgette AS, Wong JB, Beshansky JR, Porath A, Fleming C, Pauker SG. Cost-effectiveness of strep-
tokinase for acute myocardial infarction: a combined meta-analysis and decision analysis of the effects
of infarct location and of likelihood of infarction. Med Decis Making 1994;14:108–117.
32. Herve C, Castiel D, Gaillard M, Boisvert R, Leroux V. Cost-benefit analysis of thrombolytic therapy.
Eur Heart J 1990;11:1006–1010.
33. Mark DB, Hlatky MA, Califf RM, et al. Cost effectiveness of thrombolytic therapy with tissue plas-
minogen activator as compared with streptokinase for acute myocardial infarction. N Engl J Med 1995;
332:1418–1424.
34. Kalish SC, Gurwitz JH, Krumholz HM, Avorn J. A cost-effectiveness model of thrombolytic therapy
for acute myocardial infarction. J Gen Intern Med 1995;10:321–330.
35. Lange RA, Hillis LD. Should thrombolysis or primary angioplasty be the treatment of choice for acute
myocardial infarction? Thrombolysis—the preferred treatment. N Engl J Med 1996;335:1311–1317.
36. Grines CL. Should thrombolysis or primary angioplasty be the treatment of choice for acute myocar-
dial infarction? Primary angioplasty—the strategy of choice. N Engl J Med 1996;335:1313–1317.
37. Berger AK, Schulman KA, Gersh BJ, et al. Primary coronary angioplasty vs thrombolysis for the man-
agement of acute myocardial infarction in elderly patients. JAMA 1999;282:341–348.
38. Grines CL, Browne KF, Marco J, et al. A comparison of immediate angioplasty with thrombolytic ther-
apy for acute myocardial infarction. The Primary Angioplasty in Myocardial Infarction Study Group.
N Engl J Med 1993;328:673–679.
39. Gibbons RJ, Holmes DR, Reeder GS, Bailey KR, Hopfenspirger MR, Gersh BJ. Immediate angio-
plasty compared with the administration of a thrombolytic agent followed by conservative treatment
for myocardial infarction. The Mayo Coronary Care Unit and Catheterization Laboratory Groups. N
Engl J Med 1993;328:685–691.
40. Zijlstra F, de Boer MJ, Hoorntje JC, Reiffers S, Reiber JH, Suryapranata H. A comparison of imme-
diate coronary angioplasty with intravenous streptokinase in acute myocardial infarction. N Engl J
Med 1993;328:680–684.
41. Reeder GS, Bailey KR, Gersh BJ, Holmes DR Jr, Christianson J, Gibbons RJ. Cost comparison of
immediate angioplasty versus thrombolysis followed by conservative therapy for acute myocardial
infarction: a randomized prospective trial. Mayo Coronary Care Unit and Catheterization Laboratory
Groups. Mayo Clin Proc 1994;69:5–12.
42. Stone GW, Grines CL, Rothbaum D, et al. Analysis of the relative costs and effectiveness of primary
angioplasty versus tissue-type plasminogen activator: the Primary Angioplasty in Myocardial Infarc-
tion (PAMI) trial. The PAMI Trial Investigators. J Am Coll Cardiol 1997;29:901–907.
43. Every NR, Parsons LS, Hlatky M, Martin JS, Weaver WD. A comparison of thrombolytic therapy with
primary coronary angioplasty for acute myocardial infarction. Myocardial Infarction Triage and Inter-
vention Investigators. N Engl J Med 1996;335:1253–1260.
44. Grines CL, Cox DA, Stone GW, et al. Coronary angioplasty with or without stent implantation for
acute myocardial infarction. N Engl J Med 1999;341:1949–1956.
45. Grines CL, Marsalese DL, Brodie B, et al. Safety and cost-effectiveness of early discharge after pri-
mary angioplasty in low risk patients with acute myocardial infarction. PAMI-II Investigators. Primary
Angioplasty in Myocardial Infarction. J Am Coll Cardiol 1998;31:967–972.
46. Randomised trial of intravenous streptokinase, oral aspirin, both, or neither among 17,187 cases of
suspected acute myocardial infarction: ISIS-2. ISIS-2 (Second International Study of Infarct Survival)
Collaborative Group. Lancet 1988;2:349–360.
722 Weintraub
47. Collins R, Peto R, Baigent C, Sleight P. Aspirin, heparin, and fibrinolytic therapy in suspected acute
myocardial infarction. N Engl J Med 1997;336:847–860.
48. Oler A, Whooley MA, Oler J, Grady D. Adding heparin to aspirin reduces the incidence of myocardial
infarction and death in patients with unstable angina. JAMA 1996;276:811–815.
49. Cohen M, Demers C, Gurfinkel EP, et al. A comparison of low-molecular-weight heparin with unfrac-
tionated heparin for unstable coronary artery disease. Efficacy and Safety of Subcutaneous Enoxaparin
in Non-Q-Wave Coronary Events Study Group (ESSENCE). N Engl J Med 1997;337:447–452.
50. Mark DB, Cowper PA, Berkowitz SD, et al. Economic assessment of low-molecular-weight heparin
(enoxaparin) versus unfractionated heparin in acute coronary syndrome patients: results from the
ESSENCE randomized trial. Efficacy and Safety of Subcutaneous Enoxaparin in Non-Q wave Coro-
nary Events [unstable angina or non-Q-wave myocardial infarction]. Circulation 1998;97:1702–1707.
51. Topol EJ, Califf RM, Weisman HF, et al. Randomised trial of coronary intervention with antibody
against platelet IIb/IIIa integrin for reduction of clinical restenosis: results at six months. The EPIC
Investigators. Lancet 1994;343:881–886.
52. Mark DB, Talley JD, Topol EJ, et al. Economic assessment of platelet glycoprotein IIb/IIIa inhibition
for prevention of ischemic complications of high-risk coronary angioplasty. EPIC Investigators. Cir-
culation 1996;94:629–635.
53. Topol EJ, Ferguson JF, Weisman HF, et al. Long-term protection from myocardial ischemic events in
a randomized trial of brief integrin beta-3 blockade with percutaneous coronary intervention. JAMA
1997;278:479–484.
54. Weintraub WS, Culler S, Boccuzzi SJ, et al. Economic impact of GPIIB/IIIA blockade after high-risk
angioplasty: results from the RESTORE trial. Randomized Efficacy Study of Tirofiban for Outcomes
and Restenosis. J Am Coll Cardiol 1999;34:1061–1066.
55. Weintraub WS, Culler SD, Kosinski A, et al. Economics, health-related quality of life, and cost-effec-
tiveness methods for the TACTICS (Treat Angina With Aggrastat [tirofiban]] and Determine Cost of
Therapy with Invasive or Conservative Strategy)-TIMI 18 trial. Am J Cardiol 1999;83:317–322.
56. Braunwald E, McCabe CH, Cannon CP, et al. Effects of tissue plasminogen activator and a compari-
son of early invasive and conservative strategies in unstable angina and non-Q-wave myocardial infarc-
tion: Results of the TIMI IIIB trial. Circulation 1994;89:1545–1556.
57. Boden WE, O’Rourke RA, Crawford MH, et al. Outcomes in patients with acute non-Q-wave myocar-
dial infarction randomly assigned to an invasive as compared with a conservative management strat-
egy. N Engl J Med 1998;338:1785–1792.
58. Ragmin F, Wallentin L, Swahn E, et al. Invasive compared with non-invasive treatment in unstable coro-
nary-artery disease: FRISC II prospective randomised multicentre study. Lancet 1999;354:708–715.
59. Cannon CP, Weintraub WS, Demopoulos LA, et al. Invasive versus conservative strategies in unstable
angina and non-Q wave myocardial infarction following treatment with tirofiban: rationale and study
design of the international TACTICS-TIMI 18 trial. Am J Cardiol 1998;82:731–736.
60. Cannon CP, Weintraub WS, Demopoulos LA, et al. Comparison of early invasive versus conservative
strategies in patients with unstable coronary syndromes treated with the glycoprotein IIb/IIIa inhibitor
tirofiban. N Engl J Med 2001;344:1879–1887.
61. Weintraub WS. Plenary session. American College of Cardiology 50th Annual Scientific Session.
Orlando, Florida. March 2001.
62. Yusuf S, Peto R, Lewis J, Collins R, Sleight P. Beta blockade during and after myocardial infarction:
an overview of the randomized trials. Prog Cardiovasc Dis 1985;27:335–371.
63. Goldman L, Sia ST, Cook EF, Rutherford JD, Weinstein MC. Costs and effectiveness of routine ther-
apy with long-term beta-adrenergic antagonists after acute myocardial infarction. N Engl J Med 1988;
319:152–157.
64. Brown NJ, Vaughan DE. Angiotensin-converting enzyme inhibitors. Circulation 1998;97:1411–1420.
65. Tsevat J, Duke D, Goldman L, et al. Cost-effectiveness of captopril therapy after myocardial infarc-
tion. J Am Coll Cardiol 1995;26:914–919.
66. McMurray JJ, McGuire A, Davie AP, Hughes D. Cost-effectiveness of different ACE inhibitor treat-
ment scenarios post-myocardial infarction. Eur Heart J 1997;18:1411–1415.
67. Ades PA, Pashkow FJ, Nestor JR. Cost-effectiveness of cardiac rehabilitation after myocardial infarc-
tion. J Cardiopulm Rehabil 1997;17:222–231.
Economics of Acute Coronary Syndromes 723
Smoking Cessation
Beth C. Bock, PHD and
Bruce Becker, MD, MPH
CONTENTS
OVERVIEW
TREATMENT APPROACHES
SPECIFIC TREATMENT PLANS
SUMMARY AND CONCLUSIONS
REFERENCES
OVERVIEW
Effects of Smoking on Health
Cigarette smoking continues to be one of the most prevalent causes of preventable
morbidity and mortality in the United States (1,2). In the United States, an estimated 47
million adults smoke, and over 400,000 deaths/yr are attributable to smoking (3,4).
Tobacco use is causally linked to diseases such as cancer, heart disease, stroke, and
chronic obstructive pulmonary disease (5) and is responsible for over $50 billion in
annual healthcare expenditures (6). Moreover, Environmental Tobacco Smoke (ETS) or
“second hand smoke” has been strongly associated with respiratory illness in children
and with both cancer and heart disease in adults living with smokers (7). The prevalence
of smoking decreased dramatically in the United States between 1950 and 1980 (8),
coinciding with the release of a series of reports from the U.S. Surgeon General regard-
ing the effects of tobacco smoking on health. However, this trend has not continued.
Today, one quarter of all adults living in this country smoke (9), and the rate of smok-
ing among high school students increased throughout the 1990s (10).
Smoking Cessation in Cardiac Patients
Each year, over 600,000 people are newly diagnosed with coronary heart disease
(CHD), presenting with events such as myocardial infarction (MI) or chronic conditions
such as angina pectoris, congestive heart failure, or arrhythmias (11). CHD is the lead-
ing cause of mortality in the U.S., accounting for almost half of all deaths in the United
States annually (12,13). Cigarette smoking greatly increases the risk of death from heart
disease. Specifically, mainstream smoke (MSS), which is smoke that is directly inhaled
by the smoker, has pathophysiologic effects on the heart, blood vessels, coagulation
26
725
From: Contemporary Cardiology: Management of Acute Coronary Syndromes, Second Edition
Edited by: C. P. Cannon © Humana Press Inc., Totowa, NJ
system and lipoprotein metabolism (14–16). MSS exposure leads to an increase in
white blood cell count and an increase in blood neutrophils, producing chronic eleva-
tions in oxygen-derived free radicals, fostering the development of atherosclerosis.
MSS exposure also reduces the number of circulating lymphocytes, suppresses T and
B cell function, and increases the concentration of free fatty acids (FFAs) in the blood,
which results in increased levels of low-density lipoproteins (15). MSS exposure also
reduces levels of high-density lipoprotens (HDL) and produces pathogenic changes in
myocardial vasculature, resulting in vasoconstriction and reduced blood flow and oxy-
gen and nutrient delivery to the myocardium. These pathological changes occur in non-
smokers exposed to ETS as well and follow a dose-response relationship when ETS
exposure is quantified in these subjects and compared to morbid cardiac outcomes.
While both mainstream smoking and ETS exposure significantly increase the indi-
vidual’s risk of CHD, smoking cessation produces marked reductions in cardiovascular
risk (5). The experience of hospitalization, particularly for cardiovascular disease, can
result in smoking cessation even without intervention (17–19). However, cessation rates
vary greatly depending upon reason for hospitalization, length of stay, and the presence
of depressive symptoms (20). For example, Rigotti and colleagues (21) found high ces-
sation rates (58%) 1 yr after hospitalization among coronary bypass patients, while other
studies have shown very low cessation among smokers immediately after hospitaliza-
tion (13.7%) and at 1-yr follow-up (9.2%) (22). While the majority of individuals who
quit smoking without intervention will relapse within 3 mo, individuals provided with
professional intervention had lower rates of relapse (23).
Physician Interventions for Smoking Cessation
While 70% of smokers visit a physician each year, very few of their doctors use this
opportunity to address the patient’s smoking (24). Physicians practicing in specialties
such as cardiology or emergency medicine are less likely to provide smoking cessation
interventions than primary care physicians (25). Possible explanations cited for low
physician intervention rates include lack of time, deficient training in counseling skills,
and an absence of organizational support (26–29). This low prevalence is especially
unfortunate as multiple studies have shown that even brief interventions, lasting less
than 3 min, will significantly increase the probability that the smoker will quit (30). For-
mal physician training, the use of cues or reminders, pharmacological aids, follow-up
visits, and supplemental educational materials all increase the effectiveness of physi-
cian-delivered interventions (31).
Cardiologists seeing smokers with coronary artery disease, hypertension, or histories
of recurrent chest pain, can be especially effective because the patient’s illness can be
linked directly to smoking. The clinical encounter is a great teachable moment (32) which
should be seized. Many physicians do not feel that they have the counseling skills or
training to address smoking cessation effectively. This chapter will provide a well-stud-
ied, effective, and simple approach that cardiologists can use with their smoking patients.
TREATMENT APPROACHES
Recently, clinical guidelines have been developed through a joint collaboration
between the Centers for Disease Control (CDC) and the Agency for Healthcare Research
and Quality (AHRQ) together with the National Cancer Institute, the National Heart
726 Bock and Becker
Lung and Blood Institute, the National Institute on Drug Abuse, the Robert Wood John-
son Foundation, and the University of Wisconsin Medical School Center for Tobacco
Research and Intervention (30). The recommendations made as a result of this extensive
systematic review and analysis of the extant peer-reviewed scientific literature form the
basis of the approach taken in this chapter.
The key principles underlying these recommendations are:
1. Physicians should identify all of their patients who smoke.
2. Physicians should be conversant with all of the current effective treatments available for
tobacco dependence.
3. Physicians should offer treatment to all of their smoking patients who are ready to quit.
4. Even smoking patients who are not yet ready or willing to quit should be offered treat-
ment because intervention by a physician demonstrably increases the smoker’s readiness
and motivation to quit.
5. The physician should understand that tobacco dependence is a chronic condition that
typically requires repeated intervention before long-term success is achieved.
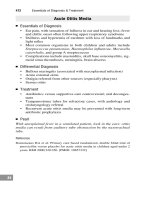
The best practice model of brief intervention for smoking cessation is easily sum-
marized by the mnemonic device of the “Five A’s”.
The Five A’s are:
ASK: The physician should ask all patients if they smoke or have recently quit.
ADVISE: The physician should give every tobacco user clear, strong, and personal-
ized advice to quit.
ASSESS: The physician should assess the patient’s level of nicotine dependence and
readiness to quit.
ASSIST: The physician should assist the patient in obtaining one or more of the
effective treatments that exist for smoking cessation.
ARRANGE FOLLOW-UP: The physician should arrange follow-up to reinforce
successful efforts and to identify slips early, so that barriers can be identified and moti-
vation to try again can be renewed.
Each of the Five A’s are summarized in Fig. 1, with links (in parentheses) to check-
lists and resources throughout the remainder of this chapter.
(1) ASK
National guidelines recommend that physicians systematically determine the smok-
ing status of all patients at every visit. One simple method of accomplishing this goal
incorporated a routine vital sign chart containing a smoking section. This small change
Smoking Cessation 727
substantially increased the likelihood that smoking intervention was addressed during
the patient visit (33).
(2) ADVISE
EVERY TOBACCO USER SHOULD BE GIVEN ADVICETOQUIT
THAT
IS CLEAR,STRONG, AND PERSONALIZED
Smoking cessation counseling is one of the most cost-effective healthcare interven-
tions that can be made. Unfortunately research has repeatedly shown that smoking coun-
seling is not provided at most physician visits (27). Counseling does not need to be
extensive to be effective. Advice which is clear, direct, and tailored to the individual
728 Bock and Becker
Fig. 1.
patient’s medical history or physical symptoms is more effective than generalized
generic advice (30). Brief, clear advice from a physician has been shown to double quit
rates. For example, advice to a patient who is currently enrolled in cardiac rehabilitation
might sound like this:
•Clear: “It is important for you to quit smoking.”
• Strong: “Since you’ve already experienced heart disease (or specify condition),
the most important thing you can do to avoid repeating this experience is to quit
smoking.”
•Personal: “Your risk of having a second MI will be a lot lower is you quit smok-
ing.”
Other phrases which work are: “As your physician, I want you to know that the most
important thing you can do, to protect or improve your health, is to quit smoking.” “Quit-
ting smoking is important for everyone who smokes, but for you it’s especially impor-
tant because of (specify current health problem).”
ASSESS
ASSESS THE P
ATIENT’S READINESS TO QUIT SMOKING AND
LEVEL OF NICOTINE DEPENDENCE
(3) Readiness to Quit Smoking. Readiness to quit smoking is a key determinant of
treatment approach. Treatment for smokers who are ready to make a serious quit
attempt should be focused on behavioral strategies, including selecting a Target Quit
Date (TQD), reviewing and arranging appropriate pharmacological therapies, and refer-
ral to self-help or professional programs. Treatment for smokers who are not ready to
quit should focus on increasing the patient’s motivation to quit. Treatment for these
smokers should focus on the psychological issues surrounding cessation, including rea-
sons for quitting vs reasons for continuing smoking, concerns about the cessation
process, the patient’s self-confidence, and family and/or social supports and barriers to
quitting (Fig. 2).
Motivation or readiness to quit smoking has most often been measured using Pro-
chaska and DiClemente’s Stages of Change model (35), which was developed for use in
outpatient populations. As most hospitals impose smoking restrictions in the inpatient
setting, and hospitalization itself encourages serious thought about smoking habits,
employing this algorithm in the inpatient setting introduces a bias misclassifying smok-
ers into higher motivation to quit categories. Recent research has shown that a single
question, “How likely it is that you will remain abstinent after hospital discharge?” has
a higher predictive value for predicting sustained quits in hospital inpatients (36).
(4) Nicotine Dependence. The most widely used and validated measure of nicotine
dependence is the Fagerstrom Test for Nicotine Dependence (FTND). Patients scoring
Ն6 are considered highly nicotine dependent. While research shows that most smokers
benefit from nicotine replacement therapy (NRT) and that providing NRT is especially
important for highly dependent smokers. Smokers who use nicotine replacement show
double the success rates as those who do not (30,37), but this effect is most pronounced
among highly nicotine-dependent smokers. Highly nicotine-dependent smokers are 3ϫ
more likely to be successful if they use nicotine replacement than if they do not. More-
over, the physician should choose the initial dose of NRT after considering the patient’s
level of nicotine dependence (see Table 1) and the patient’s current smoking rate.
Smoking Cessation 729