Applications of Environmental Chemistry: A Practical Guide for Environmental Professionals - Chpater 5 ppsx
Bạn đang xem bản rút gọn của tài liệu. Xem và tải ngay bản đầy đủ của tài liệu tại đây (2.15 MB, 33 trang )
5
Petroleum Releases
to the Subsurface
CONTENTS
5.1 The Problem
5.2 General Characteristics of Petroleum
Types of Petroleum Products
Gasolines
Middle Distillates
Heavier Fuel Oils and Lubricating Oils
5.3 Behavior of Petroleum Hydrocarbons in the Subsurface
Soil Zones and Pore Space
Partitioning of Light Nonaqueous Phase Liquids (LNAPLs) in the Subsurface
Oil Mobility Through Soils
Processes of Subsurface Migration
Behavior of LNAPL in Soils and Groundwater
Summary of LNAPL Behavior
“Weathering” of Subsurface Contaminants
5.4 Petroleum Mobility and Solubility
5.5 Formation of Petroleum Contamination Plumes
Dissolved Contaminant Plume
Vapor Contaminant Plume
5.6 Estimating the Amount of Free Product in the Subsurface
Effect of LNAPL Subsurface Layer Thickness on Well Thickness
Effect of Soil Texture
Effect of Water Table Fluctuations on LNAPL in Subsurface and Wells
Effect of Water Table Fluctuations on Well Measurements
5.7 Estimating the Amount of Residual LNAPL Immobilized in the Subsurface
Subsurface Partitioning Loci of LNAPL Fuels
5.8 DNAPL Free Product Plume
Testing for the Presence of DNAPL
5.9 Chemical Fingerprinting
First Steps in Chemical Fingerprinting of Fuel Hydrocarbons
Identifying Fuel Types
Age-Dating Diesel Oils
Simulated Distillation Curves and Carbon Number Distribution Curves
References
5.1 THE PROBLEM
A major federal law governing pollution from underground storage tanks is described in Subtitles I
and C of the Resource Conservation and Recovery Act (RCRA). Spills to any navigable waters are
regulated under the Federal Clean Water Act. One EPA estimate puts leaks from 2 to 7 million
underground tanks as the source of 45% of all groundwater contamination, with 95% of the leaking
L1354/ch05/Frame Page 121 Thursday, April 20, 2000 10:56 AM
Copyright © 2000 CRC Press, LLC
tanks containing motor fuel. The rest contain heating oil, industrial solvents, and liquid wastes,
among others.
The EPA estimates that more than half of all underground storage tanks installed before 1993
have developed leaks. Approximately 40% of the 210,000 retail service stations in the U.S. have
had accidental releases of gasoline and diesel to the subsurface. Current legislation requires all new
tanks that are installed after 1993 to have a leak detection system. Starting in 1998, tanks containing
petroleum products or hazardous chemicals are required to have overfill and spill prevention devices,
and double walls or concrete vaults. This goes a long way to prevent the problem from getting
worse, but existing subsurface contamination must still be dealt with.
5.2GENERAL CHARACTERISTICS OF PETROLEUM
Petroleum liquids are complex mixtures of hundreds of different hydrocarbons, with minor amounts
of nitrogen, oxygen, sulfur, and some metals. Nearly all petroleum compounds are nonpolar and
not very soluble in water. The behavior of these compounds in a groundwater environment depends
on the physical and chemical nature of the particular hydrocarbon blend as well as the particular
soil environment. For example, the migration potential and partitioning coefficients of each com-
pound depend on the composition of the petroleum mixture in which it is found, the properties of
the pure compound, and the characteristics of the surrounding soil. Furthermore, the properties of
petroleum contaminants change as the petroleum ages and weathers.
Many nonfuel organic pollutants, such as chlorinated hydrocarbons and pesticides, are more
soluble in petroleum than in water. Therefore, if an oil spill occurs where organic contamination
already exists, the older pollutants tend to concentrate from soil surfaces and pore-space water into
the fresh oil phase. An oil spill into an already contaminated soil can mobilize other pollutants that
have been immobilized there by sorption and capillarity. As freshly spilled oil moves downward
through the soil, immobilized pollutants can dissolve into the moving liquid oil and be carried
along with it. Analysis of spilled petroleum products will often detect other organic compounds
that were previously sorbed to the soil.
T
YPES
OF
P
ETROLEUM
P
RODUCTS
The first step in refining crude oil into petroleum products is usually through fractional distillation
which is a process that separates the oil components according to their boiling points. The resulting
products are groups of mixtures, or fractions, each of which have boiling points within a specified
range. All but the lightest fractions can contain up to hundreds of different hydrocarbon compounds.
The fractions are often classified into the general groups described in Table 5.1. In addition, several
pure
petrochemicals
may be produced, such as butane, hexane, benzene, toluene, and xylene, for
use as solvents, for production of plastics and fibers, and for reblending into fuel mixtures. Refined
petroleum products are further modified by catalytic cracking, blending, and reformulation pro-
cesses to enhance desirable properties.
G
ASOLINES
Gasolines are among the lightest liquid fractions of petroleum and consist mainly of aliphatic and
aromatic hydrocarbons in the carbon number range C4–C12.
Aliphatic hydrocarbons
consist of
Rule of Thumb
The larger the hydrocarbon compound and the more carbon atoms it contains, the higher are its boiling
point and viscosity, and the lower its volatility.
L1354/ch05/Frame Page 122 Tuesday, April 18, 2000 1:49 AM
Copyright © 2000 CRC Press, LLC
•
Alkanes:
Are saturated hydrocarbons (all carbons are connected by single bonds) having
linear, branched, or cyclic carbon-chain structures such as pentane, octane, decane,
isobutane, or cyclohexane.
•
Alkenes:
Are unsaturated hydrocarbons having one or more double bonds between carbon
atoms. They also may have linear, branched, or cyclic carbon-chain structures.
•
Alkynes:
Are unsaturated hydrocarbons having one or more triple bonds between carbon
atoms. They also may have linear, branched, or cyclic carbon-chain structures.
Aromatic hydrocarbons
(also called
arenes
) are hydrocarbons based on the benzene ring as a
structural unit. They include monocyclic hydrocarbons such as benzene, toluene, ethylbenzene,
and xylene (the
BTEX
group, see Figure 5.1), and polycyclic hydrocarbons such as naphthalene
and anthracene.
M
IDDLE
D
ISTILLATES
Middle distillates cover a broad range of hydrocarbons in the range of C6–C25. They include diesel
fuel, kerosene, jet fuels, and lighter fuel oils. Typical middle distillate products are blends of up
to 500 different compounds. They tend to be denser, more viscous, less volatile, less water soluble,
and less mobile than gasoline. They contain low percentages of the lighter weight aromatic BTEX
group, which may not be detectable in older releases due to degradation or transport.
TABLE 5.1
Principal Petroleum Fractions from Fractional Distillation
Boiling Range
(
°
C)
Dominant
Composition Range
a
Fraction Uses
–160 to +30 C1–C4 Gases LPN, methane, gaseous fuels, feedstock for plastics
30–60 C5–C7 Petroleum Ether Solvents, gasoline additives
90–130 C6–C9 Ligroin, Naphtha Solvents
40–200 C4–C12 Gasoline Motor fuel
60–200 C7–C12 Mineral Spirits Solvents
150–300 C10–C16 Kerosene Jet fuel, diesel fuel, lighter fuel oils
300–350 C16–C18 Fuel Oil Diesel oil, heating oil, cracking stock
>350 C18–C24 Lubricating Stock Lubricating oil, mineral oil, cracking stock
Solid Residue C25–C40 Paraffin Wax Candles, toiletries, wax paper
Solid Residue >C40 Residuum Roofing tar, road asphalt, waterproofing
a
The notation used here gives the number range of carbon atoms in the fraction compounds. For example, C5–C7
means hydrocarbon compounds containing between 5 and 7 carbon atoms. As this Table indicates, as the number of
carbon atoms in a hydrocarbon molecule increases, so do its boiling temperature and its viscosity. The volatility decreases
as the number of carbon atoms in a compound increases.
Rules of Thumb for Gasoline Properties
1. Gasoline mixtures are volatile, somewhat soluble, and mobile in the groundwater environment.
2. Gasolines contain a much higher percentage of the BTEX group of aromatic hydrocarbons (benzene,
toluene, ethylbenzene, and the xylene isomers) than do other fuels, such as diesel. They contain lower
concentrations of heavier aromatics like naphthalene and anthracene than do diesel and heating fuels.
Therefore, the presence of BTEX is often a useful indicator of gasoline contamination.
3. Oxygenated compounds such as alcohols (methanol and ethanol) and ethers (methyltertiary-butyl
ether, MTBE) are normally added as octane boosters and oxygenators. MTBE is the most commonly
used of these. Modern gasolines (since 1980) may contain around 15% MTBE by volume.
L1354/ch05/Frame Page 123 Tuesday, April 18, 2000 1:49 AM
Copyright © 2000 CRC Press, LLC
H
EAVIER
F
UEL
O
ILS
AND
L
UBRICATING
O
ILS
These are composed of heavier molecular weight compounds than the middle distillates, encom-
passing the approximate range of C15–C40. They are more viscous, less soluble in water, and less
mobile in the subsurface than the middle distillates.
Figure 5.2 relates the carbon number of a petroleum compound to its properties, uses, and the
instrumental methods used for its analysis. The following are notes for Figure 5.2:
•EPA 418.1 = infrared spectroscopy. It is used as a low cost screening method for total
petroleum hydrocarbons (TPH).
•EPA 8015 = gas chromatography (GC) with a flame ionization detector.
•EPA 8020 = GC with photo ionization detector. It is used for total BTEX analysis.
•EPA 8260 = GC with mass spectrometer detector (GC/MS). It is used for volatile organic
compounds.
•EPA 8270 = GC/MS. It is used for extractable organic compounds.
•ECD = electron capture GC detector.
•ELCD = electrolytic conductivity GC detector.
•FID = flame ionization GC detector.
•PID = photo ionization GC detector.
5.3BEHAVIOR OF PETROLEUM HYDROCARBONS IN
THE SUBSURFACE
Because of their low water solubilities, most of the compounds classified as petroleum hydrocarbons
are generally considered as
nonaqueous phase liquids
(NAPL). If mixed into water, NAPLs separate
into a distinct liquid phase with a well-defined boundary between the NAPL and the water, like
oil and water or milk and cream.
NAPLs are further subdivided into
light nonaqueous phase liquids
(LNAPL) and
dense non-
aqueous phase liquids
(DNAPL). LNAPLs are liquid hydrocarbon compounds or mixtures that are
less dense than water, such as gasoline and diesel fuels and their individual components. DNAPLs
FIGURE 5.1
The BTEX group of aromatic hydrocarbons.
L1354/ch05/Frame Page 124 Tuesday, April 18, 2000 1:49 AM
Copyright © 2000 CRC Press, LLC
are liquid hydrocarbon compounds or mixtures that are more dense than water, such as creosote,
PCBs, coal tars, and most chlorinated solvents (chloroform, methylene dichloride, etc.).
The distinction between LNAPLs and DNAPLs is important because of their different behavior
in the subsurface. LNAPL spills travel downward through soils only to the water table, where they
remain “floating” on the water table surface. DNAPLs sink through the water-saturated zone to
impermeable bedrock, where they collect in bottom pools. Obviously, remediation methods are
different for LNAPLs and DNAPLs.
S
OIL
Z
ONES
AND
P
ORE
S
PACE
As illustrated in Figure 5.3, the subsurface soil may be divided into a water-
unsaturated
zone, from
the soil surface down to just above the water table (also called the
vadose zone
), and a water-
saturated
zone, from the water table down to bedrock. Capillary action extends the saturated zone somewhat
above the water table with a region of transition between the unsaturated and saturated zones. The
capillary fringe can vary from a fraction of an inch in coarse-grained sediments to several feet in fine-
grained sediments such as clay.
Each zone contains soil particles with pore spaces between them. In normally permeable soils,
most of the pore spaces are continuous, allowing movement of water and liquid contaminants
through them. In the absence of contaminants, pore spaces in the unsaturated zone contain air with
some water adsorbed to the soil particles. Pore spaces in the saturated zone contain mainly water.
When contaminants enter the subsurface region as spilled liquid petroleum (free product),
•Volatile compounds vaporize from the free product mixture into the atmosphere and into
air in the soil pore spaces.
FIGURE 5.2
Hydrocarbon ranges, corresponding uses, and analytical methods.
L1354/ch05/Frame Page 125 Tuesday, April 18, 2000 1:49 AM
Copyright © 2000 CRC Press, LLC
• Many compounds in the free product partially dissolve into water contained on soil
particle surfaces, into water percolating down from the ground surface, and into ground-
water in the saturated zone.
• A small fraction of the free product is taken up by microbiota.
• The remaining free product adsorbs to soil particles and, where free product is abundant,
fills the pore spaces.
P
ARTITIONING
OF
L
IGHT
N
ONAQUEOUS
P
HASE
L
IQUIDS
(LNAPL
S
)
IN
THE
S
UBSURFACE
Before a petroleum release occurs, the voids of vadose zone earth materials are filled with air and
water. After a release, some voids contain immobile petroleum held by capillary forces and sorbed
to soil surfaces. There may also be liquid petroleum moving downward through the pore interstices
under gravity. If LNAPL reaches the water table, its buoyancy will prevent further downward
movement and it will spread out horizontally over the water table to form a layer of free product,
“floating” above the saturated zone. The individual components of the petroleum become partitioned
into air, water and solid phases that come in contact with the free product.
3
O
IL
M
OBILITY
T
HROUGH
S
OILS
Oil pollutants moving through soil, dissolved in water, or migrating as liquid free product leave a
trail of contamination sorbed on soil particles and trapped in soil pore spaces. This trapped contam-
ination is not easily removed by water flushing or air sparging. In the subsurface environment, a
significant portion of oil contamination must be regarded as “permanent,” with a lifetime of well
over 25 years, unless deliberate efforts are made to mobilize, degrade, or remove it.
2,4
Immobilized
FIGURE 5.3
Soil zones and partitioning behavior of free product pollutant. All the Ks are partition coefficients.
They quantitatively describe how the pollutant distributes itself among water, soil, air, and free product.
L1354/ch05/Frame Page 126 Tuesday, April 18, 2000 1:49 AM
Copyright © 2000 CRC Press, LLC
oil contaminants in the subsurface act as a long-term source of groundwater contamination, as the
more soluble components continue to diffuse to the oil-water interface and dissolve into the water.
This is nothing new to oil field workers. Liquid petroleum fields are found in rock formations
of 10% to 30% porosity. Up to half of the pore space contains water. Primary recovery of oil, which
relies on pumping out the portion of oil that is mobile and will accumulate in a well, collects only
15% to 30% of the oil in the formation. Secondary recovery techniques force water under pressure
into the oil-bearing rocks to drive out more oil. Primary and secondary techniques together extract
somewhat less than 50% of the oil from a formation. Tertiary recovery techniques use pressurized
carbon dioxide to lower oil viscosity along with detergents to solubilize the oil. Even with using
tertiary techniques, producers expect 40% of the oil to remain immobile and unrecoverable.
P
ROCESSES
OF
S
UBSURFACE
M
IGRATION
After part of the spilled petroleum has partitioned from the free product into other phases,
hydrocarbons (HCs) are present in solid, liquid, dissolved, and vapor phases.
1)
Solid phase HCs
are sorbed on soil surfaces or diffused into micropores and mineral
grain lattices. They are immobile and degrade very slowly.
2)
Liquid phase HCs
exist in the subsurface as
• Immobile residual liquids held by capillary forces and as a thin layer sorbed to
sediments in the unsaturated zone and capillary fringe.
• Free mobile liquids in the unsaturated zone above the capillary fringe.
• Immobile residual liquids trapped below the water table in the saturated zone.
3)
Dissolved phase HCs
are found in
• Water infiltrating through the unsaturated zone.
• The residual films of groundwater sorbed to sediments in the capillary fringe and
elsewhere in the HC plume.
• The groundwater of the saturated zone.
4)
Vapor phase HCs
are found
• Mostly in void spaces of the unsaturated zone not occupied by water or liquid HCs.
Here, they are mobile.
• As small bubbles trapped in the HC plume and in the water-bearing zone below the
plume. Here, they are immobile.
• Dissolved in the groundwater of the saturated zone, where they move with the ground-
water.
B
EHAVIOR
OF
LNAPL
IN
S
OILS
AND
G
ROUNDWATER
LNAPL movement in the subsurface is a continual process of partitioning different components
among different phases that are present in the subsurface matrix. Spilled LNAPL at or near the
soil surface penetrates and thoroughly saturates the soil because there is little trapped water or air
to block its movement. Under the influence of gravity, the LNAPL sinks vertically downward,
leaving behind in the soil a trail of residual LNAPL trapped by sorption and capillary forces.
Capillary forces cause the LNAPL to spread horizontally as well as vertically downward, creating
an inverted funnel-shaped zone of soil contamination.
As liquid free product moves downward through soil, a significant portion becomes immobilized
by sorption to soil particle surfaces and capillary entrapment in soil pore space. This continually
reduces the amount of mobile contaminant. If the liquid free product is not replenished by a
continuing leak, it eventually is completely depleted by entrapment in the soil and becomes
essentially immobilized. However, even when immobilized, the trapped free product continues to
lose mass into the dissolved and vapor phases during biodegradation.
L1354/ch05/Frame Page 127 Tuesday, April 18, 2000 1:49 AM
Copyright © 2000 CRC Press, LLC
When all the spilled oil has entered the subsurface, the LNAPL “front” continues downward,
leaving behind an ever-widening “inverted funnel” of contaminated soil containing residual
“immobile” LNAPL sorbed to soil surfaces and trapped in pore spaces. The term “immobile” is
used loosely and really means that, although some mobility may still occur, it will be very slow
compared to the remediation time frame of interest.
A spill may or may not reach the water table. If the groundwater table is deep enough or if the
amount of spilled LNAPL is small enough, the mobile LNAPL can be completely depleted by
entrapment in the soil before it reaches the groundwater. If the spill is large enough or the
groundwater table is shallow, mobile LNAPL, commonly called free product, will contact the
groundwater. The weight of the free product depresses the water table locally below the free product
column (see Figure 5.4).
Free product will continue to spread laterally as a layer over the water table, leaving a trail of
residual LNAPL entrapped in the soil, until it spreads out to a saturation level so low that it all
becomes immobile. The lateral spreading of the free product is influenced by a viscous “frictional”
interaction at the water-LNAPL interface, which tends to move the free product preferentially in
the direction of groundwater movement, along the hydraulic gradient. The relative downgradient
velocities of water and free product depend on their relative viscosities and the soil conductivities
for the different liquids.
When the water table rises and falls, the “floating” free product is moved vertically, “smearing”
LNAPL into a region thicker than the free product thickness. Still more residual LNAPL becomes
immobilized in this “smear zone.” The end result is that the smear zone of entrapped LNAPL
extends above and below the average level of the water table.
1
FIGURE 5.4
LNAPL fuel leaking from underground storage tanks migrates downward under gravity. Enough
fuel free product has leaked from the left tank to reach the saturated zone and spread out above the water
table, moving in the direction of groundwater flow. The smaller spill from the right tank is insufficient to
reach the water table and has become immobilized within the unsaturated zone by sorption and capillary
forces. The more soluble components of the free product are present in the dissolved plume, which extends
beyond the free product plume into the saturated zone. There also is a vapor plume in the unsaturated zone
of the most volatile components. The vapor plume extends in all directions independent of gravity. It may
enter underground cavities such as sewers and basements, and may escape through the ground surface into
the atmosphere.
L1354/ch05/Frame Page 128 Tuesday, April 18, 2000 1:49 AM
Copyright © 2000 CRC Press, LLC
S
UMMARY
OF
LNAPL B
EHAVIOR
The following summarizes the behavior of spilled LNAPL:
1. Spilled liquid hydrocarbons move downward through the unsaturated zone under gravity.
2. A large fraction sorbs to the subsoil surfaces as trapped residual free product.
3. Some horizontal spreading occurs in the unsaturated zone because of attractive forces
to mineral surfaces and capillary attractions.
4. Free product tends to accumulate and spread horizontally above layers of low perme-
ability (low hydraulic conductivity).
5. At the water-bearing region of the capillary fringe, the free liquid phase floats on the
water and begins to move laterally.
6. If the spill is small enough, LNAPL may not reach the water table. However, a portion
that dissolves in downward percolating water will be carried to the water table and will
contaminate it.
7. The vapor phase spreads widely in the unsaturated zone and can escape to the atmosphere
and accumulate in cellars, sewers, and other underground air spaces.
“W
EATHERING
”
OF
S
UBSURFACE
C
ONTAMINANTS
With time, the composition of immobilized oil changes in the following ways:
• Less viscous components move downgradient through the soils.
• Volatile components are lost into the atmosphere.
• Soluble components are lost into the groundwater.
• Biodegradable components are lost to bacterial activity.
However, the total mass of immobilized oil decreases slowly because the loss processes are
usually slow unless they are artificially enhanced as part of a remediation program. The natural
rate of depletion becomes progressively slower with time, as the remaining contaminants are
increasingly rich in those components that resist the loss mechanisms. The remaining oil becomes
more and more firmly fixed in the subsurface soil, continually releasing its more soluble components
in slowly decreasing concentrations to the groundwater.
5.4 PETROLEUM MOBILITY AND SOLUBILITY
The environmental impact of a contaminant release is determined mainly by the mobility and water
solubility of the different components of the contaminant. The most important parameters deter-
mining the mobility of LNAPL free product are
• Average soil pore size which determines soil capillarity.
• Percent of soil pore space (soil porosity).
Rules of Thumb
1. Less than 1% of the total mass of a gasoline spill will dissolve into water in the vadose and saturated
zones.
2. Since more than 99% of a fuel spill remains as adsorbed or free product, it is impossible to clean
up groundwater fuel contamination simply by “pump-and-treat” without eliminating the source
residual and free product remaining in the soil.
L1354/ch05/Frame Page 129 Tuesday, April 18, 2000 1:49 AM
Copyright © 2000 CRC Press, LLC
•Density and viscosity of the moving liquid contaminant. Density = mass per unit
volume
.
Most petroleum hydrocarbons have a density less than the density of water, which is
1 g/mL.
Viscosity measures resistance of fluid to flow. Gasoline is less viscous than water
and can flow through smaller pores and fissures more easily than water. The heavier
petroleum fractions, such as diesel fuel and fuel oils, are more viscous than water and
flow less easily. Values of density and viscosity for several fuel products are listed in
Table 5.2.
•Capillary attraction for the liquid contaminant to soil particles.
•Soil zone in which free product is present, as in whether the pore space contains air,
water, or contaminant.
•Magnitude of pressure and concentration gradients acting on the liquid free product.
LNAPL solubility in water is variable and depends on the chemical mixture. Literature data
for solubility of pure compounds can be misleading because the solubility of a specific compound
decreases when it is part of a blend, as shown in Table 5.3.
5.5FORMATION OF PETROLEUM CONTAMINATION PLUMES
In the subsurface soil environment, petroleum compounds are present in four phases and four
plumes. The four phases are
1.Liquid petroleum free product
2.Petroleum compounds adsorbed to soil particles
TABLE 5.2
Densities and Viscosities of Selected Fluids
Fluid
Density (g/mL) Viscosity (centipoise)
0
°
C15
°
C25
°
C0
°
C15
°
C25
°C
Water 1.000 0.998 0.996 1.8 1.14 0.9
Automobile gasoline 0.76 0.73 0.68 0.8 0.62 —
Automotive diesel fuel 0.84 0.83 — 3.9 2.7 —
Kerosene 0.84 0.84 0.83 3.4 2.3 2.2
No. 5 jet fuel 0.84 — — — — —
No. 2 fuel oil 0.87 0.87 0.84 7.7 — 4.0
No. 4 fuel oil 0.91 0.90 0.90 — 47 23
No. 5 fuel oil 0.93 0.92 0.92 — 215 122
No. 6 fuel oil or Bunker C 0.99 0.97 0.96 7.4 × 10
7
— 3200
Rule of Thumb
The aqueous solubility of a particular compound in a multi-component NAPL can be approximated by
multiplying the mole fraction of the compound in the NAPL mixture by the aqueous solubility of the pure
compound.
Solubility of component i in a NAPL mixture = S
i
= X
i
S
0
i
(5.1)
where: S
i
= solubility of component i in the mixture
X
i
= mole fraction of component i in the mixture
S
0
i
= solubility of pure component i
L1354/ch05/Frame Page 130 Tuesday, April 18, 2000 1:49 AM
Copyright © 2000 CRC Press, LLC
3. Dissolved petroleum components
4. Vaporized petroleum components
Each phase behaves differently and poses different remediation problems. The liquid free product
originates directly from the contamination source and initially has the same composition. The adsorbed,
dissolved, and vapor phases are extracted from the liquid free product as it contacts water, soil, and
air in the soil pore space. Each phase moves independently in its own distinct contaminant plume.
In general, the vapor contaminant plume moves the most rapidly. The dissolved plume moves more
slowly at groundwater velocity or less, depending on its retardation factor. The free product plume
moves slower than the dissolved plume. The adsorbed plume may be immobilized, or in the saturated
zone part of it can be sorbed to mobile colloids and move at approximately the groundwater velocity.
Example 5.1: Comparing Dissolved and LNAPL Free Product Masses
A leaking underground storage tank (UST) released 1000 gallons of gasoline (density about
0.7 g/mL) to the subsurface. After 1 year the resulting dissolved-phase plume is about 1000 ft long,
100 ft wide, and 10 ft deep. The average concentration of hydrocarbons in the plume is 0.002 mg/L
(estimated by measuring and adding the total volatile hydrocarbon [TVH] and total extractable
hydrocarbon [TEH] concentrations). The porosity of the aquifer is 0.30. If no hydrocarbon is lost
due to volatilization or biodegradation, how much of the original release is in the dissolved phase
and how much is in the LNAPL phase?
Answer:
Total mass released = (1000 gal)(3.78 L/gal)(1000 mL/L)(0.7 g/mL)(1 kg/1000 mg) = 2646 kg.
TABLE 5.3
Solubility Variability of Gasoline Components from Different Mixtures
Concentration Dissolved in Water (mg/L)
Compound Regular
Leaded
Regular
Unleaded
Super
Unleaded
Pure
Compound
Benzene 30.5 28.1 67.0 1740–1860
Toluene 31.4 31.1 107.0 500–627
Ethylbenzene 4.0 2.4 7.4 131–208
1,2-dichloroethane 1.3 — — 8524
Methyl-t-butyl ether (MTBE) 43.7 35.1 966.0 48,000
t-butyl alcohol 22.3 15.9 933.0 miscible
m-xylene 13.9 10.9 11.5 134–196
o-, p-xylene 6.1 4.8 5.7 157–213
1,2-dibromoethane 0.58 — — 4300
Rules of Thumb
1. With respect to the total mass of fuel contaminant in the subsurface soil environment, the floating
free product and immobilized oil (trapped by capillary forces and adsorbed to soil particles) are
generally more than 99% of the total mass.
2. When free product is present, the dissolved phase in the groundwater is generally less than 1% of
the total mass. The dissolved plume is just the tip of the contamination iceberg.
L1354/ch05/Frame Page 131 Tuesday, April 18, 2000 1:49 AM
Copyright © 2000 CRC Press, LLC
Volume of contaminated groundwater = (1000 ft)(100 ft)(10 ft)(0.30)(28.3 L/ft
3
) = 8.49 × 10
6
L.
Mass of dissolved hydrocarbons = (8.49 × 10
6
L)(0.002 mg/L)(1 kg/1000 mg) = 17.0 kg.
Mass of LNAPL free product = 2646 – 17.0 = 2629 kg.
Percent of total mass that is dissolved = (17 kg/2646 kg) × 100 = 0.64%.
Percent of total mass that is LNAPL = (2629/2646) × 100 = 99.36%.
DISSOLVED CONTAMINANT PLUME
Water solubility is the most important chemical property for assessing the impact of a contaminant
on the environment. Dissolved contaminants arise when the free product comes in contact with
water. The water may be in the form of moisture retained in the soil, precipitation percolating
downward through the soil, groundwater flowing through contaminated soil or groundwater lying
under a layer of free product. Both crude and refined petroleum products contain hundreds of
different components with different water solubilities, ranging from slightly soluble to insoluble.
The composition of the free product and dissolved fractions is very different, as indicated in
Figure 5.5, because the more soluble compounds become concentrated in the water-soluble fraction.
Dissolved contaminants become a part of the water system and move with the groundwater but
they usually move at a lower velocity because of their retardation by sorption processes. Sorption
to soil and desorption back into the dissolved phase is a continual process that retards the movement
of the dissolved phase. The amount of retardation depends mainly on the organic content of the
soil. Retardation is greater in soils with more organic matter. Because their water solubilities are
low, dissolved fuel contaminants continue to partition between the dissolved phase and soil particle
surfaces, especially in soils with a high organic content.
VAPOR CONTAMINANT PLUME
Vapor phase contaminants arise from the volatile components of the free product escaping into
adjacent air. Lower mass hydrocarbon components commonly associated with the gasoline fraction
Rules of Thumb
1. In general, the lightweight aromatics such as the BTEX group (benzene, toluene, ethylbenzene, and
xylene) are the most soluble components of fuel mixtures. If MTBE additive is present, it is the most
soluble component by far.
2. The overall water solubility of commercial gasoline without additives ranges between 50 mg/L and
150 mg/L, depending on its exact composition. When free product gasoline is present, the dissolved
portion generally accounts for less than 1% of the total contaminant mass present in the subsurface.
3. The overall solubility of fresh No. 2 diesel fuel in water is around 0.4–8.0 mg/L, again depending
on its composition. When free product diesel fuel is present, the dissolved portion generally accounts
for less than 0.1% of the total contaminant mass present in the subsurface.
4. Nevertheless, dissolved contaminants can greatly exceed concentration levels where water is regarded
as seriously polluted.
Rule of Thumb
Typical retardation factors for BTEX in sandy soil range from 2.4 for dissolved benzene (groundwater
moves 2.4 times faster than benzene) to 6.2 for dissolved xylene.
L1354/ch05/Frame Page 132 Tuesday, April 18, 2000 1:49 AM
Copyright © 2000 CRC Press, LLC
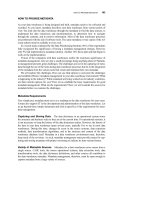
FIGURE 5.5 GC/FID chromatograms of gasoline, diesel, and JP5 fuels and their respective water-soluble fractions. Time of elution,
which corresponds roughly to the number of carbons in the eluted compound, increases from left to right. Thus, peaks corresponding
to heavier compounds appear farther to the right in each figure. The composition of free product and dissolved fractions are very
different in each case because the more soluble compounds become concentrated in the water-soluble fraction. The water-soluble
fractions are composed mainly of 1-, 2-, and 3-ring aromatic hydrocarbons. Using calibration standards for the water-soluble fractions
improves the accuracy of identifying water sample contaminants.
L1354/ch05/Frame Page 133 Tuesday, April 18, 2000 1:49 AM
Copyright © 2000 CRC Press, LLC
are the most volatile. Vapor movement is not influenced by groundwater motion and only weakly
by gravity. It follows the most conductive pathways through the subsurface, from regions of higher
to lower pressure. Much of the vapor remains trapped in soil near its origin, slowly escaping to
the surface atmosphere. A small portion of vapor phase contaminants may dissolve into soil-water,
but it is generally insignificant.
5.6ESTIMATING THE AMOUNT OF FREE PRODUCT IN
THE SUBSURFACE
The first steps in the remediation of a site where an LNAPL spill has occurred is to try to limit the
movement of contaminant plumes and to remove from the subsurface as much free product as
possible. As long as free product is present, it continues to partition into the sorbed, dissolved, and
vapor contaminant plumes, continually feeding their growth. Only after the mobile free product has
been removed from above the water table can remediation of the contaminant plumes be effective.
LNAPL free product in the subsurface is generally detected and measured by its accumulation
in wells. To design a program for removing free product, one must obtain a reliable estimate of
the volume of free product that must be removed. However, the relationship between the thickness
of free product that accumulates in a well and the thickness of free product distributed above the
water table is easily misinterpreted. This relationship is influenced by soil texture, fluctuations of
the water table level, and the thickness of the free product layer.
Figure 5.6 illustrates some of the factors that affect free product accumulation in a well. In the
subsurface away from a well, liquids are influenced by capillary attractions that draw them into
small pore spaces and interstices. Where no LNAPL free product is present, three forces determine
the aquifer water table elevation:
1. Gravity pulls water downward.
2. Water pressure in the aquifer acts upward against gravity.
3. Capillary forces at the interface between the saturated and unsaturated zones also act
upward against gravity.
Within a well, there are no upward acting capillary forces affecting the liquid levels. Only the
balance between gravity and water pressure in the aquifer determines the water level in a well.
Rules of Thumb
1. A measurable vapor concentration will be produced if either
Henry’s constant (K
H
= C
a
/C
w
) > 0.0005 atm m
3
mol
–1
(this produces significant partitioning from water to air),
or
Vapor pressure > 1.0 torr at 20°C
(this results in significant diffusion upward through the vadose zone).
2. Characteristic vapor pressures for gasoline:
Fresh gasoline: 260 torr (0.34 atm).
Weathered gasoline (2–5 years old): 15 to 40 torr (0.02 to 0.05 atm).
L1354/ch05/Frame Page 134 Tuesday, April 18, 2000 1:49 AM
Copyright © 2000 CRC Press, LLC
If LNAPL is present, it also develops a capillary fringe at its interface with the unsaturated
zone. Capillary fringes occur at the upper boundaries of both the water table and the free product
layer. In the capillary fringes, liquids are drawn upward against gravity and are largely immobile,
especially in horizontal directions. The thickness of the capillary fringes depends on the soil texture.
In coarse soils and sands with few capillary-size pore spaces and interstices, capillary fringe layers
may be only a few millimeters thick; in fine soils and sands, they may be several meters thick.
Where LNAPL free product floats in contact with the water table, the water level is lowered
by the weight of LNAPL (see Figure 5.7). Where the LNAPL free product layer is thin, it lies
largely above the water capillary fringe because LNAPL cannot easily displace water from this
region. Where the LNAPL layer is thick, its greater weight makes it penetrate farther into, or even
through, the water capillary fringe, moving the free product-water interface even lower.
When an appropriately screened well passes through an LNAPL free product layer into the
saturated zone, water and free product flow into the well from the surrounding subsurface. Liquid
movement into the well occurs from the water and free product regions below their respective
capillary fringes, where liquid mobility exists. LNAPL from the mobile zone around the well flows
into the wells, and the additional weight of LNAPL lowers the water level in the well to below the
normal water table in the aquifer. LNAPL flows into the well until the top level of LNAPL in the
well is the same as the top of the mobile zone in the surrounding soil.
Within a well, where no capillary forces exist, the weight of LNAPL lowers the LNAPL-water
interface farther than in the surrounding subsurface. LNAPL will continue to flow into the well,
lowering the water table, until the upward pressure of aquifer water balances the weight of LNAPL.
The end result is that LNAPL accumulates in a well to a greater thickness than in the surrounding
subsurface, where capillary forces buoy up both the water level and free product layer. The upper
level of LNAPL in the well is lower than the upper level in the surrounding subsurface by the
thickness of the LNAPL capillary fringe. The LNAPL-water interface in the well is lower than in
the subsurface by an amount that depends on the soil texture and the thickness of the subsurface
mobile layer of LNAPL. This behavior is illustrated in Figures 5.7 and 5.8.
FIGURE 5.6Thickness of LNAPL accumulated in a well compared to thickness in adjacent subsurface.
L1354/ch05/Frame Page 135 Tuesday, April 18, 2000 1:49 AM
Copyright © 2000 CRC Press, LLC
Equation 5.2 may be used to calculate the water table level in the adjacent subsurface from
well measurements where LNAPL is present. Use of Equation 5.2 is necessary for evaluating and
plotting groundwater elevations when LNAPL is present in the wells.
WTE = WE
well
+ (LNAPL density × LNAPL thickness in well) (5.2)
where: WTE = water table elevation in subsurface adjacent to the well.
WE
well
= water elevation at the water/LNAPL interface in the well.
FIGURE 5.7 Comparison of LNAPL thickness in wells with thickness in adjacent subsurface.
FIGURE 5.8 Effect of soil texture on LNAPL thickness in a well.
L1354/ch05/Frame Page 136 Tuesday, April 18, 2000 1:49 AM
Copyright © 2000 CRC Press, LLC
EFFECT OF LNAPL SUBSURFACE LAYER THICKNESS ON WELL THICKNESS
Referring to Figure 5.7, in the subsurface near wells MW-2 and MW-3, the weight of LNAPL free
product is not sufficient to force water downward through the capillary fringe. Near well MW-1,
where the LNAPL is thicker because it has formed a dome, the weight of LNAPL is great enough
to force water downward through the capillary fringe and below the original water table. Within
the wells, there are no capillary forces acting upward on the water. In wells MW-2 and MW-3, the
LNAPL thickness in the wells is greater than the LNAPL thickness in the surrounding soils because
the absence of capillary forces in the wells reduces the net upward forces acting on the water, and
the water level is lower. In well MW-1, where LNAPL has pressed down through the capillary
fringe, upward forces on the water are due only to aquifer pressure and are the same in the well
and in the surrounding soil. Thus, the LNAPL thickness and the water level in well MW-1 are the
same as in the surrounding subsurface.
EFFECT OF SOIL TEXTURE
Soil texture determines the magnitude of the capillary forces that exert upward forces on subsurface
water and LNAPL. Capillary forces are much larger in fine-grained soil than in coarse-grained soil.
Consequently, the difference between LNAPL thickness in a well and LNAPL thickness in the
adjacent subsurface is greater in fine-grained soil. The effect of soil texture is illustrated in Figure 5.8.
Details for calculating the recoverable volume of LNAPL free product in the subsurface from
well measurements have been published.
6,7,8
Computer programs are also available for this as well
as other related calculations.
EFFECT OF WATER TABLE FLUCTUATIONS ON LNAPL IN SUBSURFACE AND WELLS
Water table fluctuations promote vertical spreading of LNAPL in the subsurface and influence the
thickness of LNAPL that collects in monitoring wells.
When the groundwater table rises
• Some floating LNAPL free product is driven up into the unsaturated zone. Sorbed residual
LNAPLs in the formerly unsaturated zone can be remobilized by dissolving into the free
product, causing further lateral spreading.
• Some free product remains trapped in pore spaces below the water table within the
saturated zone.
• The mobile free product layer above the water table becomes thinner.
Rules of Thumb
1. Measured LNAPL thickness in a well typically exceeds the corresponding LNAPL thickness in the
surrounding subsurface by a factor of 2 to 10, because LNAPL above the water table flows into the
well and depresses the well water level.
2. The LNAPL thickness ratio, h
well
/h
s
, generally increases with decreasing soil particle size, increasing
capillary fringe thickness, and increasing LNAPL density.
3. A crude estimate, ignoring the soil properties, of LNAPL thickness in the adjacent subsurface can
be made from
h
well
/h
s
≈ (LNAPL density)/(water density – LNAPL density). (5.3)
4. Since fuel LNAPL (gasoline and diesel) generally has a density of 0.7–0.8 g/cm
3
, Equation 5.3 gives
h
well
/h
s
≈ 0.7/0.3 to 0.8/0.2, or 2.3 to 4.0.
L1354/ch05/Frame Page 137 Tuesday, April 18, 2000 1:49 AM
Copyright © 2000 CRC Press, LLC
When the groundwater table falls
• LNAPL free product floating on the water table moves downward as the water table
drops, leaving behind an immobilized fraction of free product as sorbed residual LNAPL
that is retained in the newly unsaturated zone above the lowered water table.
• The mobile free product layer above the water table may become thicker because free
product formerly trapped below the water table is free to migrate downward to the new
water table.
FIGURE 5.9 Spreading of LNAPL into a “smear zone” because of water table fluctuations.
L1354/ch05/Frame Page 138 Tuesday, April 18, 2000 1:49 AM
Copyright © 2000 CRC Press, LLC
The rising and falling of the water table leaves behind a “smear zone” of contamination that
lies partially in the saturated zone and partially in the unsaturated zone. This behavior is illustrated
in Figure 5.9.
EFFECT OF WATER TABLE FLUCTUATIONS ON WELL MEASUREMENTS
LNAPL spills are often first detected by the appearance of a free product layer above the water in
downgradient wells. If the well free product layer diminishes during a remediation program, it is
tempting to believe that the cleanup effort is working successfully. An increase in the well free
product thickness often initiates a search for new LNAPL sources. However, unless fluctuations in
groundwater depth are taken into account, basing such conclusions on changes in the free product
layer thickness in wells can lead to serious errors.
When groundwater rises, the thickness of the free product layer in wells generally decreases
because a portion of the free product becomes trapped below the water table and becomes immobile,
thinning the mobile free product layer. When the water table falls, free product formerly trapped
in the saturated zone becomes mobile again and can accumulate as a free product layer over the
water table where it is free to flow into wells. This behavior is illustrated in Figure 5.10.
5.7ESTIMATING THE AMOUNT OF RESIDUAL LNAPL
IMMOBILIZED IN THE SUBSURFACE
Residual LNAPL in the subsurface is the portion that will not flow into a well. It is the part of an
LNAPL spill that cannot be removed by pumping to the surface. Residual LNAPL must be
remediated by biodegradation, soil flushing, or excavation. Residual LNAPL is retained in the
unsaturated zone by adsorption and capillary forces. Therefore, small soil particles and large surface
area both increase the amount of residual LNAPL retained. The soil retention factor (volume of
LNAPL per volume of soil) depends mainly on the soil pore size distribution, soil wettability,
LNAPL viscosity, and LNAPL density.
Usually more LNAPL is immobilized in the saturated zone than in the unsaturated zone because
part of the residual LNAPL in the unsaturated zone eventually drains down to the water table. In
the saturated zone, water is the wetting fluid and LNAPL the nonwetting fluid. LNAPL becomes
trapped in larger pores of the saturated zone by immobile water.
In the unsaturated zone, LNAPL is the wetting fluid and tends to spread into smaller pores and
drain from the larger pores. Figure 5.11 shows soil retention factors for several kinds of LNAPL
FIGURE 5.10Effect of fluctuating water table on LNAPL accumulation in a well.
L1354/ch05/Frame Page 139 Tuesday, April 18, 2000 1:49 AM
Copyright © 2000 CRC Press, LLC
in soils of different textures. The retention of LNAPL in soils above the water table usually ranges
between about 80 L per cubic meter of soil, for fuel oil in silt, to 2.5 L per cubic meter, for gasoline
in coarse gravel. LNAPL in the unsaturated zone can often be remediated without excavation by
some combination of soil washing, volatilization, or bioremediation.
Example 5.2: Using Soil Retention Factors
One thousand gallons of fuel oil were spilled on a soil consisting mostly of medium to coarse sand.
How much soil is required to immobilize 1000 gallons? If the spill area was confined by a berm
to 100 ft
2
, how deep into the soil will the oil penetrate? Could it endanger a shallow aquifer 35 ft
below the surface?
Answer: From Figure 5.11, the soil retention factor is about 30 L/m
3
for fuel oil. The volume of
soil needed to contain the entire spill is
Assume the oil plume travels downward without spreading, so that its cross-section is 100 ft
2
.
Then a volume of 4454 ft
3
will extend downward by
Depth of oil penetration until it all is retained and immobilized = = 44.5 ft.
Oil is likely to reach the aquifer at 35 ft.
FIGURE 5.11 Soil retention factors for LNAPL fuels in different soils, plotted from data in Reference 9.
Calculations assume a soil bulk density of 1.85 g/cm
3
and LNAPL densities of 0.7, 0.8, and 0.9 g/cm
3
for
gasolines, diesel fuel, and fuel oils, respectively.
V
soil
3
3
3
3
gal
30 L/m
85 L
1 gal
ft
m
ft=
=
1000 3 7 35 3
1
4454
.
4454
100
ft
ft
3
2
L1354/ch05/Frame Page 140 Tuesday, April 18, 2000 1:49 AM
Copyright © 2000 CRC Press, LLC
SUBSURFACE PARTITIONING LOCI OF LNAPL FUELS
As part of an ongoing effort to provide an authoritative, defensible engineering basis for predicting
contaminant behavior in soils, the EPA has identified 13 soil loci among which petroleum contam-
inants become partitioned.
10
Contaminants may move within a given locus under the influence of
pressure and concentration gradients or from one locus to another (for example, when soluble
components in the free product layer dissolve into the groundwater).
In Table 5.4, the partitioning behavior of gasoline in sandy soils has been calculated, using the
methods and data recommended by EPA.
10
The table shows how much gasoline LNAPL is expected
to be retained in the 13 different partitioning loci.
It is clear from Table 5.4 that when free product is present in locus 7 (gasoline LNAPL floating
on top of the groundwater table), this condition is the controlling factor for the distribution of
contaminants in other zones. With free product present above the water table, loci 2, 5, 6, and 7
are by far the most important in terms of mass and account for 99.9% of the total soil and
groundwater contamination.
TABLE 5.4
Relative Importance of Different Subsurface Loci in Sandy Soils for Retention of Gasoline
Contamination
Loci of Subsurface LNAPL Retention
Average
Gasoline Retention
in Sandy Soils
(mg/cm
3
)
Percent of
Total Retention
in Sandy Soils
1. Gasoline vapors in soil pores in the unsaturated zone. 0.095 <0.1%
2. Liquid gasoline sorbed to dry soil particles in the unsaturated zone. Locus
2 is especially important in the soil volume immediately below a spill,
but not downgradient of the spill.
36 9.88
3. Gasoline dissolved in water on wet soil particles in the unsaturated zone. 0.0010 <0.1%
4. Liquid gasoline sorbed to wet soil particles in the saturated and
unsaturated zones.
0.076 <0.1%
5. Liquid gasoline in soil pore spaces within the saturated zone. Locus 5
contaminants may generally be regarded as immobile.
38 10.4
6. Liquid gasoline in soil pore spaces in the unsaturated zone. Contaminants
enter locus 6 mainly from free product floating on the groundwater
table when the table rises and then falls.
110 30.2
7. LNAPL gasoline free product floating on top of the groundwater table.
The most important loss mechanism from locus 7 occurs when a
fluctuating water table moves contaminant into loci 5 and 6, where
some of it remains trapped.
180 49.4
8. Gasoline dissolved in groundwater. 0.020 <0.1%
9. Gasoline sorbed to colloidal particles in water in the saturated and
unsaturated zones.
0.00013 <0.1%
10. Liquid gasoline diffused into mineral grains in the saturated and
unsaturated zones.
0.000060 <0.1%
11. Gasoline sorbed onto or into microbiota in the saturated and unsaturated
zones.
0.010 <0.1%
12. Gasoline dissolved into the mobile pore water of the unsaturated zone. 0.030 <0.1%
13. Liquid gasoline in rock fractures in the saturated and unsaturated zones. 0.21 0.17
Source: Calculated using data from Reference 10.
L1354/ch05/Frame Page 141 Tuesday, April 18, 2000 1:49 AM
Copyright © 2000 CRC Press, LLC
The mass of gasoline in the vapor and dissolved states (loci 1, 3, 8, and 12) is insignificant
compared to that in the free product above the water table and in the smear zone created by a rising
and falling water table (loci 2, 5, 6, and 7). Of course for remediation purposes, all loci are important
and those with relatively small amounts of contaminant may be the most difficult to remediate to
a regulated level.
Example 5.3: Calculation of Contaminant Plume Volume Required to Immobilize 1 Million
Gallons of Gasoline
For a point source of contamination, we can assume that only loci 5 and 6, the smear zone caused
by a fluctuating water table, are effective for immobilizing contaminant. Locus 2 lies primarily
under the area of the initial spill or leak and probably is small compared to the total free product
plume volume. LNAPL in locus 7 may be regarded as mobile. As LNAPL in locus 7 flows
downgradient and is subjected to vertical movement caused by a fluctuating water table, it contin-
ually loses mass into loci 5 and 6.
Assume an average sandy soil with a hydraulic gradient of 0.009 ft/ft. Using the methods
followed in U.S. EPA,
10
the estimated flow velocity for LNAPL gasoline in locus 7 is about
1.3 ft/day.* This may be compared with a groundwater velocity of about 10 ft/day for the same
conditions. Further assume that the seasonal groundwater table fluctuations average around ± 1.5 ft,
giving a free product smear zone 3 ft in thickness. Taking the smear zone to be of uniform thickness
over the plume volume and assuming that, on average, half of the smear zone is in the saturated
zone and half in the unsaturated zone, we can say loci 5 and 6 are each 1.5 ft thick everywhere
over the free product plume.
Locus 5 retention
Take the density of aged gasoline LNAPL to be 0.74 g/cm
3
, or 2800 g/gal. From Table 5.4, locus
5 retains 38 mg of gasoline per cm
3
of soil, or about 16,500 gal/acre-ft. For a locus 5 thickness of
1.5 ft, 24,750 gallons of gasoline LNAPL will be immobilized per acre of contamination plume
cross-sectional area.
Locus 6 retention
Similarly, retention in locus 6 will be about 73,000 gal/acre. The total amount of fuel retained in
loci 5 and 6 is
(24,750 + 73,000) gal/acre = 97,750 gal/acre, or close to 100,000 gal/acre.
For a 1-million-gallon gasoline spill in sandy soil, where the water table fluctuates ± 1.5 ft
annually, the soil contaminant plume could become immobilized after it had spread into 30 acre-
ft, or a horizontal cross-section of about 10 acres.
5.8 DNAPL FREE PRODUCT PLUME
Dense nonaqueous phase liquids, DNAPL, are nonaqueous phase liquids that are denser than water.
If sufficient DNAPL is present, the free product sinks downward through the water table to the
bottom of an aquifer. Only an impermeable obstruction, such as bedrock, stops the downward
movement of DNAPL mobile free product. Some examples of DNAPL are
• Halogenated solvents (mostly chlorinated or brominated), either pure compounds or
mixtures of solvents
• Wood preservatives
* Because of its greater viscosity, diesel fuel would move about one-third as fast.
L1354/ch05/Frame Page 142 Tuesday, April 18, 2000 1:49 AM
Copyright © 2000 CRC Press, LLC
• Coal tars
• Creosote
• Polychlorinated biphenyls (PCBs)
• Many pesticides
Free product from DNAPL spills moves downward through the vadose zone (leaving a trail of
residual soil-sorbed DNAPL) until it reaches the capillary zone of the water table. To continue
moving downward, the DNAPL must displace water held by capillary forces. Consequently, down-
ward movement slows while DNAPL piles up and spreads laterally. If sufficient weight of DNAPL
accumulates, it presses downward through the capillary zone and continues down through the
saturated zone (see Figure 5.12).
Where there is a decrease in soil permeability — whether in the unsaturated or saturated zone
— DNAPL behaves similarly, the downward movement slows, and more lateral spreading occurs.
This leads to the formation of pools and fingers. Eventually, impermeable bedrock is reached where
DNAPL collects in pools. If the bedrock is slanted, DNAPL will migrate down the physical slope,
even if the direction is opposite to the groundwater movement.
Many DNAPL compounds, especially chlorinated hydrocarbons, are less viscous than water.
They can penetrate small fractures and micropores and become inaccessible to in situ remediation.
Chlorinated hydrocarbons interact with some clays, causing them to shrink and crack. Clay-lined
ponds are not reliable containment for liquid wastes containing chlorinated hydrocarbons.
Aerobic biodegradation techniques that work well with many LNAPL hydrocarbons have not
been very successful with chlorinated DNAPL. Although there have been recent reports of suc-
cessful biodegradation procedures involving anaerobic steps and carefully selected microbes, bio-
degradation and weathering are slow and DNAPL may persist for long time periods.
Solubilities are generally low; therefore, DNAPL will continue to dissolve slowly into the
groundwater without significant diminution. Even with a moderate DNAPL release, dissolution can
continue for hundreds of years under natural conditions before all the DNAPL has dissolved or
degraded. Once in the subsurface, it is difficult or impossible to recover all of the trapped residual
DNAPL. DNAPL that remains trapped in the soil/aquifer matrix acts as a continuing source of
groundwater contamination.
FIGURE 5.12 Comparison of DNAPL and LNAPL movement in the subsurface, after spills.
L1354/ch05/Frame Page 143 Tuesday, April 18, 2000 1:49 AM
Copyright © 2000 CRC Press, LLC
TESTING FOR THE PRESENCE OF DNAPL
It is very difficult to locate DNAPL free product with monitoring wells. First of all, DNAPL remains
in the bottom of the well and may go unnoticed. Second, because DNAPL free product generally
collects in pools at the bottom of an aquifer and in locations unrelated to groundwater movement,
there often are no obvious guidelines as to where a well should be placed or how it should be
screened to collect free product.
For these reasons, dissolved concentrations of DNAPL-related chemicals are often the only
evidence that DNAPL free product is present at a site. The EPA has recommended an empirical
approach for determining whether DNAPL free product is near a monitoring well where dissolved
DNAPL-related compounds have been detected.
11
In order to use this approach, it is necessary to
measure concentrations of DNAPL-related compounds dissolved in groundwater, to know the
composition of the suspected DNAPL, and to calculate the effective solubility of the measured
DNAPL components.
The effective solubility is the theoretical solubility in water of a single component of a DNAPL
mixture. It may be approximated by multiplying the component’s mole fraction* in the mixture by
its pure phase solubility.
S
eff
(a) = X
a
S
pure
(a), (5.4)
where: S
eff
(a) = effective solubility of component a in a DNAPL mixture, in mg/L.
X
a
= mole fraction of compound a in the mixture.
S
pure
(a) = pure-phase solubility of compound a, in mg/L.
Conditions That Indicate the Presence of DNAPL
If any of the following conditions exist, there is a high probability that DNAPL free product is in
the vicinity of the sampling location.
• Groundwater concentrations of DNAPL-related chemicals are >1% of either their pure
phase solubility (S
pure
) or their effective solubility (S
eff
).
• Soil concentrations of DNAPL-related chemicals are >10,000 mg/kg (1% of soil mass).
• Groundwater concentrations of DNAPL-related chemicals increase with depth or appear
in anomalous upgradient/cross-gradient locations with respect to groundwater flow.
• Groundwater concentrations of DNAPL-related chemicals calculated from water/soil
partitioning relationships are greater than pure phase solubility or effective solubility.
* The mole fraction of compound a in a mixture of several compounds is written X
a
.
.
For a mixture with 1 mole of CCl
4
and 3 moles of CHCl
3
, X
CCl4
= 1/4 = 0.25 and X
CHCl3
= 3/4 = 0.75. Note that the
sum of all mole fractions must equal unity. The mole fraction of any pure substance equals unity.
Rules of Thumb for DNAPL
1. Chlorinated hydrocarbons are generally more dense than water (DNAPL). They sink to the bottom
of the water table.
2. DNAPL movement is affected by gravity far more than by groundwater movement. It moves with
the slope of the bedrock below the aquifer, independent of the direction of groundwater movement,
and forms pools in bedrock depressions.
X
a
=
moles of
total moles of all compounds
a
L1354/ch05/Frame Page 144 Tuesday, April 18, 2000 1:49 AM
Copyright © 2000 CRC Press, LLC
Calculation Method for Assessing Residual DNAPL
1.Calculate S
eff
(a) as above.
2.Find K
oc
, the organic carbon-water partition coefficient in Table 4.6, from published
literature, or estimate it from log K
oc
= log K
ow
– 0.21.
3. Determine f
oc
, the fraction of organic carbon (oc) in the soil by lab analysis. Values for
f
oc
typically range from 0.03 to 0.00017 (mg oc)/(mg soil). Convert values reported in
percent (mg oc/100 mg soil) to (mg oc)/(mg soil).
4. Determine or estimate the dry bulk density of the soil (d
b
). Typical values range from
1.8 to 2.1 g/cm
3
(kg/L). Determine or estimate the water-filled porosity (p
w
) of the soil.
5. Determine K
d
, the soil-water partition coefficient from K
d
= K
oc
× f
oc
, as in Equation 4.16.
6. Using C
soil
(a), the measured concentration, in mg/kg, of DNAPL-related compound a in
saturated soil, calculate the theoretical concentration of a in pore water, C
w
(a) from
C
w
(a) = {C
soil
(a) × d
b
}/{(K
d
× d
b
) + p
w
}.
7. Compare C
w
(a) with S
eff
(a) from Step 1:
• If C
w
(a) > S
eff
(a) there is a possible presence of DNAPL near the sampling location.
• If C
w
(a) < S
eff
(a) there is a possible absence of DNAPL near the sampling location.
5.9 CHEMICAL FINGERPRINTING
Environmental professionals often need to do more than locate and clean up pollutants. They may
need to help identify the sources of the contamination. Someone always has to pay for a remediation
effort. The high costs that are often involved mean that any prudent potentially responsible party
(PRP) will want convincing proof that he or she must accept responsibility for the pollution. Polluted
sites often have a history of having different owners and uses, any or all of which may have
contributed to the present site contamination. Off-site sources may also be responsible for all or
part of the current pollution problems. Allocating responsibility for the expenses involved in
remediation often becomes a legal issue. The methods used in building a legally defensible case
that assigns responsibility for soil and groundwater pollutants have become part of a branch of
environmental investigations known as environmental forensics.
One of the most common applications of environmental forensics is identifying the sources of
fuel contamination. The use of petroleum fuels has been increasing for the past 100 years and fuel
contaminants are pervasive wherever they have been used. There are many potential sources of fuel
pollutants, from numerous small gasoline stations to large refinery operations, roadway accidents
to criminal acts of disposal, pipeline breaks to tank corrosion. It is no wonder that the origin of
any particular site contamination may often be legitimately questioned. Chemical fingerprinting of
fuels is one tool in the toolbox of chemical forensics.
In chemical fingerprinting, the chemical characteristics of fuel contaminants are used to help
distinguish among different possible sources of the pollutants. For example, knowing that only
gasoline was ever used on a certain site, but that the groundwater hydrocarbon contaminants found
there are from diesel fuel, clearly points to an off-site source.
FIRST STEPS IN CHEMICAL FINGERPRINTING OF FUEL HYDROCARBONS
Successful chemical fingerprinting of hydrocarbon contamination frequently consists of the sequen-
tial application of several investigative steps:
• Identify the fuel type of the contaminants. Are they gasoline, diesel fuel, or fuel oils?
Each of these classes has unique chemical characteristics.
L1354/ch05/Frame Page 145 Tuesday, April 18, 2000 1:49 AM
Copyright © 2000 CRC Press, LLC