GIS Applications for Water, Wastewater, and Stormwater Systems - Chapter 3 docx
Bạn đang xem bản rút gọn của tài liệu. Xem và tải ngay bản đầy đủ của tài liệu tại đây (3.69 MB, 27 trang )
CHAPTER
3
Remote Sensing Applications
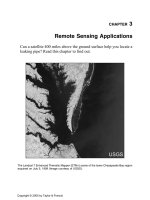
Can a satellite 400 miles above the ground surface help you locate a
leaking pipe? Read this chapter to find out.
The Landsat 7 Enhanced Thematic Mapper (ETM+) scene of the lower Chesapeake Bay region
acquired on July 5, 1999 (Image courtesy of USGS).
2097_C003.fm Page 47 Monday, December 6, 2004 5:59 PM
Copyright © 2005 by Taylor & Francis
LEARNING OBJECTIVE
The learning objective of this chapter is to comprehend the applications of remote
sensing technology in the water industry.
MAJOR TOPICS
• Remote sensing satellites
• Applications of satellite imagery
• Types of remote sensing data
• Digital orthophotos
• Using remote sensing for land-use classification
• Image processing software
• Anticipated future trends
LIST OF CHAPTER ACRONYMS
DEM
Digital Elevation Model
DOP
Digital Orthophoto
DOQ
Digital Orthophoto Quadrangle
DOQQ
Digital Orthophoto Quarter Quadrangle
LIDAR
Laser Imaging Detection and Ranging
LULC
Land Use/Land Cover
TM
Thematic Mapper (onboard Landsat satellite)
USGS
United States Geological Survey
ALBANY COUNTY’S REMOTE SENSING APPLICATION
Public-domain digital aerial photography data, such as USGS digital orthophoto
quadrangles (DOQs) and digital orthophoto quarter quadrangles (DOQQs), usually
become outdated in rapidly developing areas. For such areas, high-resolution satellite
imagery may be a cost-effective source of more recent overhead images.
Albany County, located in southeastern Wyoming, covers 4,400 mi
2
, has a stu-
dent-based population of 30,000, and has 1,600 mi of roads. For rural communities
such as Albany County, building a GIS from scratch can be an expensive endeavor
due to lack of resources. The County’s day-to-day mapping functions required a data
layer of imagery for the entire county. Various data options were reviewed, including
aerial flights, existing DOQs, and satellite imagery. New aerial imagery was elimi-
nated because it was too expensive. Existing DOQs were not suitable because they
were 7 years old and did not reflect recent county growth trends. In addition, costs
associated with updating the County’s existing digital aerial photography exceeded
$100,000. High-resolution satellite imagery, on the other hand, allowed the County
to have high-resolution up-to-date views of the entire county for $32,000. For 85
mi
2
of populated areas, the County selected 1-m pan-sharpened IKONOS satellite
imagery (described later in this chapter). For the rest of the county, 90 quads of
2097_C003.fm Page 48 Monday, December 6, 2004 5:59 PM
Copyright © 2005 by Taylor & Francis
CARTERRA DOQ 5-m black and white (B&W) imagery was selected. Both products
were produced by Space Imaging (Thornton, Colorado). Thanks to this geographic-
imaging approach, planning tasks previously requiring months to complete took only
days after the County implemented this project (Frank, 2001).
In
the Albany County of Wyoming, addition of high-resolution up-to-date imagery to
GIS data reduced the completion of typical planning tasks from months to a few days.
INTRODUCTION
The technologies that are commonly used in conjunction with GIS are commonly
referred to as GIS-related technologies. Examples include remote sensing, global
positioning system (GPS) surveying, the Internet, and wireless technologies. This
chapter will focus on remote sensing, one of the most successful GIS-related-
technologies. Other related technologies are described elsewhere in the book.
Remote sensing allows obtaining data of a process from a location far away from
the user. Remote sensing can, therefore, be defined as a data collection method that
does not require direct observation by people. Remote sensing is the process of
detection, identification, and analysis of objects through the use of sensors located
remotely from the object. Three types of remote sensing systems are useful in the
water industry:
1. Aerial photographs
2. Satellite imagery
3. Radar imagery
The data from these systems are commonly referred to as remote sensing or
remotely sensed data. Sometimes, remote sensing data are incorrectly confused with
supervisory control and data acquisition (SCADA) data used to operate water and
wastewater treatment plants. Remote sensing data collected using airplanes are called
aerial photographs or aerial photos. Digital remote sensing data collected from
satellites are called satellite imagery or images. Digital pictures of the Earth are
taken by satellites from 400 to 500 mi above the ground compared with aerial
photographs that are taken by aircraft from 1 mi above the ground (for low-altitude
photography) to 7 to 8 mi above the ground (for high-altitude photography). The
chart in Figure 3.1 shows the altitude difference between the aircraft- and satellite-
type remote sensing systems. Radar imagery or images are another type of remote
sensing data but their usage is not widespread in the water industry. Although the
definition of remote sensing includes aerial photos and radar data, remote sensing
is often considered synonymous with satellite imagery.
The American Society for Photogrammetry and Remote Sensing (ASPRS) values
the U.S. remote sensing industry at about $1.3 billion (as of 2001) and forecasts 13%
annual growth, giving values of $3.4 billion by 2005 and $6 billion by 2010. The
industry currently consists of about 220 core companies employing about 200,000
employees in the areas of remote sensing, photogrammetry, and GIS imaging. A 2001
2097_C003.fm Page 49 Monday, December 6, 2004 5:59 PM
Copyright © 2005 by Taylor & Francis
ASPRS study concludes that utilities are one of the greatest untapped potential
markets and that a shortage of trained workers is one of the greatest challenges to
the growth of the remote sensing industry (Barnes, 2001a).
Although vector GIS data are still an important and vital tool for many water
industry applications, the newer raster GIS applications of satellite imagery are
beginning to make a major move into the GIS and mapping market. The benefits of
satellite imagery are (Schultz, 1988):
1. They enable aerial measurements in place of point measurements.
2. They offer high spatial and/or temporal resolution.
3. All information is collected and stored at one place.
4. Data are available in digital form.
5. Data acquisition does not interfere with data observation.
6. Data can be gathered for remote areas that are otherwise inaccessible.
7. Once the remote sensing networks are installed, data measurement is relatively
inexpensive.
Satellite imagery is stored in a pixel (raster) format that makes it ideally suited
for incorporation into a GIS (Engman, 1993). Thus, satellite imagery can be treated
as raster-type GIS data. Image processing equipment and methods can be used to
Figure 3.1
Altitude difference in aerial photography and satellite imagery.
1 mi
7–8 mi
400–500
mi
Low Altitude High Altitude Satellite
1
10
100
1000
Remote Sensing System Type
Altitude (miles)
2097_C003.fm Page 50 Monday, December 6, 2004 5:59 PM
Copyright © 2005 by Taylor & Francis
extract useful information from hard copy and digital images and combine it with
other data layers in a GIS. Image data sources including scanned paper maps, aerial
photographs, and satellite imagery can be used in a GIS when reprojected as image
maps. Projected images can be used as a background or as a base map upon which
other vector layers are overlaid.
Casual GIS users can easily import remote sensing imagery into their GIS
projects as an image theme (or layer). However, advanced remote sensing applica-
tions and image analyses require formal remote sensing training and digital image
processing skills. The incorporation of remote sensing data in a GIS requires a digital
image processing software such as ERDAS IMAGINE, Geomatica, ER Mapper, or
ENVI, or a raster GIS software with image processing capability, such as ArcGRID
or IDRISI. Such programs are described later in this chapter.
These are exciting times both for the GIS and the remote sensing industries,
thanks to dramatic price and performance breakthroughs in GIS hardware and
software. The increasing use of GIS is contributing to a renewed interest in satellite
imagery by nongeographers, such as civil and environmental engineers. Although
GIS technology is promoting the use of satellite imagery, satellite imagery is also
in turn advancing the use of GIS. Although non-GIS stand-alone image processing
software can be used for exploring satellite imagery, those with GIS capabilities are
more suitable because they can combine imagery with additional information, such
as demographic and topographic data (Corbley, 2000).
REMOTE SENSING APPLICATIONS
Satellite imagery is not restricted to the visible (0.4 to 0.7 µm wavelength) part
of the electromagnetic spectrum. Satellite sensors can record Earth images at wave-
lengths not visible to the human eye, such as near-infrared and thermal-infrared
bands. Different satellite bands provide information about different objects and
conditions of the Earth. For example, thermal-infrared band (10.4 to 12.5 µm wave-
length) data are useful for soil–moisture discrimination. These bands of satellite data
can be used as different data layers in a GIS for further analysis.
Remote sensing applications in the water industry are as diverse and numerous
as the GIS applications themselves. Typical examples are listed below:
1. Satellite remote sensing has contributed to water resources applications and research
for three decades (Jackson, 2000). Remote sensing data are especially useful in
watershed hydrologic modeling. Satellite imagery can be used to estimate input
parameters for both the lumped-parameter and distributed-type hydrologic models.
2. Satellite imagery can be used for delineating watersheds and streams. For example,
SPOT satellite’s stereographic capability can generate topographic data. Terra
satellite can provide digital elevation models (DEMs) from stereo images. (These
and other satellites are discussed later in this chapter.) Topographic and DEM data
collected by satellites can be processed in GIS for automatic delineation of water-
shed boundaries and streams.
3. Remote sensing data are used for land-use classification. GIS can help to refine
or verify the imagery-based land-use classes.
2097_C003.fm Page 51 Monday, December 6, 2004 5:59 PM
Copyright © 2005 by Taylor & Francis
4. Satellite and radar data can be used to estimate the area and intensity of rainfall.
5. Remote sensing can produce surface temperature data through thermal-infrared
images.
6. Microwave remote sensing can produce soil-moisture data.
7. Remotely sensed temperature and moisture data can be combined to estimate
evaporation and evapotranspiration rates.
8. Remote sensing data are used to estimate vegetation indices and the leaf area
index. These parameters can be combined to delineate areas where a subsurface
supply of water is available for vegetation.
9. Remote sensing can be used in real time flood forecasting with a distributed
hydrologic model into which radar rainfall data can be input.
10. Other applications (Singh, 1995; ASCE, 1999) are:
• Utility routing
• Weather forecasting
• Environmental impact assessment of large water resources projects
• Snow and ice conditions (microwave region)
• Forecasting seasonal and short-term snowmelt runoff
• Evaluation of watershed management strategies for conservation planning
• Inventory surface water, such as rivers, lakes, reservoirs, swamps, and flooded
areas
• Water quality parameters such as algae, chlorophyll, and aquatic life
• Thermal and chemical pollution and oil spills
• Drought assessment and forecasting
• Geologic and geomorphologic information
• Groundwater mapping
REMOTE SENSING SATELLITES
Satellite data became available to water industry professionals in 1972 when the
U.S. government launched the first Landsat satellite, which was specifically designed
to provide imagery of the Earth (Miotto, 2000). In the late 1970s and early 1980s,
a second generation of Landsat satellites was developed. Landsats 4 and 5 were
launched in July 1982 and March 1984, respectively. They were equipped with two
instruments:
• Multispectral scanner (MSS) having 80-m resolution and 4 spectral bands
• Thematic mapper (TM) having 30-m resolution and 7 spectral bands
MSS sensors capture imagery at different wavelengths of light to produce color
images. Landsat 4 was retired in 1991, and Landsat 5’s MSS sensor failed in October
1993. The successor satellite, Landsat 6, failed to achieve orbit in 1993. To keep the
imagery flowing, Landsat 7 was launched on April 15, 1999.
Popular satellite-based sensors and platforms include Landsat MSS and TM,
AVHRR, AVIRIS, SPOT XS, GOES, SEASAT, SIR, RADARSAT, SRTM, TOPSAT,
ERS-1 and 2, and JERS-1 (Luce, 2001; Lunetta and Elvidge, 1998). The remote
sensors that provide hydrologically useful data include aerial photographs, scanning
radiometers, spectrometers, and microwave radars. The satellites that provide hydro-
logically useful data are the NOAA series, TIROS N, SPOT, Landsat, and the
2097_C003.fm Page 52 Monday, December 6, 2004 5:59 PM
Copyright © 2005 by Taylor & Francis
geostationary satellites GOES, GMS, and Meteosat. Satellites can capture imagery
in areas where conventional aircraft cannot fly. However, bad weather, especially
cloud cover, can prevent satellites from capturing imagery (Robertson, 2001).
SPATIAL RESOLUTION
The spatial resolution of an image is defined as the size of the smallest feature
that can be discerned on the image. Spatial coverage is defined as the area of the
Earth’s surface captured by the image. In general, the higher the spatial resolution,
the smaller is the spatial coverage. For example, NASA’s Terra Satellite MODIS
sensor has 36 spectral channels at 250 m, 500 m, and 1 km. A standard MODIS
image covers 1200 km
×
1200 km, whereas a standard IKONOS satellite image covers
11 km
×
11 km. At such a large spatial coverage, MODIS spatial resolution is more
than 50 times coarser than the IKONOS imagery (Space Imaging, 2001). In 2001,
the approximate number of 30-m (or better) resolution satellites in the world was 30,
and the number of 10-m (or better) resolution satellites was 14 (Limp, 2001).
Figure 3.2 provides a comparison of image resolution. It shows five images at
various resolutions for the same geographic area (Gish, 2001). The top-left image,
with the highest resolution, is a 0.15-m (0.5-ft) B&W orthophoto taken in 1993. The
top-right image is a 0.6-m (2-ft) 1998 B&W orthophoto. The center-left image is a
1-m (3.28-ft) 1999 color-infrared orthophoto taken in invisible light in the infrared
bands. The center-right image is a simulated B&W SPOT image with a 10-m
(32.8-ft) resolution. Finally, the bottom image has the lowest resolution of 30 m
(98.4 ft) and consists of Landsat 7 TM color imagery taken in 2000.
In remote sensing, B&W or gray-scale imagery is called
panchromatic
and color
imagery is called
multispectral
. Panchromatic satellite-imagery resolution varies
from 15 m (49 ft) for the Landsat 7 satellite, 10 m (33 ft) for the French SPOT
satellite series, 5 m (16 ft) for the Indian Remote Sensing series, 1 m (3.2 ft) for
the IKONOS satellite (Gilbrook, 1999), to 60 cm (2 ft) for the QuickBird-22 satellite.
Until recently, satellite images tended to have very low resolutions. In January 2000,
IKONOS high-resolution satellite imagery became available in the commercial mar-
ketplace for the first time.
Based on their spatial resolution, remote sensing data can be divided into three
categories:
1. Low-resolution data corresponding to imagery with a resolution greater than 30 m
2. Medium-resolution data corresponding to imagery with a resolution between 5
and 30 m
3. High-resolution data corresponding to imagery with a resolution less than 5 m
Low-Resolution Satellite Data
The United States Earth Observing System (EOS) satellites are an excellent
source of low- and medium-resolution satellite data. There are four EOS satellites
currently in orbit: Landsat 7, QuickSAT, ACRIMSAT, and Terra. Terra, launched
by NASA in December 1999, has three remote sensing instruments that could be
2097_C003.fm Page 53 Monday, December 6, 2004 5:59 PM
Copyright © 2005 by Taylor & Francis
useful for certain water resources applications: Advanced Spaceborne Thermal
Emission and Reflection Radiometer (ASTER), Moderate Resolution Imaging Spec-
troradiometer (MODIS), and Multiangle Imaging Spectroradiometer (MISR). ASTER
provides digital elevation maps prepared from stereo images. MODIS provides data
on cloud- and snow-cover characteristics. MISR data can distinguish different types
of clouds, land cover, and vegetation canopy. Although low-resolution satellite imagery
works well for regional level studies, it is not very useful in water industry applications.
Medium-Resolution Satellite Data
Table 3.1 provides a summary of medium-resolution satellites. Landsat 7 is the
most recent satellite in the Landsat series. By May 2001, Landsat 7 had captured
more than 200,000 15-m scenes throughout the world. The Enhanced Thematic
Figure 3.2
Image resolution comparison. Top left: 0.15-m B&W orthophoto (1993); top right:
0.6-m B&W orthophoto (1998); center left: 1-m color infrared orthophoto (1999);
center right: 10-m simulated SPOT; bottom: 30-m Landsat TM (2000).
2097_C003.fm Page 54 Monday, December 6, 2004 5:59 PM
Copyright © 2005 by Taylor & Francis
Mapper Plus (ETM+) sensor onboard Landsat 7 provides 15-m panchromatic and
30-m multispectral resolutions. Landsat 7 offers imagery of the highest resolution
and lowest price of any Landsat. The USGS ground-receiving station in Sioux Falls,
South Dakota, records 250 Landsat scenes a day that are available online within 24
hours. Landsat 7 is expected to have a design life of 5 years. Each Landsat image
covers about 10,000 mi
2
. Landsat 7 is very useful in water resources applications.
Figure 3.3 shows a modified Landsat TM image for southwestern Pennsylvania,
which can be used in a GIS to consistently map land use/land cover (LULC)
throughout the state. These images, called Terrabyte, are extracted from the 30-m
resolution TM data using an extractive process based on a research trust at Penn
State University under cooperation between the Office for Remote Sensing of Earth
Resources in the Environmental Resources Research Institute and the Center for
Table 3.1
List of Major Medium-Resolution Satellites
Feature Landsat 7 SPOT 4 IRS-1C
Company USGS French Government Indian Government
Launch date April 15, 1999 1998 December 28, 1995
B&W resolution 15 10 5
Color resolution 30 20 23
Swath width (km) 185 120 70
Global cover repeat days 16 26 24
Figure 3.3
Terrabyte Landsat Thematic Mapper image for southwestern Pennsylvania.
2097_C003.fm Page 55 Monday, December 6, 2004 5:59 PM
Copyright © 2005 by Taylor & Francis
Statistical Ecology and Environmental Statistics in the Department of Statistics, with
sponsorship from the National Science Foundation and the Environmental Protection
Agency. The Terrabyte images are not intended to provide fine detail such as indi-
vidual buildings at the site level, but rather to convey a sense of landscape organi-
zation. Each pixel record occupies one byte; hence the name Terrabyte. Terrabyte
condensations for ten satellite scenes will fit on one CD-ROM, whereas two scenes
of original satellite data would more than fill one CD-ROM. Terrabyte CD-ROMs
of Pennsylvania data have been distributed by Pennsylvania Mapping and Geo-
graphic Information Consortium (PaMAGIC) (www.pamagic.org).
In addition to the EOS satellites, France’s SPOT 4 satellite provides 10-m
panchromatic and 20-m color imagery. In the U.S., 60
×
60 km SPOT scenes cost
$750 (pre-1998) to $1500 (post-1998). India’s Indian Remote Sensing (IRS) satellite
IRS-1C provides 5-m panchromatic and 23-m or 188-m color imagery. Commercial
companies and government agencies around the world had plans to launch more
than 25 medium-resolution (30 m or better) satellites by the end of 2003.
High-Resolution Satellite Data
High-resolution data correspond to imagery whose resolution is less than 5 m.
Traditionally, water industry professionals have purchased aerial photography services
on an as-needed basis, which is costly and time-consuming. Now, thousands of square
miles of GIS-ready seamless imagery is available in various formats with the promise
to bring remote sensing data to any desktop (Robertson, 2001). Until recently, some
water industry professionals used 5-m panchromatic imagery from India’s IRS-1C sat-
ellite or 10-m panchromatic imagery from France’s SPOT 4 satellite for their high-
resolution data needs. The recent launches of IKONOS (1-m) and QuickBird-2 (60-cm)
satellites have changed this by starting to provide high-resolution panchromatic imagery,
which meets the U.S. National Map Accuracy Standards for 1:5000-scale maps. 1-m
imagery represents an accuracy level commensurate with 1:2400 mapping, which is
more than adequate for many planning and H&H modeling applications.
GIS applications are poised to bring the recently available high-resolution satellite
imagery directly to the dispatch office of a water, wastewater, or stormwater utility.
High-Resolution Satellites
There are three major satellites that are providing high-resolution satellite imag-
ery today: IKONOS, OrbView, and QuickBird. Table 3.2 provides more information
about high-resolution satellites.
High-resolution imagery shows detailed features, such as houses, schools, street
centerlines, rights-of-way, trees, parks, highways, and building facilities. They can
be used for base-map and land-registry updates, infrastructure mapping analysis and
management, natural resource inventories, ecological assessments, transportation
mapping, and planning the construction of new highways, bridges, and buildings
(Murphy, 2000).
2097_C003.fm Page 56 Monday, December 6, 2004 5:59 PM
Copyright © 2005 by Taylor & Francis
DigitalGlobe’s (formerly Earth Watch) QuickBird-1, designed for 1-m panchro-
matic and 4-m color resolution, failed to achieve its proper orbit after being launched
from Plesetsk, Russia, on November 20, 2000. QuickBird-1’s unfortunate failure is
a good example of a “beneficial loss.” QuickBird-2 was launched on October 18,
2001, on a Boeing Delta II rocket from Vanderberg Air Force Base in California. At
the time of this writing, QuickBird-2 provides the only commercial satellite imagery
of resolution less than 1 m. Figure 3.4 shows the sample QuickBird imagery taken
in 2002 and a photograph of the San Diego Convention Center area in California
that hosts the world’s largest GIS conference (ESRI Annual User Conference) every
year. Note that the boats at the marina and the north and south towers of the Marriot
Table 3.2
List of Major High-Resolution Satellites
Feature QuickBird-2 IKONOS OrbView-3
Company DigitalGlobe Space Imaging ORBIMAGE
Launch date October 18, 2001 September 24, 1999 June 26, 2003
B&W resolution (m) 0.61 1 1
Color resolution (m) 2.5 4 4
Swath width (km) 16.5 12 8
Global cover repeat days 148 247 3
Standard scene size 40 km
×
40 km 13 km
×
13 km User defined
Web site digitalglobe.com spaceimaging.com orbimage.com
Figure 3.4
Sample QuickBird imagery for San Diego, California. (Image courtesy of Digital-
Globe.)
2097_C003.fm Page 57 Monday, December 6, 2004 5:59 PM
Copyright © 2005 by Taylor & Francis
Hotel adjacent to the convention center are clearly visible on the imagery. Digital-
Globe is planning to launch another satellite dubbed WorldView in 2006, which will
be capable of collecting 50-cm panchromatic and 2-m multispectral imagery. World-
View’s 800-km-high orbit will allow the satellite to visit imagery collection sites
more frequently, letting users repeat their image acquisition about once a day.
IKONOS provides 1-m panchromatic and 4-m multispectral (color) imagery.
The satellite weighs 1600 lb and orbits 438 mi above the ground surface. IKONOS
products are available under the CARTERRA
brand name in TIFF and GeoTIFF
format. CARTERRA also provides DOQ — B&W, color, or false color IR 5-m
imagery, cut into a convenient 7.5-min USGS quadrangle format. Orthorectified
CARTERRA DOQs provide an image map suitable for water resources management,
urban and rural planning, change detection, and map creation and revision.
High-Resolution Imagery Applications
GIS applications are poised to bring the recently available high-resolution satellite
imagery directly to the dispatch office of a water, wastewater, or stormwater utility.
For years, aerial photography has been used in many utility GISs, and that use will
continue because of its submeter resolution. High-resolution satellite imagery is now
available commercially at a reasonable cost. Therefore, when a 1-m resolution is
sufficient, satellite imagery can be used as a base map instead of orthorectified digital
orthophotos. High-resolution satellite imagery provides digital data at a fraction of
the cost people pay for aerial photographs of the same level of accuracy. There is
no question that the launch of high-resolution satellites marks a new era in the remote
sensing industry.
Typical applications of high-resolution satellite imagery for the water industry
are described in the following list:
• High-resolution satellite imagery can enable the water and wastewater system
utilities to gather information quickly and inexpensively, allowing them to perform
daily operations more efficiently.
• Multispectral imagery can detect vegetation stress before it is visible to the naked
eye. Watermain leaks and manhole overflows can impact the soil and vegetation
conditions around them. These potential indicators may be used to identify leaks
and overflows.
Thus, although satellites cannot directly locate leaking pipes, they
can provide the surrogate data that can lead to locating them.
• High-resolution imagery is especially useful in remote areas of the world where
there are no governments and commercial archives and where cost and regulatory
hurdles preclude aerial missions.
• Medium-resolution imagery cannot capture some landscape characteristics, such
as distribution of shrubs vs. bare ground or gaps in the forest crown (Space
Imaging, 2001). High-resolution imagery bridges the gap between field measure-
ments and medium-resolution imagery, providing a continuum from point mea-
surements to medium resolution. High-resolution imagery can also be used to
“ground truth” the low- and medium-resolution imagery.
• High-resolution imagery can be used to study urban growth and detailed urban
land-use mapping. It can be used to identify growth trends in order to develop
the necessary infrastructure in advance.
2097_C003.fm Page 58 Monday, December 6, 2004 5:59 PM
Copyright © 2005 by Taylor & Francis
• Damage from natural disasters (earthquakes, hurricanes, fires, and floods) can be
analyzed and response plans prepared. High-resolution imagery can be used to
prepare more accurate flood-prediction computer models, monitor stormwater
runoff, and study erosion and sedimentation.
• Right-of-way encroachments can be identified by periodically running automated
change-detection routines on new imagery.
• Inexpensive pipeline siting and corridor selection can be performed using least-
cost path analysis.
• Ecological assessments can be conducted.
Data Sources
TerraServer was started as a joint research project by Aerial Images, Microsoft,
USGS, and Compaq. It is considered one of the world’s largest online atlases of
high-resolution satellite imagery and aerial photography (Thoen, 2001).
In 2001, USGS, PCI Geomatics, Oracle, and Sun Microsystems teamed up to
provide a new data delivery service called Real-time Acquisition and Processing of
Imagery Data (RAPID). It provides same day service for conversion of TM imagery
into easy-to-use data that can be downloaded using an Internet connection. Using
RAPID, users can have georeferenced, GIS-ready processed imagery within 10 min
of receipt from USGS.
Some consumer-oriented companies are also selling high-resolution satellite
imagery. For example, Eastman Kodak Company’s CITIPIX imagery database con-
sists of 95 major North American metropolitan areas, including 7000 cities and
towns and 600 U.S. and Canadian counties. This ready-to-use “Earth Imaging Prod-
ucts” consist of orthorectified imagery in 6-in., 1-ft, 2-ft, and 1-m resolutions.
Kodak’s 24-bit color images exceed National Map Accuracy Standards’ accuracy
requirement at 1:1200. These products are intended for applications in architecture,
engineering, construction, telecommunication, utilities, insurance, and real-estate
industries as well as local, state, and provincial governments.
The cost of spatial data is falling rapidly due to competition in data acquisition,
processing, and distribution. As satellite imagery has become more widely accepted,
its unit cost has started to decline. For example, Landsat-4 and -5 imagery used to cost
$4400 per scene; now the same scene costs $600. After the launch of QuickBird-2 and
OrbView-3 satellites, the price of IKONOS imagery has come down from $62/km
2
to $29/km
2
(with a 100 km
2
minimum order) — a decrease of over 50%.
DIGITAL ORTHOPHOTOS
Digital orthophotos are a special type of high-resolution remote sensing imagery.
Traditional aerial photos contain image displacements caused by camera lens distor-
tion, camera tip and tilt, terrain (topographic) relief, and scale (Michael, 1994).
Because of these problems, an aerial photograph does not have a uniform scale, and
therefore, it is not a map. The distortions are removed through a rectification process
to create a computer file referred to as a digital orthophoto (DOP). The image
rectification is done with the help of geodetic surveying and photogrammetry. A DOP
2097_C003.fm Page 59 Monday, December 6, 2004 5:59 PM
Copyright © 2005 by Taylor & Francis
is a uniform-scale photographic image and can be considered a photographic map.
As the name implies, orthophotos are orthographic photographs or simply photo maps.
DOPs are very detailed, can be easily interpreted, and provide excellent accuracy
that can be easily quantified and verified. DOPs are a valuable source for developing
an accurate landbase in a GIS mapping project. Because it is a photographic image,
the DOP displays features that may be omitted or generalized on other cartographic
maps. This makes the digital orthophoto valuable as a base map layer in a GIS.
Figure 3.5 shows a DOP base map for a water distribution system mapping project.
The DOP has been processed to remove scale distortion and create an accurate and
true-to-scale base map with an accuracy of
±
1.25 ft. Waterlines have also been
plotted on the digital orthophoto.
USGS Digital Orthophotos
A digital orthophoto quadrangle (DOQ) is an orthorectified raster image of a
low-altitude USGS aerial photograph in Universal Transverse Mercator (UTM)
projection in North American Datum of 1983 (NAD83). DOQs have the geometric
properties of a map and meet the National Map Accuracy Standards. DOQs are
based on the 1:80,000-scale National High Altitude Photography (NHAP) aerial
photos with an altitude of 40,000 ft. They cover an area equal to 7.5 min (1:24,000)
USGS quads (quadrangles); hence their name. They have a resolution of 2 m and
an accuracy of 40 ft. They are available as 5-MB compressed JPEG files that can
be purchased for $35.5 per county CD.
Digital orthophoto quarter quadrangles (DOQQs) are based on the 1:40,000-
scale National Aerial Photography Program (NAPP) aerial photos with an altitude
Figure 3.5
Digital orthophoto base map for water system mapping.
2097_C003.fm Page 60 Monday, December 6, 2004 5:59 PM
Copyright © 2005 by Taylor & Francis
of 20,000 ft. They cover an area equal to a quarter of a 7.5-min USGS quads (3.75 min
of latitude by 3.75 min of longitude in geographic extent); hence their name. They
have a resolution of 1 m and an accuracy of 33 ft. DOQQs also have a UTM map
projection system and NAD83 datum. A sample DOQQ image for Washington, D.C.,
is shown in Figure 3.6.
DOQQs are available as 40 to 50 MB uncompressed files that can be purchased
for $60 per file on CD-ROM from the USGS EarthExplorer Web site. State or
regional mapping and spatial data clearinghouse Web sites are the most valuable
source of free local spatial data. For example, Pennsylvania Spatial Data Access
system (PASDA), Pennsylvania’s official geospatial information clearinghouse and
Pennsylvania’s node on the National Spatial Data Infrastructure (NSDI), provides
free downloads of DOQQ and other spatial data.
Because DOQQs are based on the NAD83 datum, most U.S. ArcView 3.x users
who want to use DOQQs in their GIS projects will have to reproject their NAD27
vector themes into NAD83. NAD83 is an Earth-centered datum (GRS 80 ellipsoid)
unlike NAD27, which is based on an arbitrary starting point in Meades Ranch
(Kansas). The positions or points or features based on these reference datums will
differ considerably. Though reprojected themes will line up reasonably well with
features in DOQQs, a more precise alignment can be achieved by adjusting the false
easting and northing values to “tweak” the theme (Miller, 2000).
Like DOPs, DOQs and DOQQs also can be used as GIS base maps to overlay
other thematic data layers. DOQs can be used in land management, habitat analysis,
evacuation planning, and in many other areas (Miller, 2000).
Figure 3.6
USGS digital orthophoto quarter quadrangle (DOQQ) for Washington, D.C. (Image
courtesy of USGS.)
2097_C003.fm Page 61 Monday, December 6, 2004 5:59 PM
Copyright © 2005 by Taylor & Francis
Case Study: Draping DOQQ Imagery on DEM Data
The city of Ventura, California, is located 70 mi north of Los Angeles, covers
almost 21 mi
2
, and is home to 105,000 people. In an effort to redefine its GIS, the
City acquired 11 USGS DOQQs in 1999. The DOQQs were mosaicked and
reprojected to California State Plane with ERDAS IMAGINE software and com-
pressed with LizardTech’s MrSID software to create a seamless image. They also
created a panoramic view of the city using IMAGINE VirtualGIS software by draping
the DOQQ mosaic over 10-m DEMs obtained from USGS and Intermap Technol-
ogies (Ottawa, Ontario, Canada). The image draping demonstrated the value of
orthorectified imagery and helped the City to derive other GIS data layers, such as
slope, aspect, and shaded relief (ERDAS, 2001a).
EXAMPLES OF REMOTE SENSING APPLICATIONS
A USGS project helping to restore the original water flow of Everglades is a
good example of blending various types of remote sensing data. This project uses
aerial videography, laser imaging detection and ranging (LIDAR)*-based topography,
and Landsat-based vegetation to create hydrodynamic models of water flow (Miotto,
2000).
The Arizona Department of Water Resources (ADWR) uses satellite data (Landsat
and SPOT) and GIS software (ERDAS IMAGINE and ArcInfo) to monitor water
use, regulate water rights, and enforce limits on irrigated acreage expansion. ADWR
purchases growing-season imagery at an annual cost of $15,000. An investigation
is started if the images show crop growth that does not correspond to water rights
(McKinnon and Souby, 1999).
A 1997 USGS study for the California Gulch Superfund Site in Leadville,
Colorado, demonstrated an application of remote sensing in locating and pinpointing
sources of acid mine drainage and a tremendous variety of other surface materials.
Mineral maps produced by the study helped expedite the cleaning of hazardous
material and reduced the cleanup cost. These maps were produced using a new tool
called imaging spectroscopy, the latest in remote sensing science.
Satellite imagery can be used for irrigation monitoring and assessment, or to
evaluate erosion potential or landslides. Other remote sensing applications for the
water industry include land-use classification, soil moisture mapping, and estimation
of meteorological data. These applications are described in the following subsections.
LULC Classification
The San Diego Association of Governments (SANDAG) deals with one of the
nation’s largest county jurisdictions covering more than 4200 mi
2
. Before 1988, SAN-
DAG used costly and time-consuming aerial-photography and photo-interpretation
techniques to create LULC maps and updated them only once every 5 years. To meet
* LIDAR is a new remote sensing technology that measures ground surface elevation from an airplane
to create DEM data. Additional information is provided in Chapter 4 (DEM Applications).
2097_C003.fm Page 62 Monday, December 6, 2004 5:59 PM
Copyright © 2005 by Taylor & Francis
the special challenge of keeping track of this rapidly changing area in a cost-effective
manner, SANDAG turned to GIS. It used raster GIS and image processing software
ERDAS, vector GIS software ArcInfo from ESRI, color-infrared aerial photographs,
and satellite imagery. Switching to satellite imagery and GIS as a land inventory tool
allowed SANDAG to see the region in a new way and permitted rapid change detec-
tion. The GIS-based LULC-mapping approach provided SANDAG with current and
verified LULC data for modeling transportation, infrastructure, and water needs
(Kindleberger, 1992).
In 2003, a digital database of land-cover imagery and vectors was created that
includes the major landmasses of the entire world. Called GeoCover LC (Land Cover),
this was the first worldwide LULC database prepared using medium-resolution Landsat
7 TM imagery.
LULC classification is one of the most common applications of satellite imagery.
Remote sensing data are a valuable source of information for land-use modeling.
Derivation of LULC classes from low-level aerial photography is referred to as the
conventional
method compared with the remote sensing techniques that employ
satellite imagery. Studies have shown that the remote sensing techniques for LULC
classification are more cost-effective. The cost benefits have been estimated on the
order of 6 to 1 in favor of the satellite imagery approach. Although remote sensing-
based land-use statistics may not be as detailed as those derived using the conventional
manual method, many computed parameters such as runoff curve numbers and dis-
charges are nearly the same (Engman, 1993).
The choice of sensors for LULC applications is dictated by the time and space
resolution needed for interpretation. The sensor chosen must permit a suitable
classification of LULC. The quality of this classification will depend on the LULC
types, the quantity of images available, and the dates on which they were taken as
well as the classification technique used. Ambiguities in interpretation can be reduced
by using field information (ground truthing) to improve classifications. The number
of LULC categories depends on the intended application. For example, in watershed
nutrient modeling this number must permit the estimation of total nutrient export
from a subwatershed and to compare the possible effects of land-use changes. At a
minimum, urban, agricultural, grasslands, and forested areas must be clearly distin-
guished. A distinction between types of farming will provide better nutrient estimates
(Payraudeau et al., 2000).
When collecting LULC data, keep in mind the four “Cs”: currency, construction,
categories, and consistency. Currency determines how current your LULC data are.
Construction pertains to new developments that can significantly alter land use and
affect soil erosion, sedimentation, and even water quality. Categories represent the
LULC classes (polygons). One may not want to have an “agricultural” class created
by lumping together cropland, pasture, and dairy farms. And, finally, consistency
determines how consistent in time, scale, resolution, and classification various
sources of LULC data are (Slawecki et al., 2001).
Vegetation is an important part of a watershed’s ecosystem. To preserve and
maintain the watershed ecosystems, resource managers need high-quality vegetation
maps to monitor temporal vegetative changes and to pinpoint habitats and species
likely to be affected by management decisions. Based on the spectral return from
2097_C003.fm Page 63 Monday, December 6, 2004 5:59 PM
Copyright © 2005 by Taylor & Francis
the infrared imagery and using classification techniques of a remote sensing software
package, people can identify trees and other vegetation growing in a watershed and
even determine the total irrigated area. California Department of Forestry and Fire
Protection (Sacramento, California) updates California’s LULC mapping and mon-
itoring program on a 5-year cycle. The program utilizes image classification and
GIS modeling to generate data that describe the condition and extent of various
land-cover types, as well as the magnitude and cause of such changes. Data sources
include DOQs, aerial photographs, and satellite images from Landsat TM, Indian
Remote Sensing, and SPOT. LULC layers are produced using automated image
classification of satellite imagery. This approach efficiently and consistently maps
large areas at a low cost. Next, the LULC layer is converted to vector format and
hand-edited with high-resolution DOQ as a backdrop. GIS models are run in ESRI’s
ArcInfo GRID program to label each LULC polygon with a vegetation type. The
updated LULC map is created by adding the new 5-year LULC change layer to the
old LULC map (Rosenberg et al., 2001).
Dry- and wet-weather flows from sewersheds depend on land use. The hydrologic
and environmental effects of land do not depend on the amount of land-use change
alone. The location of land-use change is equally important. For example, a devel-
opment adjacent to a water body might produce a greater impact on water quantity
and quality. GIS and remote sensing are ideally suited to studying the temporal and
spatial variation of land use. Remote sensing has been recently recognized as a tool
that holds great promise for water quality monitoring activities. In 2003, three U.S.
agencies, the Environmental Protection Agency (EPA), National Aeronautic and
Space Administration (NASA), and the National Oceanic and Atmospheric Admin-
istration (NOAA) entered into a partnership to more fully explore how remote
sensing may support state water quality management activities (Mehan, 2003).
Digital LULC data are used to derive several watershed parameters, such as the
percent imperviousness and runoff curve number, as described in Chapter 11 (Mod-
eling Applications) and Chapter 13 (Sewer Models). This runoff-coefficient estimation
technique is a good example of maximizing the capabilities of remote sensing. The
LULC layer can be developed from supervised (interactive) or unsupervised (auto-
matic) classification of satellite imagery. GIS can be used to reclassify or aggregate
the usually large number of imagery-based LULC classes into a small number of user-
specified LULC classes. GIS can also help to refine or verify the imagery-based LULC
classes. For example, population-density and unit-type (single or multiple family)
attributes of census GIS data (e.g., census blocks) can be used to reclassify the typical
residential land-use classes (e.g., low-, medium-, and high-density residential) into
single-family residential and multifamily residential land-use classes.
LULC changes observed in remote sensing imagery are of interest to planners,
ecologists, hydrologists, and atmospheric scientists. Remote sensing imagery taken
at different times can be compared to detect changes in LULC using a process called
change detection
. Remote sensing change detection can also be used for near-real-
time detection and mapping of fires, power outages, and floods. Remote sensing
change detection techniques can also be adapted for assessing the differences
between modeled and observed images for validation of distributed hydrologic and
ecosystem models (Luce, 2001; Lunetta and Elvidge, 1998).
2097_C003.fm Page 64 Monday, December 6, 2004 5:59 PM
Copyright © 2005 by Taylor & Francis
Standard multispectral data provide only a grid of numbers that literally reflect
the amount of electromagnetic energy measured at a specified small square on the
Earth’s surface. The most common and pervasive problem in any spectral classifica-
tion of these data is the presence of mixed cells called “mixels.” A 10 m
×
10 m
location on the ground may be half lawn and shrub and half rooftop. Obviously,
because the spectral reflectance value for this cell cannot show two half-values, the
value becomes the average of the two surface types, statistically dissimilar from both
vegetation and urban areas. Taking into consideration the fact that cells are not
spectrally divided into only two distinct surface types but every possible combination,
the difficulties in spectrally based classification procedures become apparent. A key
challenge to using multispectral satellite imagery data is to “unmix” (usually urban)
land-use areas that contain numerous mixed pixels due to a highly variable landscape.
High-spectral (or hyperspectral) imagery that divides the electromagnetic spectrum
into a large number of segments for a finer classification of the Earth’s surface is an
important evolving trend. The mixel problem can be eliminated by using hyperspectral
data from new satellites, such as NASA’s Earth Observing-1 (EO-1) and Orbimage’s
OrbView 3. One-and-a-half months after its launch aboard the EO-1 spacecraft
Hyperion, NASA’s first hyperspectral imager was transmitting 30-m resolution images
of the Earth in 220 spectral bands from the visible to shortwave infrared. Hyperion
captures 7.5 km
×
180 km images with high radiometric accuracy. NASA’s ASTER
is capable of collecting 14 bands of data at 15- to 19-m resolutions. The next OrbView
launch is expected to provide a 200-band hyperspectral capability with 8-m resolution.
The hyperspectral analysis software packages such as ENVI use special techniques
like spectral angle mapping or linear spectral unmixing to isolate different contribu-
tions to a single pixel. The IMAGINE software from ERDAS provides a subpixel
classifier to handle the mixed cells (ERDAS, 2001).
Note that local governments are usually the best sources of LULC data because
they are involved most directly in land-planning activities. Many cities maintain
accurate, aerial photo-based parcel maps for tax assessment. Local LULC data can
include outlines of buildings, driveways, and pavements, which are excellent sources
of data for applications that require highly accurate parameters, such as estimation
of percent imperviousness by LULC classes and urban runoff modeling (Slawecki
et al., 2001). Before using GIS and remote sensing techniques to create LULC data,
one should check with local governments and regional organizations in the study
area to determine if existing LULC maps or data are available.
Soil Moisture Mapping
Recent developments have opened the doors for exploring remotely sensed data
in the microwave region. The strength of the microwave signal is directly related to
the amount of water present below the target surface. This feature makes microwave
remote sensing particularly attractive in water resources studies. Microwave sensors
can produce soil-moisture data that measure the surface dielectric properties. Daily
soil-moisture maps can be composed to establish antecedent conditions for runoff
modeling. NASA’s Tropical Rainfall Mapping Mission (TRMM) Microwave Imager
has been used to establish soil moisture over a 140 km
×
280 km region in Oklahoma.
2097_C003.fm Page 65 Monday, December 6, 2004 5:59 PM
Copyright © 2005 by Taylor & Francis
Estimating Meteorological Data
Many watersheds, especially those smaller than 1000 km
2
, do not have recording
rain gauges. These data gaps can be filled by the rainfall data provided by weather
satellites and radars. Detailed applications of remote sensing data in rainfall mea-
surement are provided in Chapter 10 (Monitoring Applications).
Evapotranspiration data are critical in water budget computations of a watershed.
Evapotranspiration measurements require expensive instruments for an area no larger
than a field. Estimation of evapotranspiration for large areas using computer models
may be difficult and time consuming. Research hydrologists at the University of
Nebraska-Lincoln have developed a way to measure watershed evapotranspiration
using vegetative productivity (greenness) extracted from satellite imagery. Because
producing green matter involves using a specific amount of water, evapotranspiration
can be calculated for large areas. Evapotranspiration estimates are used to determine
irrigation-water and groundwater recharge, two of the most difficult-to-estimate
parameters in most water budget computations.
GEOGRAPHIC IMAGING AND IMAGE PROCESSING SOFTWARE
In recent days, geographic imaging has become an essential part of GIS appli-
cations. Without geographic imaging capability, a GIS software is like a car without
a spare wheel, or a computer without a modem, or a pizza without toppings. Imagine
tens or hundreds of image tiles that have unbalanced color, brightness, or contrast,
which must be manually adjusted to plot nicely. Imagine a GIS project involving 6-in.
resolution images for an entire county and the user waiting for the computer to
redraw the screen as he or she zooms in and out. Geographic-imaging and image
processing products solve these problems by helping users to visualize, manipulate,
analyze, measure, and integrate geographic imagery and geospatial information.
These programs can be classified in two categories:
1. Preprocessors: These programs (such as MrSID described in the following text),
help to preprocess raster data for GIS applications. Some preprocessing programs
can join multiple images to provide georeferenced color-balanced mosaics. They
combine multiple frames of scanned film, digital photos, or satellite images into
a single picture and apply mapping-coordinates information to the mosaicked
image for spectral and spatial analysis.
2. GIS Extensions: These programs add image processing capability to a GIS soft-
ware. For example, Image Analysis is an extension that adds image processing
capability to ArcView GIS software.
Representative software are listed in Table 3.3 and described in the following
subsections.
ERDAS Software Products
ERDAS, Inc. (Atlanta, Georgia), is a leading geographic imaging and image
processing software company. The company’s software products help organizations
2097_C003.fm Page 66 Monday, December 6, 2004 5:59 PM
Copyright © 2005 by Taylor & Francis
Table 3.3
Geographic-Imaging and Image Processing Software
Software Version Vendor Cost ($) Web site
ERDAS IMAGINE 8.7 Leica Geosystems, Atlanta >5000 gis.leica-geosystems.com
www.erdas.com
ER Mapper 6.1 Earth Resources Mapping,
West Perth, Australia
5000 www.ermapper.com
Image Analysis 1.1 ERDAS and ESRI 2500
Geomatica — PCI Geomatics, Ontario,
Canada
N/A www.pcigeomatics.com
EASI/PACE 7.0
Image Analyst for MicroStation — Z/I Imaging Corp. N/A www.ziimaging.com
Geographic Transformer 4.2 Blue Marble Geographics 800 www.bluemarblegeo.com
MrSID 1.4 LizardTech 1000–3500 www.lizardtech.com
ENVI 3.4 Research Systems, Inc. 4000 www.rsinc.com
2097_C003.fm Page 67 Monday, December 6, 2004 5:59 PM
Copyright © 2005 by Taylor & Francis
visualize, manipulate, analyze, measure, and integrate geographic imagery and
geospatial information into 2D and 3D environments. In July 2001, ERDAS’s geo-
graphic imaging software division was acquired by Leica Geosystems (Heerbrugg,
Switzerland) to form a new GIS and mapping division. In the GIS community, Leica
Geosystems is known for its GPS and field data collection related equipment.
The ERDAS flagship product is called IMAGINE (previously known as ERDAS;
the latest version is 8.7); it provides remote sensing capabilities and a broad range
of geographic imaging tools. It contains tools to make data production faster and
easier, such as on-the-fly reprojection, a batch wizard to automate routine procedures,
the ability to create and edit ESRI Shapefiles, and faster and easier map production
capabilities. It also provides enhanced mosaicking capabilities for creating seamless
output images. Using specialized color-balancing procedures to remove “hot spots”
from aerial photographs and satellite imagery, IMAGINE’s simple but powerful
mosaicking tool can run in an automated mode or allow users to intervene for quality
assurance. For example, its cropping feature removes an image’s rough edges, and
the Exclude Areas tool can be used to define pixel groups likely to skew the image
histogram and cause erroneous mosaicking artifacts.
The ERDAS IMAGINE product suite consists of three components that can be
combined to create a scaleable solution for project-specific needs:
• IMAGINE Essentials: A mapping and visualization tool that allows different types
of geographic data to be combined with imagery and organized for a mapping
project.
• IMAGINE Advantage: This component builds upon the geographic imaging capa-
bilities of IMAGINE Essentials by adding more precise mapping and image
processing capabilities. It analyzes data from imagery via image mosaicking, surface
interpolation, and advanced image interpretation and orthorectification tools.
• IMAGINE Professional: This is a suite of sophisticated tools for remote sensing
and complex image analysis. It contains all the capabilities of IMAGINE Essen-
tials and IMAGINE Advantage and adds radar analysis and advanced classification
tools like the IMAGINE Expert Classifier. It also includes graphical spatial data
modeling, an advanced feature for geographic data analysis.
ERDAS MapSheets is a mapping and geographic presentation software package.
Because of it’s compatibility with Microsoft Office, MapSheets allows using Object
Linking and Embedding (OLE) technology to incorporate maps and images into
reports, presentations, and spreadsheets. Reportedly, it is as easy to use as a word
processor or a spreadsheet because it works directly with Microsoft Office software.
It allows adding a map to a Microsoft Word report, using Excel to query the map
attributes, using corporate data with Microsoft Access, and making presentations in
PowerPoint. MapSheets allows reshaping images and drawings that have different
projections. Its change-detection feature allows viewing changes from one image or
drawing to another.
ERDAS Software Application Example
With a population of over 500,000 people, Colorado Springs, Colorado, is the
U.S.’ 18th-fastest growing city. In 1999, the Water Resources Department of Colorado
2097_C003.fm Page 68 Monday, December 6, 2004 5:59 PM
Copyright © 2005 by Taylor & Francis
Springs Utilities (CSU) embarked on a pipeline-mapping project using high-resolution
aerial photographs. CSU used 6-in. resolution DOPs of the Rockies to accurately,
quickly, and inexpensively create a base map of two water pipelines that stretch
approximately 130 mi. The resulting data were combined with GPS and ArcInfo GIS
data to create an accurate set of detailed pipeline maps at a scale of 1 in.
=
200 ft.
CSU utilized ERDAS’ Stereo Analyst, IMAGINE Virtual GIS, and IMAGINE Ortho-
BASE geographic imaging software products. The compatibility between ERDAS
and ESRI products allowed CSU to leverage its existing ArcInfo data to analyze
pipeline accessibility, maintenance history and schedules, and future water needs.
CSU also used high-resolution aerial photographs to create a detailed map of its
water treatment plant in about 2 weeks. The ability to process more high-resolution
imagery in-house in less time helped CSU to cost-effectively and efficiently maintain
its GIS and save an estimated $1.8 million in mapping cost (ArcNews, 2001a).
ArcView Image Analysis Extension
ArcView Image Analysis Extension was developed as a collaborative effort
between ESRI and ERDAS. It provides a direct path from IMAGINE to ArcView
for users with complex geographic imaging and processing needs and provides
readily available image and remote sensing data. It allows georeferencing imagery
to Shapefiles, coverages, global positioning system points, or reference images;
image enhancement; automatic mapping of feature boundaries; change detection for
continuous and thematic imagery; multispectral categorizations for LULC mapping
and data extraction; vegetation greenness mapping; and mosaicking imagery from
different sources and different resolutions. One of the most useful tools in Image
Analysis Extension is the Image Align tool designed to coregister image data to
vector layers. The intuitive point-marking scheme is designed to make image recti-
fication simple for novices. In addition to the standard rectification process from
user-specified control points and GPS-collected points, the software also displays
selected satellite data types in proper map position automatically. This capability is
called image calibration, and is based on positional information (ephemeris) provided
in commercial data sources. Image Analysis’ spectral-categorization capabilities
include unsupervised image classification with ISODATA classifier and finding like
areas for single-class identification. These capabilities can be used for automatic
LULC classification from satellite imagery.
ERDAS Stereo Analyst is another ArcView extension. It allows users to collect
and visualize spatial data in true stereo and to roam with real-time pan and zoom.
Features include the ability to collect and edit 3D Shapefiles and visualization of
terrain information, tree stands, and watersheds.
MrSID
Water system and sewer system GIS data generally have DOP base maps that
are stored in extremely large files. For example, the City of Loveland, Colorado,
had four aerial photo images of 1.3 gigabytes (GB) each (Murphy, 2000a). The
recent explosion of high-resolution imagery has dramatically increased the size of
2097_C003.fm Page 69 Monday, December 6, 2004 5:59 PM
Copyright © 2005 by Taylor & Francis
raster data. Raster images are storage-hungry but compressed images lose resolution
because there is a trade-off between image size and resolution. Large image files
take a long time to display on the computer. Fortunately, the data-reading capacity
of image processing software has increased from a few gigabytes to the terabyte
range. Image-compression techniques have played a critical role in storing large
raster data sets in compressed file formats, such as Earth Resource Mapping’s ECW
format and LizardTech’s MrSID format.
Multiresolution Seamless Image Database (MrSID) is a relatively new image
file type (SID) from LizardTech. It encodes large, high-resolution images to a fraction
of their original file size while maintaining the original image quality. Images become
scalable and can be reduced, enlarged, zoomed, panned, or printed without compro-
mising integrity. MrSID’s selective decompression and bandwidth-optimization
capabilities also increase the file transfer speed. MrSID provides the world’s highest
compression ratios that average at about 40 but can be as high as 100. For example,
Mecklenburg County, North Carolina, had 708 sheets of 1-in.
=
1000-ft B&W digital
orthophotos for 538 mi
2
of the entire county. The scanned 9 in.
×
9 in. films at a
resolution of 1-ft to 1-pixel created approximately 23 MB georeferenced TIFF files.
This procedure created 16 GB of imagery stored on 27 CD-ROMs. Delivering a
compression ratio of 1:28, MrSID took 14 hours on a Pentium PC with 512 MB of
RAM to compress 16 GB of imagery to a single 608 MB MrSID Portable Image
Format that could be stored on a single 650 MB CD-ROM (Kuppe, 1999). Similarly,
MrSID was able to compress 18 GB of Washington, D.C., DOPs onto one CD-ROM.
MrSID allows fast viewing of massive images. For instance, displaying a 50 MB
TIFF image can take several minutes, whereas it requires only a few seconds to open
the same image in the MrSID format. Reportedly, MrSID software can automatically
mosaic hundreds of image tiles of virtually any size into a single, seamless image
that is geometrically and geographically accurate with all georeferencing data intact.
MrSID images can be viewed in most popular GIS software packages, such as ESRI’s
ArcInfo, ArcView, MapObjects, ArcIMS, ArcExplorer, and ArcPad; Autodesk, Inter-
graph, and GE Smallworld. MrSID ArcView GIS extension allows MrSID images to
be instantly decompressed and displayed within ArcView GIS. It takes advantage of
MrSID’s image-compression and retrieval capability and offsets the problems of
working with large images in ArcView GIS. MrSID’s ArcView GIS extension gives
users the ability to work with raster images of any size while providing instantaneous,
seamless, multiresolution browsing of large raster images in ArcView.
PCI Geomatics
PCI Geomatics (Ontario, Canada) provides a suite of image processing, remote
sensing, orthophoto, and GIS software tools. In 2001, PCI Geomatics software was
used to produce “ImageMap USA,” the first seamless color satellite image of the
continental U.S. at 15-m spatial resolution. This mosaic is composed of approxi-
mately 450 individual Landsat 7 satellite scenes. PCI Geomatics’ software products
are described below.
Geomatica
™
unites previously separate technologies that were dedicated to
remote sensing, image processing, GIS (both vector and raster), cartography, and
2097_C003.fm Page 70 Monday, December 6, 2004 5:59 PM
Copyright © 2005 by Taylor & Francis
desktop photogrammetry into a single integrated environment. Geomatica represents
the most aggressive movement toward the integration of GIS and image processing
functions in one software package (Limp, 2001). Although Geomatica is available
in several configurations, all have a consistent user interface and data structure.
EASI/PACE desktop remote sensing software allows working with Landsat, SPOT,
air photos, or radar data in one image processing package. Users can use data from
GIS databases and extract information for resource analysis, mapping and environ-
mental applications. It can also be used to make image maps and update GIS data.
ImageWorks is a GUI-based software that incorporates the most frequently
needed image-display, enhancement, and data management tools in a user-friendly
interface. The software provides integrated raster and vector display capability.
OrthoEngine Suite provides capabilities for producing map-accurate imagery. It
can orthorectify many types of image data, including aerial photos, digital camera
frames, and Landsat, SPOT, IRS, IKONOS, RADARSAT, ERS, and JERS imagery.
It allows DEM generations from SPOT, IRS, or RADARSAT imagery. It also provides
manual and automatic mosaicking tools to create seamless mosaics of multiple images.
FLY! is a terrain-visualization tool that drapes imagery and vectors over DEM
data to create 3D perspective scenes in near real-time. An intuitive point-and-click
user interface enables users to control flight speed, direction, elevation, and perspec-
tive parameters interactively during flight.
Radar imagery from satellites and aircraft has become a significant tool for a
wide range of remote sensing applications. Data from sources such as RADARSAT,
ERS, and JERS provide timely and consistent sources of information, regardless of
weather conditions or illumination. With the expanding use of radar-imaging systems
comes the need for new processing tools to extract useful information. Imaging radar
data requires special handling and analysis techniques. PCI Geomatics has developed
RADARSOFT to meet these needs.
PAMAP is a full-featured GIS software that combines an easy-to-use interface
with increased interactivity and dynamic links to many industry-standard external
databases for efficient storage of attribute data. It uses PCI Geomatics’ Generic
Database (GDB) technology, which supports over 50 different raster and vector data
types facilitating easy exchange of spatial and attribute data.
GeoGateway allows users to visualize large data files, reproject them into any of
the over 25 supported projection systems (or define a new projection system), subset
the files into smaller windows of data, and write the resulting data out to a different,
more distributable format, or even to an enterprise relational database such as Oracle.
Blue Marble Geographics
Blue Marble Geographics provides a host of geographic imaging, image
processing, and map-projection software tools and utilities. The Geographic
Transformer allows users to establish an “image-to-world” relationship between
image and map coordinates and reproject an image into a georeferenced image map.
It is a simple software to georeference, reproject, tile, and mosaic images. The
Geographic Transformer AVX is an ArcView extension that integrates these functions
directly into the ArcView GIS environment. Geographic Calculator is a stand-alone
2097_C003.fm Page 71 Monday, December 6, 2004 5:59 PM
Copyright © 2005 by Taylor & Francis