GIS Applications for Water, Wastewater, and Stormwater Systems - Chapter 8 ppsx
Bạn đang xem bản rút gọn của tài liệu. Xem và tải ngay bản đầy đủ của tài liệu tại đây (3.57 MB, 24 trang )
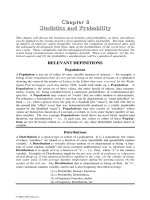
CHAPTER
8
Mapping
GIS provides powerful and cost-effective tools for creating intelligent
maps for water, wastewater, and stormwater systems.
A sewer system map created by GIS (Borough of Ramsey, New Jersey).
2097_C008.fm Page 137 Monday, December 6, 2004 6:04 PM
Copyright © 2005 by Taylor & Francis
LEARNING OBJECTIVE
The learning objective of this chapter is to understand how to create GIS maps for
water, wastewater, and stormwater systems.
MAJOR TOPICS
• Mapping basics
• Map types
• Advantages of GIS maps
• GIS mapping steps
• Mapping case studies
LIST OF CHAPTER ACRONYMS
AM/FM
Automated Mapping/Facilities Management
AML
Arc Macro Language
DRG
Digital Raster Graphics (USGS topographic maps)
NAD-27
North American Datum of 1927
NAD-83
North American Datum of 1983
QA/QC
Quality Assurance/Quality Control
SPC
State Plane Coordinate (Map Projection System)
TIGER
Topologically Integrated Geographic Encoding and Referencing System (U.S.
Census Bureau Mapping System)
UTM
Universal Transverse Mercator (Map Projection System)
VBA
Visual Basic for Applications
This book focuses on the four main applications of GIS, which are mapping, monitor-
ing, maintenance, and modeling and are referred to as the “4M applications.” In this chapter
we will learn how to implement the first
m
(mapping).
LOS ANGELES COUNTY’S SEWER MAPPING PROGRAM
In the 1980s, the Sanitation Districts of Los Angeles County, California, envisioned
a computerized maintenance management system that would provide decision makers
with essential information about the condition of the collection system. A sewer and
manhole database was subsequently developed, but investments in GIS technology
were deferred until the early 1990s when desktop PCs became powerful enough to
run sophisticated GIS applications. In 1993, a GIS needs analysis study was performed,
which recommended implementation of a large-scale enterprise-wide GIS. An in-
house effort was started to implement the recommendations of the study. Several
sections in the Districts formed a project committee to pilot test GIS technology that
could be duplicated in all 25 districts. The pilot project developed a mapping appli-
cation for a small district that acted as a front-end to the large database of sewerage
2097_C008.fm Page 138 Monday, December 6, 2004 6:04 PM
Copyright © 2005 by Taylor & Francis
facilities developed in the 1980s and 1990s. At this point, much of the information
was nonspatial, including multiple databases in a variety of formats and paper maps.
Converting this information into GIS proved to be the most time consuming and costly
operation. Creation of the layers for sewers and manholes was the most laborious of
all the layers that had to be created. Manhole data were represented by approximately
24,000 points or nodes digitized from the paper maps, using a base map. The GIS
layers were created in CAD software and linked to the legacy databases. Once linked,
detailed data such as sewer pipe and manhole construction material, size, condition,
flow, capacity, and inspection data were available for query and analysis through an
intuitive map-driven interface. By 2003, the pilot project had grown to become the
first enterprise-wide solution deployed by the Districts. Called “Sewerage Facilities
GIS,” the system allowed users to access and view data from the legacy databases by
selecting sewers and manholes on a map or using standard queries. The mapping
application also provided sewer tracing functionality that proved helpful in delineating
study area boundaries for design projects, annotating sewers with flow direction, and
tracking potential discharge violations (Christian and Yoshida, 2003).
MAPPING BASICS
The basic concepts essential for understanding GIS mapping are summarized in
the following subsections.
Map Types
There are two major types of GIS maps: vector and raster. In
vector
format, objects
are represented as points, lines, and polygons. Examples of the vector format are maps
of water mains, hydrants, and valves. Scanned maps, images, or aerial photographs
are examples of
raster
format. Raster data are also referred to as grid, cell, or grid–cell
data. In raster format, objects are represented as an image consisting of a regular grid
of uniform size cells called
pixels
, each with an associated data value. Many complex
spatial analyses, such as automatic land-use change detection, require raster maps.
Raster maps are also commonly used as base maps (described later in this chapter).
Existing paper maps that are used to create GIS maps are called
source
maps.
Topology
Topology is defined as a mathematical procedure for explicitly defining spatial
relationships between features. Spatial relationships between connecting or adjacent
features, such as a sewer tributary to an outfall or the pipes connected to a valve,
which are so obvious to the human eye, must be explicitly defined to make the maps
“intelligent.” A topological GIS can determine conditions of adjacency (what is next
to what), containment (what is enclosed by what), and proximity (how near some-
thing is to something else). Topological relationships allow spatial analysis functions,
such as network tracing, that can be used to facilitate development of hydraulic
models for water and sewer systems.
2097_C008.fm Page 139 Monday, December 6, 2004 6:04 PM
Copyright © 2005 by Taylor & Francis
Map Projections and Coordinate Systems
Because the Earth is round and maps are flat, transferring locations from a curved
surface to a flat surface requires some coordinate conversion. A
map projection
is a
mathematical model that transforms (or projects) locations from the curved surface of
the Earth onto a flat sheet or 2D surface in accordance with certain rules. Mercator,
Robinson, and Azimuthal are some commonly used projection systems. Small-scale
(1:24,000 to 1:250,000) GIS data intended for use at the state or national level are
projected using a projection system appropriate for large areas, such as the Universal
Transverse Mercator (UTM) projection. The UTM system divides the globe into 60
zones, each spanning 6˚ of longitude. The origin of each zone is the equator and its
central meridian. X and Y coordinates are stored in meters. Large-scale local GIS data
are usually projected using a State Plane Coordinate (SPC) projection in the United States.
A
datum
is a set of parameters defining a coordinate system and a set of control
points with geometric properties known either through measurement or calculation.
Every datum is based on a spheroid that approximates the shape of Earth. The North
American Datum of 1927 (NAD27) uses the Clarke spheroid of 1866 to represent
the shape of the Earth. Many technological advances, such as the global positioning
system (GPS), revealed problems in NAD27, and the North American Datum of
1983 (NAD83) was created to correct those deficiencies. NAD83 is based on the
GRS80 spheroid, whose origin is located at the Earth’s center of mass. The NAD27
and NAD83 datum control points can be up to 500 ft apart.
Coordinates
are used to represent locations on the Earth’s surface relative to
other locations. A
coordinate system
is a reference system used to measure hori-
zontal and vertical distances on a map. A coordinate system is usually defined by
a map projection. The GIS and mapping industries use either latitude/longitude- or
geodetic-based coordinate grid projections. Because much of the information in a
GIS comes from existing maps, a GIS must transform the information gathered
from sources with different projections to produce a common projection.
Map Scale
Map design addresses two fundamental map characteristics: accuracy and
depicted feature types. Both characteristics vary with map scale. Generally, larger
scale maps are more accurate and depict more detailed feature types. Smaller scale
maps, such as U.S. Geographical Survey (USGS) quadrangle maps, generally show
only selected or generalized features. Table 8.1 summarizes the relationships among
map scale, accuracy, and feature detail.
Data Quality
The famous computer industry proverb “garbage in, garbage out” conveys very
well the importance of GIS data quality. A GIS map is only as good as the data used
to create it. Data quality roughly means how good the data are for a given application.
Data quality is important because it determines the maximum potential reliability
of the GIS application results. Use of inappropriate data in a GIS map may lead to
2097_C008.fm Page 140 Monday, December 6, 2004 6:04 PM
Copyright © 2005 by Taylor & Francis
misleading results and erroneous decisions, which may erode public confidence or
create liability.
Data Errors
There are two types of data errors: inherent errors embedded in the source of
data and operational errors introduced by users during data input, storage, analysis,
and output. Inherent errors can be avoided by using the right kind of data. Operational
errors can be prevented by quality control and training.
A data conversion team should be aware of sources and magnitudes of data error.
For example, spatial information in USGS 1:24,000-scale (7.5-min) topographic
maps is certified to have 90% of its features within 50 ft (15 m) of their correct
location. 50 ft is large enough to underestimate the runoff from a new development
and undersize a detention pond for adequate stormwater management.
Map Accuracy
A primary factor in the cost of data conversion is the level of positional accuracy.
Required map accuracy and resolution depend on the application in which the maps
will be used. A 2000 survey conducted by the Geospatial Information and Technol-
ogy Association (GITA) indicated that the water utilities were seeking more landbase
accuracy of 5-ft compared with other utilities, such as the 50-ft accuracy sought by
the gas companies (Engelhardt, 2001; GITA, 2001). The same survey for 2002
indicated that the water industry required the highest accuracy in their GIS projects.
Among the water organizations, 27% were using a 6-in. landbase accuracy compared
to electric (12%), gas (17%), pipeline (17%), and telecom (0%) organizations (GITA,
2003). These data reveal that a trend toward increasing accuracy may be emerging
in the water industry.
Engineering applications usually require ±1 to 2 ft accuracy. For planning and
regional analysis applications, ±5 to 10 ft accuracy is generally appropriate (Cannistra,
1999). Sometimes relative accuracy (e.g., ±1 ft from the right-of-way line) is more
important than an absolute level of accuracy (e.g., ±1 ft from the correct location). For
the applications where positional accuracy is less important, supposedly low-resolution
data, such as USGS digital orthophoto quadrangles (DOQs), may be acceptable. In
other applications where features must be positioned within a foot of their actual
position, even the presumably high-resolution data, such as 1-m IKONOS imagery,
Table 8.1
Relationships among Map Scale, Accuracy, and Feature Detail
Map Scale
Minimum Horizontal Accuracy,
per National Map
Accuracy Standards
Examples of Smallest
Features Depicted
1 in.
=
50 ft
±
1.25 ft Manholes, catch basins
1 in.
=
100 ft
±
2.50 ft Utility poles, fence lines
1 in.
=
200 ft
±
5.00 ft Buildings, edge of pavement
1 in.
=
2000 ft
±
40.00 ft Transportation, developed areas,
watersheds
2097_C008.fm Page 141 Monday, December 6, 2004 6:04 PM
Copyright © 2005 by Taylor & Francis
may not be accurate enough. As a rule of thumb, a database built from a map will have
positional inaccuracies of about 0.5 mm at the scale of the map because this is the
typical line width of the drawing instrument. This can cause inaccuracies of up to 12
m in a database built from 1:24,000 mapping, such as USGS DRGs (Goodchild, 1998).
Precision and accuracy are two entirely different measures of data quality and
should not be confused. A GIS can determine the location of a point feature precisely
as coordinates with several significant decimal places. However, many decimal places
in coordinates do not necessarily mean that the feature location is accurate to a 100th
or 1000th of a distance unit. Once map data are converted into a GIS environment, the
data are no longer scaled, as the data can be scaled as desired to create any output map
scale. However, the spatial data can never be any more accurate than the original source
from which the data were acquired. GIS data are typically less accurate than the source,
depending on the method of data conversion. Therefore, if data were captured from a
source map scale of 1 in. = 2000 ft, and a map was created at 1 in. = 100 ft, the map
accuracy of features shown would still be 1 in. = 2000 ft (PaMAGIC, 2001).
MAP TYPES
Various map types used in GIS are discussed in the following subsections.
Base Map
The map layers are registered to a coordinate system geodetic control framework
and a set of base information, often referred to as a base map. The foundation for
a successful GIS mapping project is an appropriately designed base map. The base
map is the underlying common geographic reference for all other map layers. The
common reference provides registration between various layers and allows them to
be overlayed, analyzed, and plotted together. Because the base map serves as the
reference layer for other layers, its accuracy can affect the accuracy of other layers.
This is especially true if the base map is used to create other layers by on-screen
(heads-up) digitization.
Selection of an appropriate base-map scale is largely determined by the earlier
choice of GIS applications. Each application inherently requires a certain minimum
base-map accuracy and certain map features. For engineering and public-works
applications, the required map accuracy is in the range of ±1 ft, as dictated by the
need to accurately locate specific physical features, such as manholes and catch
basins. Planning applications, which most often deal with areawide themes, do not
generally require precise positioning. Accuracies of ±5 ft, or perhaps as much as
±40 ft, are often acceptable. Less detailed maps, showing nothing smaller than roads
and buildings, for example, may be adequate for many planning applications.
Whatever the range of mapping requirements, the base map must be accurate and
detailed enough to support applications with the most demanding map accuracies of
better than
±
2 ft. Utility asset location also requires mapping that depicts specific
small features such as manholes and catch basins. As shown in Table 8.1, these
requirements are met by a map scale of 1 in. = 50 ft.
2097_C008.fm Page 142 Monday, December 6, 2004 6:04 PM
Copyright © 2005 by Taylor & Francis
There are three common types of base maps: digital orthophotos, planimetric
maps, and small-scale maps.
Digital Orthophotos
For laypersons, digital orthophotos (or orthophotographs) are scanned aerial
photos. For GIS professionals, they are orthorectified raster images of diapositive
transparencies of aerial photographs. Creation of a digital orthophoto requires more
than a photo and a scanner, and includes surveyed ground control points, stereo
plotters, and a digital elevation model. In fact, the digital orthophoto creation process
involves many steps, which are listed below:
• Establish ground control
• Conduct aerial photography
• Perform analytical aerotriangulation
• Set stereo models in stereo plotters
• Capture digital elevation models
• Scan aerial photographs
• Digitally rectify the scanned photographs to an orthographic projection
• Produce digital orthophotos
Digital orthophotos are popularly used as base maps that lie beneath other GIS
layers and provide real-life perspectives of terrain and surroundings that are not
available in the vector GIS layers. Typical vector data do not show vegetation.
The vector layers can show the manhole location but may not include the vegetation
hiding the manhole. High-resolution orthophotos with submeter accuracy can
guide the public-works crews directly to a manhole hidden behind bushes. Know-
ing the land-cover characteristics before leaving for an emergency repair of a
broken water main will allow the crews to bring the appropriate tools and equip-
ment. Knowing whether the job will be on a busy intersection or in somebody’s
backyard will determine the kind of equipment, material, and personnel required
for the job. Figure 8.1 shows a water system map overlayed on a digital orthophoto
base map with an accuracy of ±1.25 ft. Typical digital orthophotos cost $800 to
$1600 per mi
2
.
Planimetric Maps
Like digital orthophotos, planimetric base maps are also created from aerial
photographs. However, instead of scanning the aerial photos, the features are digi-
tized from them. Thus, whereas digital orthophotographs are raster files, planimetric
maps are vector files. Planimetric maps generally show building footprints, pavement
edges, railroads, and hydrography. Parcels digitized from existing maps are often
added to the mix. Figure 8.2 shows a sample planimetric map for the Borough of
Munhall, Pennsylvania, extracted from the Allegheny County land base. The bor-
ough’s sewer lines and manholes are overlayed on the planimetric base map. The
cost of planimetric maps depends on the level of detail and, therefore, varies signif-
icantly from project to project. The typical cost range is $2,500 to $10,000 per mi
2
.
2097_C008.fm Page 143 Monday, December 6, 2004 6:04 PM
Copyright © 2005 by Taylor & Francis
Small-Scale Maps
Small or rural systems often use small-scale street maps or topographic maps
as base maps. Street maps can be created by digitizing the existing maps, obtained
from a government agency (e.g., U.S. Census Bureau, USGS, or state department
of transportation) or purchased from commercial data vendors. In the U.S.,
1:24,000-scale raster topographic map layers called digital raster graphics (DRG)
are provided by USGS. Shamsi (2002) provides detailed information about the
sources of small-scale maps. Users should be aware of the scale, resolution, accu-
racy, quality, and intended use of small-scale base maps before using them. Most
maps at scales of 1:100,000 and smaller are not detailed enough to be used as site
maps or engineering drawings, but they can be used for preliminary studies and
planning projects. Figure 8.3 shows interceptor sewers and pumping stations for
the Kiski Valley Water Pollution Control Authority in Pennsylvania, on a base map
Figure 8.1
A water distribution system overlayed on a digital orthophoto base map.
2097_C008.fm Page 144 Monday, December 6, 2004 6:04 PM
Copyright © 2005 by Taylor & Francis
of streets. The 1:100,000-scale solid roads are from the U.S. Census Bureau’s 1990
Topologically Integrated Geographic Encoding and Referencing System (TIGER)
data. The 1:24,000-scale dashed roads are from the Pennsylvania Department of
Transportation. Unlike double-line pavement edges shown on the planimetric maps,
these road layers show the single-line street center lines. The difference in the
position of the roads in the two layers can be attributed to the resolution, scale,
and accuracy of the two layers.
ADVANTAGES OF GIS MAPS
The most challenging part of a GIS application project is to obtain the right kind
of maps in the right format at the right time. Therefore, maps are the most important
component of a GIS. Without maps, you simply have a computer program, not a GIS.
Figure 8.2
A sewer system overlayed on a planimetric base map.
2097_C008.fm Page 145 Monday, December 6, 2004 6:04 PM
Copyright © 2005 by Taylor & Francis
In many water and wastewater systems, there is a backlog of revisions that are
not shown on the maps and the critical information is recorded only in the memories
of employees. However, there is no longer any excuse to procrastinate because GIS-
based mapping is easy and affordable.
In the past, users have selected computer-aided drafting (CAD) and automated
mapping and facilities management (AM/FM) systems to map their water and sewer
systems, CAD being the most common method. Although a map printed from CAD
or AM/FM might look like a GIS map on paper, it does not have the intelligence of
a GIS map. GIS maps are intelligent because they have attributes and topology. Most
conventional CAD maps do not have attributes; they simply print data as labels or
annotations. For example, the mapmaker must manually write the pipe diameter next
to a pipe or must manually change the pipe color or line type to create a legend for
pipe size. This is a very cumbersome process. On the other hand, GIS stores the
attributes in a database and links them to each feature on the map. This capability
allows automatic creation of labels and legends at the click of a mouse button. In
GIS, map labels and legends are changed automatically if an attribute changes. In
CAD, the mapmaker must manually delete the old label and retype the new label.
Only a GIS map knows the spatial relationships among its features. Called
topology
,
this capability makes the GIS maps intelligent. For example, a GIS map is intelligent
enough to know which watershed is adjacent to which. Although both the CAD and
AM/FM offer map layers to store different types of objects, only a GIS map has the
capability to relate data across layers. The spatial relations among layers allow spatial
Figure 8.3
A sewer system overlayed on a streets base map.
2097_C008.fm Page 146 Monday, December 6, 2004 6:04 PM
Copyright © 2005 by Taylor & Francis
analysis operations such as identifying the gate valves that must be closed to isolate
a broken water main for repair.
A commercial map atlas company may use a CAD system because its applica-
tions are primarily for cartographic products. A telephone company will use an
AM/FM system to support its telephone system operations and maintenance, because
it must be able to quickly trace a cable network and retrieve its attributes (Korte,
1994). For a water or sewer system, a GIS map is most suitable because the system
must conduct many types of spatial analyses, asking questions such as how many
customers by type (residential, commercial, industrial) are located within 1000 ft of
a proposed water or sewer line.
In addition to water and sewer system management, GIS-based maps can also
support other needs of the municipality. For example, a planning department can
generate 200-ft notification lists as part of its plan review process. A public works
department can conduct maintenance tracking and scheduling. A public-safety
department can perform crime location analysis. GIS-based mapping is therefore
the most appropriate mapping technology to meet all the mapping needs of a
municipality.
GIS MAPPING STEPS
GIS mapping consists of five typical steps:
1. Needs analysis
2. Data collection
3. Data conversion
4. Data processing
5. Map production
These steps are intended for GIS technicians who work in a GIS lab (or produc-
tion shop) equipped with map-making equipment such as digitizers, scanners, and
plotters. Some professionals, such as civil and environmental engineers who are
users rather than creators of GIS maps, generally do not perform all of these steps.
Needs Analysis
Mapping work should begin with needs analysis as described in Chapter 2. The
needs analysis study describes the features that should be captured during the data
conversion step, mapping specifications (accuracy, resolution, scale, etc.), and source
documents. For example, the needs analysis determines whether or not the customer
meters should be mapped. If the answer is yes, then how and to what accuracy
should they be mapped. Are precise coordinates needed or can they be drawn at the
end of service line? For large systems (populations greater than 50,000), a pilot
project should be conducted as described in Chapter 2 (Needs Analysis). The pilot
project allows potential fine-tuning of mapping specifications in a two- to four-sheet
area before starting the map production phase.
2097_C008.fm Page 147 Monday, December 6, 2004 6:04 PM
Copyright © 2005 by Taylor & Francis
Data Collection
When existing maps do not exist or are inadequate, mapping data should be
collected using a field survey with or without GPS. Required data are usually
scattered among a multitude of different organizations and agencies. For instance,
it is claimed that 800 worker-years would be needed to convert England’s sewer
system to digital format, including field verification work (Bernhardsen, 1999). Field
data collection using mobile GIS and GPS technology that employs handheld devices
and tablet PCs is becoming common for collecting attributes (Chapter 7, Mobile
GIS). The question of quantity should be evaluated carefully before the data con-
version is started. Too little data limits the mapping applications. Too much data
typical of a “data-driven” approach might be wasteful.
Data Conversion
Also referred to as the production work, this step converts hard-copy maps into
digital files using digitization with or without scanning. The data conversion process
is typically the most expensive and time-consuming part of a GIS mapping project.
Depending on the level of detail, data conversion can cost $500 to $5000 per map
sheet. Approximately 75% of typical GIS costs are related to data conversion and
creation. The data conversion work, therefore, should be structured to ensure con-
sistency, integrity, and accuracy.
Captured data are stored in
layers
also referred to as coverages or themes. For
example, manholes are captured as a point layer, sewer pipes are captured as a line
layer, and sewersheds are captured as a polygon layer. The layers that support
development of other layers should be given a higher development priority. For
example, geodetic control and base-map layers should be developed first because
most other layers depend on them.
Data conversion includes capturing both the graphic (geometry and coordinates
of features) and nongraphic (attributes) data. Graphic and nongraphic data may be
entered simultaneously or separately.
Capturing Attributes
The annotations (labels) shown on the source map are the most common source
of attributes. The source document ID (e.g., drawing number) is one of the most
important attributes that should always be captured during data conversion. Features
such as valves and hydrants have unique IDs, which can be easily captured from
labels (annotations) on source maps. The features without IDs should be assigned
new IDs during data conversion. Some data conversion application software allow
automatic ID creation during data conversion.
Most source maps show pipe sizes as labels or legends, which can also be easily
captured during data conversion. Geometric properties like length, area, and perim-
eter of features can be internally calculated by GIS and entered as an attribute. For
example, if pipe length is labeled, it can be entered as a Length_Map (source map)
2097_C008.fm Page 148 Monday, December 6, 2004 6:04 PM
Copyright © 2005 by Taylor & Francis
attribute. If pipe length is not shown, it can be automatically calculated by GIS and
entered as Length_GIS (GIS-calculated) attribute.
Additional attributes are collected from other sources such as legacy databases,
tables, and field and GPS surveys. Some existing databases and tables can be linked to
GIS databases to avoid manual entry of attributes. Once the linkage has been established,
attributes from the linked documents are available in the GIS database for query,
analysis, and thematic mapping. For example, unique hydrant IDs captured during data
conversion can be used to link to a hydrant-testing database. Applications that require
locating the facilities by customer address such as work orders and customer complaints
should also capture the address attribute in at least one layer (buildings, parcels, or
meters). GIS attributes can also be found in some unexpected places, such as customer
billing records. With a technique called address geocoding, GIS can convert the billing
records or any postal address to a point on a map. Alternatively, facilities can be located
by customer address using a geocoded streets layer.
Capturing Graphics
The data conversion methodology for capturing graphics depends on database
design, source materials, and project budget. Digitization and scanning are the two
most common data conversion methods.
Digitization
Digitization is a process of converting a paper map into a vector file by a
computer using a digitizer or digitizing table (or tablet). The source map is placed
on the usually backlit surface of the digitizer, and map features are traced using the
digitizer puck that looks like a computer mouse with a crosshair. The source map
should be registered (or calibrated) to control points. Figure 8.4 shows map conver-
sion work using a digitizer. Digitizers cost approximately $10,000. Digitized files,
when properly prepared, are ready for immediate use in a GIS.
Conventional table digitization is a laborious process. New “heads-up” or “on-
screen” digitization is a less cumbersome alternative in which the visible features from
scanned maps, digital aerial photos, or satellite imagery can be traced with a standard
computer mouse on the computer monitor. If a digitizer is not available but a scanner
is, data conversion can be done by scanning the source maps followed by heads-up
digitization. The use of this process for certain specialized mapping projects, such as
land-use/land-cover mapping, requires familiarity with photo interpretation techniques.
For easy identification, certain utility assets that are difficult to see on the aerial
photographs (e.g., valves, hydrants, manholes) can be premarked. Premarking is done
by placing (or painting) targets with special symbols and colors over or adjacent to
the asset to be captured. Premarking cost is usually $2 to $10 per target.
As-built or construction drawings usually have dimensional or offset information
on utility assets (e.g., a sewer pipe 10 ft from the street right-of-way). This information
can be used to position the utility assets using the automated drafting capabilities of
modern GIS packages. This method is more accurate than digitization (Cannistra,
1999).
2097_C008.fm Page 149 Monday, December 6, 2004 6:04 PM
Copyright © 2005 by Taylor & Francis
Scanning
Scanning is a process of converting a paper map into a raster file (or image) by
a computer using a map-size scanner. Black-and-white scanners are most common
because they cost about the same as a digitizer. Color scanners cost twice as much.
Figure 8.5 shows map-conversion work using a scanner. Scanning is generally most
efficient when converting maps for archival purposes. Sometimes, as-built drawings
are scanned and linked to vector features. Because many applications (e.g., hydraulic
modeling and field inspections) require the utility features in vector format, scanned
images must be converted to a vector format. This can be done by heads-up digitization
of the scanned maps or by using a process called
vectorization
that automatically
converts the raster data to vector format. Vectorization is a cost-effective data conver-
sion method but it is based on new technology that is still improving. Vectorization
may not always produce reliable results, especially in the unsupervised (unmanned)
mode. Linework and symbols vectorize better than annotations. Complex, faded, or
unclear maps may require extensive postprocessing and manual touch-up.
Data Conversion Software
Data conversion requires GIS development software that draws objects as points,
lines, or polygons or represents them as pixels. ESRI’s ArcGIS
®
and Intergraph’s
GeoMedia Pro
®
are examples of GIS development software (Shamsi, 2002). For
large projects, data conversion application programs are very useful. These programs
Figure 8.4
Data conversion using digitization.
2097_C008.fm Page 150 Monday, December 6, 2004 6:04 PM
Copyright © 2005 by Taylor & Francis
are usually developed as extensions to standard GIS packages to supplement specific
mapping needs. For example, ESRI’s ArcFM water data model supports water and
sewer system mapping in a geodatabase. Chester Engineers’ (Pittsburgh, Pennsyl-
vania) water editing tool is an application that allows user-friendly mapping of water
and sewer systems for ESRI software users. It eliminates attribute entry and editing
via command prompts or database tables, which require data conversion skills. Users
without prior data conversion experience can enter attributes from sources documents
(e.g., as-built drawings) in a menu environment simply by clicking on points (e.g.,
manholes) and lines (e.g., sewers). The water editing tool was developed in several
Figure 8.5
Data conversion using scanning.
2097_C008.fm Page 151 Monday, December 6, 2004 6:04 PM
Copyright © 2005 by Taylor & Francis
versions for different users. The ArcView version was developed using Avenue and
ESRI’s Dialog Designer Extension to support water system and sewer system map-
ping needs of the ArcView 3.x users. The ArcInfo 7.x version was written in Arc
Macro Language (AML) to support water system and sewer system mapping in an
Arcedit session. The latest ArcMap version that adds a new water editing toolbar in
ArcMap was developed using Visual Basic for Applications (VBA) for ArcGIS users.
Figure 8.6 shows a screenshot of the ArcMap version of the water editing tool. The
right window shows the form for adding and editing point and line features. The
left window shows the form for editing point attributes.
Data conversion is started by drawing and attributing the points. After the points
are attributed, the connecting lines are added from point to point. The application
prompts the user to select the upstream and the downstream points. After both are
selected, the line is added to the data set. By selecting upstream and downstream
manholes to add the lines, the flow direction of a gravity sewer is incorporated into
the data set, ensuring the proper connectivity of the system. Additionally, the lines
are snapped to the point features, ensuring that the points of connection correspond
to manholes.
Data conversion applications like the water editing tool increase the speed,
efficiency, and accuracy of data conversion for water, wastewater, and stormwater
systems. They reduce data-entry errors and can even be used to validate the input
data. If desired, the applications can be modified to meet the project-specific mapping
requirements.
Figure 8.6
Sample water system data conversion application for ArcMap.
2097_C008.fm Page 152 Monday, December 6, 2004 6:04 PM
Copyright © 2005 by Taylor & Francis
Data Processing
Data processing includes some or all of the following tasks:
1. Data preparation
2. Topological structuring
3. Data management
4. Quality control
Data Preparation
This task makes the raw data from source maps or field/GPS surveys available
for GIS use or GIS-ready. Typical activities include postprocessing of capture data,
changing data formats (e.g., from DXF to Shapefile), applying map projections,
georeferencing the image data, and/or clipping or mosaicking the aerial photos.
Postprocessing of captured data is warranted if the source maps and the base
map have different accuracy, and captured data do not align with the base map. In
this case, captured data is edited (moved, stretched, or resized) to fit the base map.
GIS data are stored in various file formats. The number of data formats has
increased exponentially with the growth in the GIS industry (Goodchild, 2002).
According to some estimates, there might be more than 80 proprietary geographic
data formats (Lowe, 2002b). Why are there so many geographic data formats? One
reason is that a single format is not appropriate for all applications. For example, a
single format cannot support both fast rendering in a command and control system
and sophisticated hydraulic analysis in a water distribution system. Different data
formats have evolved in response to diverse user requirements.
GIS software cannot read all the data formats simply because there are so many
formats. Disparate data formats should be converted to one of the formats compatible
with a particular GIS software. Although many GIS packages provide data conver-
sion for the most common data formats, no GIS can support all possible conversions.
Many government agencies and data and software companies provide data translators
for this purpose (Shamsi, 2002).
Data translation from one format to another can potentially lead to the loss or
alteration of data. For instance some platforms can support better numeric precision
than others. Depending on the mapping scale and the coordinate system, this could
seriously affect data quality. In one system, curves representing a water main might
be defined mathematically, but in another described as a series of straight line
segments.
Topological Structuring
How much topology should be captured in a GIS map depends on the intended
applications of the map. For example, in a sewer system modeling application,
correct topology (e.g., flow direction) is generally more important than the correct
pipe location on the street (e.g., left, right or center of the street). As much topology
as possible should be captured during data conversion. For example, flow direction
2097_C008.fm Page 153 Monday, December 6, 2004 6:04 PM
Copyright © 2005 by Taylor & Francis
should be captured if flow direction arrows are shown on source maps. Flow direction
can be automatically captured if sewer pipes are digitized from upstream to down-
stream direction. In ArcInfo 7.x “coverage” model, the topology of an arc includes
its upstream and downstream nodes (fnode, tnode). ArcInfo 7.x performs computa-
tionally intensive topological relationship calculations up front and stores that infor-
mation as attributes (fnode, tnode). These attributes are used to determine flow
direction of arcs. If source maps do not have topological relationships or if the data
conversion technicians are not adequately skilled to understand them, topology can
be added after the data conversion by knowledgeable staff. For example, in a water
distribution system mapping project, valves and hydrants are logically linked to their
appropriate pipe segments by the people who are knowledgeable about system
characteristics (Cannistra, 1999).
Conventional GIS packages, such as ArcInfo 7.x and ArcCAD, provide the legacy
BUILD
and
CLEAN
commands to build topology and eliminate topological digitizing
errors such as undershoots and overshoots. As shown in Figure 8.7, an undershoot
occurs when a line stops short of an intended intersection point and an overshoot
occurs when a line extends past an intended intersection point. Traditionally, these
“cleaning” operations were done after the data conversion step. Today’s modern GIS
packages allow enforcing the topological rules (spatial constraints) during data
conversion and editing. Thus, when a manhole is moved, the topological rules ensure
that the sewers connected to that manhole move simultaneously. For example,
ArcInfo 8.3 provides new tools to define, validate, and maintain topology in a
geodatabase. Users define which layers participate in a topology and which rules
are appropriate. Topology is stored in a commercial off-the-shelf DBMS.
Data Management
This step organizes attribute data in a database management system (DBMS)
format. A GIS database, though not as visible as a GIS map, is an equally critical GIS
component. The most difficult job in creating a GIS is the enormous effort required
to enter the large amount of data and to ensure both its accuracy and proper mainte-
nance (Walski and Male, 2000). Conventional file-based GIS databases (e.g.,
ArcInfo 7.x) store geographic data in vendor-specific proprietary format files. Attribute
Figure 8.7
Common digitizing errors: undershoot (left) and overshoot (right).
2097_C008.fm Page 154 Monday, December 6, 2004 6:04 PM
Copyright © 2005 by Taylor & Francis
data are stored in a separate file, which generally has a common nonproprietary format
(e.g., a .dbf file). The two separate files are linked using pointers. Modern spatial or
object-oriented databases do not require links between features and attributes because
they store both the features and attributes in the same file. Incorporating spatial data
with attribute data in a relational database provides a platform for efficient management
of huge data resources, as well as fast and sophisticated spatial query and retrieval
methods (Dalton, 2001).
Quality Control
A comprehensive and well-defined quality assurance/quality control (QA/QC)
program should be implemented for large data conversion projects. Data conversion
QA/QC can be ensured by checking data completeness, content, symbology, format,
structure, and compliance with database specifications during data production. Posi-
tional accuracy can be checked using field trips, survey, GPS, photographs, and
video tapes (Cannistra, 1999).
QA/AC can employ both manual checks and automatic methods. For example,
the water editing application shown in Figure 8.6 provides an automatic QA/QC
capability. It displays the points that are completely defined using a white box. Points
that have missing attributes are displayed as a box with an X through it. Points that
are added from source drawings are shown as a green box with an X through it.
After each point is defined, the list of attributes for each point is displayed on the
screen, allowing the user to double-check the attributes entered for each point.
Data-entry QA/QC can be accomplished by restricting the user input to valid
data ranges and rejecting the data entries outside the valid ranges. This capability
generally requires development of custom data-entry forms using computer pro-
gramming.
Map Production
The previous steps enable display of GIS layers on the computer screen. The
map production step allows plotting of GIS data on paper and other print media. It
includes creation of thematic maps using appropriate symbols, colors, patterns, and
legends. For example, water main sizes are shown by different line widths, pressure
zones by different colors, and valve types by different symbols. Map production
also involves printing the scale bar, north arrow, and organization logo. Sometimes
tables, charts, and photographs are also inserted. Every map should have a title.
Other information such as filename, map number, project name and number, plot
date, mapmaker, and map source should also be printed on each important map.
This last step is important because it shows the final result of all the previous
steps. Plotting of GIS maps in the correct style, orientation, scale, size, and format
is a time-consuming process. Plotter speed and network speed are often the main
bottlenecks. Templates for symbology, legends, and layouts should be developed in-
house or obtained from other organizations to expedite map production. Some
vendors package templates and symbol libraries specific to water, wastewater, and
stormwater system with their software products.
2097_C008.fm Page 155 Monday, December 6, 2004 6:04 PM
Copyright © 2005 by Taylor & Francis
Maps are needed for map books, wall mounting, archives, presentations, reports,
etc. The purpose of the map and the target audience should be considered to design
an appropriate map layout. For example, a map for an engineering application should
be plotted differently from a map for a water utility newsletter. This step also includes
distribution of the maps to the staff of an organization and optionally to the general
public using the Internet, intranet, or wireless technology.
CASE STUDIES
Borough of Ramsey, New Jersey
The Ramsey Board of Public Works is responsible for the operation and maintenance
of water distribution and sanitary sewer collection systems throughout the Borough of
Ramsey, New Jersey. In an effort to more efficiently manage its geographically refer-
enced data, the board started to explore the benefits and applications of GIS technology
and computer mapping in early 1993. As a first step, with the assistance of Chester
Engineers, Inc. (Pittsburgh, Pennsylvania), the board completed a needs analysis and a
GIS pilot project described in Chapter 2 (Shamsi et al., 1995; Shamsi et al., 1996). The
Borough did not have any complete large-scale mapping resources suitable for utility
asset location. System design recommended the following mapping specifications:
• A new digital orthophoto base map should be developed accurate to the tolerances
normally associated with mapping at a scale of 1 in. = 50 ft.
• Orthophoto base mapping should be established on the New Jersey State Plane
Coordinate System. Survey monuments should be established to enable subse-
quent mapping efforts to be tied to the basemap coordinate system.
• Lot and block boundaries should be included as a unique layer in the base map.
• Additional map layers for the water distribution system, the sanitary sewer col-
lection system, the stormwater collection system, and census geography should
be developed to support other needs of the Borough.
• Use GPS to verify the locations of valves, hydrants, and manholes.
Table 8.2 summarizes the required map layers and the features depicted in each
layer. Table 8.3 presents the data dictionary for Ramsey’s pilot project.
Table 8.2
Map Layers and Depicted Features
Layer Features
New Jersey State Plane Grid System Grid tics, survey monuments
Photogrammetric base map Building outlines, street outlines and centerlines,
vegetation, water courses, topography
Parcels Lot and block boundaries
Water distribution system Mains, valves, hydrants
Sanitary sewer collection system Sanitary sewers, manholes, cleanouts
Stormwater collection system Storm sewers, manholes, catch basins
Census geography Blocks, block groups, tracts
2097_C008.fm Page 156 Monday, December 6, 2004 6:04 PM
Copyright © 2005 by Taylor & Francis
All of the borough’s sewer system data were stored in a nondigital form. This
information was manually entered into the GIS database. Map features and attribute
information were gleaned from a variety of sources. Table 8.4 lists recommended
sources for specific map features and attributes. After reviewing the Borough’s
available maps and considering the mapping requirements of the priority applica-
tions, the use of digitization was recommended for data conversion.
ESRI’s ArcInfo (Version 6) and ArcView (Version 2) software products were the
two main software programs used in this project. Because the Borough did not have
the technical staff to maintain an ArcInfo GIS, data conversion work was done by
the consultant using ArcInfo. Due to its low cost, ease of use, and compatibility
Table 8.3
Data Dictionary
Feature Type Required Attributes
Water mains Segment ID
Pipe material
Pipe size
Repair date(s)
Repair type(s)
Water valves Valve ID
Installation date
Type
Date last cycled
Normal position
Fire hydrants Hydrant ID
Associated valves
Type
Installation date
Flow data
Preferred status
Sewers Sewer ID
Pipe material
Pipe size
From manhole ID
To manhole ID
Manholes Manhole ID
Manhole type
Lid type
Depth
Inflow problem status
Catch basins Catch basin ID
Table 8.4
Source Documents for Map Features and Attributes
Types of
Features
Source Documents
Base Map Utility Markouts
Water System
as Built, 1970,
1:50-Scale
Sewer System
as Built, 1970,
1:100-Scale
Water mains
Fire hydrants
Water valves
Sewer pipes
Manholes
Catch basins
2097_C008.fm Page 157 Monday, December 6, 2004 6:04 PM
Copyright © 2005 by Taylor & Francis
with the ArcInfo file format, ArcView was installed in the Borough for routine
display and plotting of maps and querying the GIS database.
Figure 8.1 shows the Ramsey digital orthophoto base map with an accuracy of
± 1.25 ft. The figure on the first page of this chapter shows a map of sanitary sewers
and manholes overlayed on the parcel and buildings layers. The sewer features were
taken from as-built drawings and adjusted to locations of surface features that were
field verified. Figure 8.8 shows a water system map with water mains, hydrants, and
valves overlayed on the parcel and buildings layers. Water mains have been classified
by the diameter attribute of the water main layer.
City of Lake Elsinore, California
Elsinore Valley Municipal Water District located in the city of Lake Elsinore,
CA, provides water, wastewater, and agricultural services to approximately 25,000
customers. It maintains an infrastructure consisting of 305 mi of water mains, 290 mi
of sewer pipes, and 246 mi of irrigation pipelines. An ESRI software user since
1992, the District migrated to ESRI’s new ArcGIS geodatabase platform in 2000.
The migration data conversion work, which included 5000 as-built drawings and
300 atlas pages, was completed in 8 months. The source documents were scanned
and linked to GIS features. The system has 35 users and employs SQL Server 7
relational database management system software, Gateway 7400 and XI NetRAIDer
dual 800 MHz servers, and Pentium III workstations. The system maintains approx-
imately 75,000 maps in an enterprise GIS environment. GIS allows operations
Figure 8.8 Water distribution system map showing pipes classified by diameter.
2097_C008.fm Page 158 Monday, December 6, 2004 6:04 PM
Copyright © 2005 by Taylor & Francis
personnel to create atlas maps and perform asset maintenance, a customer service
department to analyze meter-reading routes and identify illegal connections, and an
engineering department to generate as-built construction drawings (ESRI, 2002a).
Allegheny County, Pennsylvania
Each year, sewage overflows affect Pittsburgh’s rivers up to 70 days during the
boating season, making water unacceptable for recreational contact. In addition, the
overflows affect Allegheny County’s primary source of drinking water. Municipal-
ities in the region could face a potential $2-billion investment in order to correct the
problem. In 2003, the U.S. Environmental Protection Agency (USEPA) issued
administrative consent orders to 83 municipalities of Allegheny County for control-
ling the sewage overflows. The orders required communities to address the sewage
overflow issue through mapping, cleaning, and televising the system, and flow
monitoring. This information will help communities develop a long-term wet-
weather control plan. The orders required the following GIS mapping requirements:
• Create an ESRI-compatible base map that includes streets, street names, municipal
boundaries, and streams.
• Create an updated ESRI-compatible comprehensive sewer map of the sanitary
sewers with the following content:
• Location of the sewer lines
• Direction of flow
• Size of the sewer lines
• Sewer line material
• Locations of interconnections with other municipal sewer systems
• Field-verified location of manholes and catch basins (identified by a compre-
hensive numbering or lettering system)
• Location of pump stations, force mains, and siphons
• Location of streams or drainage ways tributary to the sewers
• Location of overflow (combined sewer overflow [CSO] and sanitary sewer
overflow [SSO]) structures
• Locate all significant structures to a minimum horizontal accuracy of 3 ft.
• Use as-built drawings, GPS, or traditional land surveying methods to determine
structure locations.
• Use State Plane Pennsylvania South NAD83 projection system for coordinates
and NAVD88 datum for elevations.
• Manhole inverts and rim elevations to a minimum vertical accuracy of 0.10 ft for
overflow structures, sewers with greater than 10-in. diameters, and other critical
sewers.
• Incorporate field inspection data into comprehensive sewer maps.
USEFUL WEB SITES
Geospatial Information and
Technology Association (GITA)
www.gita.org
USGS GIS Maps for Water Resources water.usgs.gov/maps.html
USEPA GIS Information www.epa.gov/epahome/gis.htm
2097_C008.fm Page 159 Monday, December 6, 2004 6:04 PM
Copyright © 2005 by Taylor & Francis
CHAPTER SUMMARY
GIS provides powerful capabilities for creating cost-effective and intelligent
maps for water, wastewater, and stormwater systems. The quality of maps depends
on data quality, errors, accuracy, scale, and resolution. GIS maps can be developed
in many different ways. A mapping approach that best meets the application needs
of an organization should be selected. GIS mapping requires five steps: needs
analysis, data collection, data conversion, data processing, and map production.
Needs analysis and pilot project testing is highly recommended, as explained in
Chapter 2 (Needs Analysis). Data conversion is the most time-consuming and costly
part of mapping projects and should be performed carefully. Data conversion appli-
cation software can be used to reduce data conversion cost. Digitization and scanning
are the two popular methods of data conversion but users can benefit from innovative
variations of these methods. GIS maps should always be constructed in reference
to a base map that has the required accuracy and resolution to support the intended
applications of GIS maps.
CHAPTER QUESTIONS
1. What are the different types of maps?
2. What are the different types of base maps and their characteristics?
3. How is a GIS map different from a CAD drawing?
4. What is the relationship between map accuracy, scale, and resolution?
5. What are the various steps for making GIS maps? Which step is most critical and
why?
6. What is data conversion and how is it done?
7. What is topology, and how does it affect GIS maps?
8. Identify a GIS application in your organization and recommend the appropriate
mapping layers and source documents to implement that application.
2097_C008.fm Page 160 Monday, December 6, 2004 6:04 PM
Copyright © 2005 by Taylor & Francis