GIS Applications for Water, Wastewater, and Stormwater Systems - Chapter 10 pps
Bạn đang xem bản rút gọn của tài liệu. Xem và tải ngay bản đầy đủ của tài liệu tại đây (4.14 MB, 15 trang )
CHAPTER
10
Monitoring Applications
GIS is ideally suited to install, maintain, and query monitoring
equipment such as, rain gauges, flow meters, and water quality
samplers for system physical and hydraulic characterization. GIS
allows display and analysis of monitoring data simply by clicking on
a map of monitoring sites.
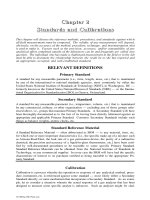
Gauging and inspection stations in the city of Los Angeles, California.
2097_C010.fm Page 177 Monday, December 6, 2004 6:06 PM
Copyright © 2005 by Taylor & Francis
LEARNING OBJECTIVE
The learning objective of this chapter is to familiarize ourselves with GIS applications
in monitoring data for effective operation and management of water, wastewater,
and stormwater systems.
MAJOR TOPICS
• Rainfall monitoring
• Satellite and radar rainfall data
• Flow-monitoring applications
• Permit reporting applications
• Internet monitoring applications
• Infrastructure monitoring applications
LIST OF CHAPTER ACRONYMS
CCTV
Closed Circuit Television
GML
Geography Markup Language
HRAP
Hydrologic Rainfall Analysis Project (a map projection system)
NCDC
National Climatic Data Center (U.S.)
NEXRAD
Next Generation Weather Radar
NOAA
National Oceanic and Atmospheric Administration (U.S.)
NPDES
National Pollution Discharge Elimination System (U.S.)
NWS
National Weather Service
OGC
Open GIS Consortium
SCADA
Supervisory Control and Data Acquisition Systems
WSR
Weather Surveillance Radar
This book focuses on the four main applications of GIS, which are mapping, monitor-
ing, modeling, and maintenance and are referred to as the “4M applications.” In this chapter
we will learn about the applications of the second
M
(monitoring).
MONITORING REAL TIME RAINFALL AND STREAM-FLOW
DATA IN AURORA
The city of Aurora, Colorado, is a community of approximately 247,000 people
located in the southeast Denver metro area. The City’s Utilities Department used
ESRI’s ArcInfo and ArcView software to analyze and display real time rain-gauge and
stream-flow data from the City’s ALERT Flood Warning System. Data were obtained
by querying a remote real time data-collection database. The Utilities Department was
able to access and analyze both historical and current real time rainfall and stream-
flow data from an easy-to-use graphical interface. ArcView’s Spatial Analyst Extension
was used to develop a continuous areal rainfall surface from the point rainfall data.
This allowed a better and clearer understanding of a particular storm and allowed a
2097_C010.fm Page 178 Monday, December 6, 2004 6:06 PM
Copyright © 2005 by Taylor & Francis
more complex analysis of the true impact of the storm event. Applications of this
program included studies in emergency flood response, location of flood reports,
routine maintenance for storm sewers, and National Pollution Discharge Elimination
System (NPDES) compliance for water quality (Rindahl, 1996).
MONITORING BASICS
Monitoring of various types of data is essential to the effective management of
water, wastewater, and stormwater systems. Generally, two types of data are required:
(1) physical characterization data and (2) hydraulic characterization data. Physical
characterization data describe the physical condition of the infrastructure, such as
pipe and manhole conditions. Examples of physical characterization data sources
include closed-circuit television (CCTV) inspection of pipes, manhole inspections,
and smoke-testing of buildings. GIS applications for these types of data are described
in Chapter 15 (Maintenance Applications).
Hydraulic characterization data describe the quantity and quality of flow through
pipes and open channels as well as meteorological factors impacting the flow, such as
precipitation.
Wastewater and stormwater systems typically require data on flow quantity
(depth, velocity, flow rate, and volume), quality (e.g., suspended solids and bacteria),
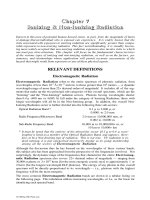
and rainfall. Figure 10.1 shows a flowmeter and weir installation in a combined
sewer system overflow manhole. The flowmeter (Flo-Dar from Marsh-McBirney,
Inc.) shown on the left records incoming combined sewage depth, velocity, and flow
data. The weir shown on the right collects outgoing overflows. Some wastewater
and stormwater hydrologic and hydraulic (H&H) models require data on addi-
tional meteorological parameters such as ambient temperature, evaporation rate,
and wind speed. Water distribution systems typically require water pressure and
water quality data. In many projects, monitoring tasks make up a significant portion
of the scope of work and could cost 20 to 30% of the total budget. Careful installation
of monitors and effective management of monitoring data is, therefore, highly
desirable for the on-time and on-budget completion of monitoring projects.
GIS is ideally suited for selecting the best sites for installing various hydraulic
characterization monitors. Once the monitors have been installed, GIS can be used
to query the monitored data simply by clicking on a map of monitoring sites. GIS
can also be used to study the spatial trends in the monitored data. GIS is especially
useful in processing and integrating radar rainfall data with H&H models of sewage
collection systems and watersheds. This chapter will present the methods and exam-
ples of how to use GIS for installing and maintaining the monitors, and for querying
and analyzing the monitoring data.
REMOTELY SENSED RAINFALL DATA
Many watersheds, especially those smaller than 1000 km
2
, do not have recording
rain gauges capable of recording at hourly or subhourly intervals. Sometimes rain
gauges exist, but data are found missing due to equipment malfunction. Quite often,
2097_C010.fm Page 179 Monday, December 6, 2004 6:06 PM
Copyright © 2005 by Taylor & Francis
rain-gauge density is not adequate to accurately capture the spatial distribution of
storm events. Such data gaps can be filled by the rainfall data provided by weather
satellites and radars, as described in the following subsections.
Satellite Rainfall Data
Direct measurement of rainfall from satellites is not feasible because satellites
cannot penetrate the cloud cover. However, improved analysis of rainfall can be
achieved by combining satellite and conventional rain-gauge data. Meteorological
satellites such as the NOAA-N series, those of the Defense Meteorological Satellite
Program, and U.S. geostationary satellites can observe the characteristics of clouds
with precipitation-producing potential and the rates of changes in cloud area and
shape. Rainfall data can now be estimated by relating these cloud characteristics to
instantaneous rainfall rates and cumulative rainfall over time. Cloud area and tem-
perature can be used to develop a temperature-weighted cloud cover index. This
index can be transformed to estimate mean monthly runoff values. Satellite rainfall
estimating methods are especially valuable when few or no rain gauges are available
(ASCE, 1999).
Figure 10.1
Flowmeter and weir installation in a manhole for monitoring incoming and out-
going flows.
2097_C010.fm Page 180 Monday, December 6, 2004 6:06 PM
Copyright © 2005 by Taylor & Francis
Radar Rainfall Data
Weather radars provide quantitative estimates of precipitation, which can be used
as input to H&H models. Radar rainfall estimates augmented with data from sparse
rain-gauge networks are useful in H&H modeling. Weather radars provide real time,
spatially distributed rainfall data that can be extremely valuable for flood forecasting
and flood warning.
NEXRAD Rainfall Data
The U.S. National Weather Service (NWS) has a group of weather radars called
the Next Generation Weather Radar (NEXRAD) system. NEXRAD comprises
approximately 160 Weather Surveillance Radar–1988 Doppler (WSR-88D) sites
throughout the U.S. and selected overseas locations. This system is a joint effort of
the U.S. Departments of Commerce (DOC), Defense (DOD), and Transportation
(DOT). The controlling agencies are the NWS, Air Weather Service (AWS), and
Federal Aviation Administration (FAA), respectively. Level II data provide three
meteorological base data quantities: reflectivity, mean radial velocity, and spectrum
width. These quantities are processed to generate numerous meteorological analysis
products known as Level III data. Level II data are recorded at all NWS and most
AWS and FAA WSR-88D sites. Level III products are recorded at the 120 NWS
sites. The data are sent to the National Climatic Data Center (NCDC) for archiving
and dissemination.
NEXRAD Level III Data
There are a total of 24 Level III products routinely available from NCDC,
including 7 graphic products in clear-air mode, 11 in precipitation mode, 5 graphic
overlays, and 1 alphanumeric product. Each product includes state, county, and city
background maps. Level III graphic products are available as color hard copy,
grayscale hard copy, or acetate overlay copies. A brief description and possible uses
of these products are given below:
• Base Reflectivity (R): A display of echo intensity measured in dBZ (decibels of
Z, where Z represents the energy reflected back to the radar). This product is used
to detect precipitation, evaluate storm structure, locate boundaries, and determine
hail potential.
• Base Spectrum Width (SW): A measure of velocity dispersion within the radar
sample volume. The primary use of this product is to estimate the turbulence
associated with mesocyclones and boundaries.
• Base Velocity (V): A measure of the radial component of the wind either toward
the radar (negative values) or away from the radar (positive values). Negative
values are represented by cool colors (green), whereas positive values are repre-
sented by warm colors (red). This product is used to estimate wind speed and
direction, locate boundaries, locate severe weather signatures, and identify sus-
pected areas of turbulence.
2097_C010.fm Page 181 Monday, December 6, 2004 6:06 PM
Copyright © 2005 by Taylor & Francis
• Composite Reflectivity (CR): A display of maximum reflectivity for the total
volume within the range of the radar. This product is used to reveal the highest
reflectivities in all echoes, examine storm structure features, and determine the
intensity of storms.
• Echo Tops (ET): An image of the echo top heights color-coded in user-defined
increments. This product is used for a quick estimation of the most intense
convection and higher echo tops, as an aid in identification of storm structure
features, and for pilot briefing purposes.
• Hail Index Overlay (HI): A product designed to locate storms that have the
potential to produce hail. Hail potential is labeled as either probable (hollow green
triangle) or positive (filled green triangle). Probable means the storm is probably
producing hail and positive means the storm is producing hail.
• Mesocyclone Overlay (M): This product is designed to display information regard-
ing the existence and nature of rotations associated with thunderstorms. Numerical
output includes azimuth, range, and height of the mesocyclone.
• One-Hour Precipitation (OHP): A map of estimated 1-h precipitation accumu-
lation on a 1.1 nmi
×
1.1 nmi grid. This product is used to assess rainfall
intensities for flash flood warnings, urban flood statements, and special weather
statements.
• Severe Weather Probability Overlay (SWP): A measure of a storm’s relative
severity as compared with those around it. The values are directly related to the
horizontal extent of vertically integrated liquid (VIL) values greater than a
specified threshold. This product is used for quick identification of the strongest
storms.
• Storm Structure (SS) (alphanumeric product): A table displaying information on
storm attributes that include maximum reflectivity, maximum velocity at lowest
elevation angle, storm overhang, mass-weighted storm volume, storm area base
and top, storm position, and storm tilt.
• Storm Total Precipitation (STP): A map of estimated storm total-precipitation
accumulation continuously updated since the last 1-h break over the entire scope.
This product is used to locate flood potential over urban or rural areas, estimate
total basin runoff, and provide rainfall data 24 h a day.
• Storm Tracking Information Overlay (STI): A product that shows a plot of the
past hour’s movement, current location, and forecast movement for the next hour
or less for each identified thunderstorm cell. This product is used to determine
reliable storm movement.
• Tornadic Vortex Signature Overlay (TVS): A product that shows an intense gate-
to-gate azimuthal shear associated with tornadic-scale rotation. It is depicted by
a red triangle with numerical output of location and height.
• VAD Wind Profile (VWP): A graphic display of wind barbs plotted on a height
staff in 500-ft or 1000-ft increments. The current (far right) and up to ten previous
plots may be displayed simultaneously. This product is an excellent tool for
meteorologists in weather forecasting, severe weather, and aviation.
• Vertically Integrated Liquid (VIL): The water content of a 2.2 nmi
×
2.2 nmi
column of air, which is color-coded and plotted on a 124 nmi map. This product
is used as an effective hail indicator to locate most significant storms and to
identify areas of heavy rainfall.
NEXRAD data and various visualization and analysis software tools are
available from NCDC and commercial vendors.
2097_C010.fm Page 182 Monday, December 6, 2004 6:06 PM
Copyright © 2005 by Taylor & Francis
Estimating Rainfall Using GIS
Because rainfall is a critical component in conducting H&H analyses, the
quality of rainfall data is critical for accurate system hydraulic characterization.
It is often the case that the spatial distribution of rain-gauges over a collection
system is too sparse to accurately estimate the rainfall over a given basin. Radar
rainfall technology can be used to obtain high-resolution rainfall data over an
approximately 2 km
×
2 km area (called a pixel). GIS can be used to display and
process the radar rainfall data.
NEXRAD Level III data from Doppler radar measurements provide spatially
dense rainfall data. These data are similar to those commonly seen on weather maps.
Such data do not require interpolation between point data from widely scattered rain-
gauges because they provide continuous rainfall measurements throughout a watershed
or sewershed (Slawecki et al., 2001).
WRS-88D radar images have a mean resolution of 4 km
×
4 km. They are
registered to the Hydrologic Rainfall Analysis Project (HRAP) map projection sys-
tem. The radar rainfall data can be incorporated in a GIS-based distributed hydrologic
model by importing it in a raster grid format. However, this may require reprojecting
the rainfall grid from the HRAP coordinate system to the coordinate system being
used by the model.
The accuracy of radar rainfall estimates can be improved substantially by cali-
brating the radars using the point rain-gauge observations. Generating NEXRAD
rainfall estimates requires extensive expertise and computational resources (ASCE,
1999). Hourly NEXRAD rainfall data called hourly digital precipitation array (DPA)
are available from several NWS-authorized commercial data vendors, such as WSI
Corporation and Paramax Systems Corporation. Weather data vendors such as DTN
Weather Services (now part of Meteorlogix, Inc.) provide continuously updated, real
time, GIS-ready, georeferenced weather data in ESRI GRID (raster) and Shapefile
(vector) formats and georegistered TIFF format to weather-enable the GIS applications
for water and wastewater utilities. The DTN data include 5-min NEXRAD updates and
storm cell type, severity, speed, and direction. Meteorlogix provides weather extensions
for ESRI’s ArcGIS software package. NEXRAIN Corporation (Orangevale, Califor-
nia) provides georeferenced polygon Shapefiles of radar pixels over a given study
area. Each radar pixel is given a unique ID field, which can be used to visualize and
analyze rainfall data from a separate text or database file. Shapefiles are projected
into the user-specified coordinate system. NEXRAIN-2k product is extracted from
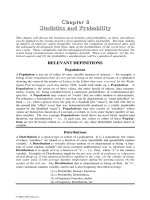
a national mosaicked data set of 2-km radar data, updated every 15 min. Figure 10.2
shows a Shapefile of the NEXRAIN-2k radar pixels in Colorado State Plane Central
(NAD83 ft) over Colorado Springs, Colorado, for a storm event on August 31, 2001.
The top-left window shows rainfall distribution at 2 A.M.; the top-right window
shows rainfall distribution at 5 P.M.; the bottom-left window shows rainfall distri-
bution at 8 P.M.; the bottom-right window shows the attribute table; the top-center
window shows the results of a pixel query; and the bottom-center insert shows a
rainfall map overlaid on a street map.
WSI Corporation, a supplier of weather data in the U.S., provides the WSI
PRECIP
data over these pixels in 15-min time increments. These data can be obtained
2097_C010.fm Page 183 Monday, December 6, 2004 6:06 PM
Copyright © 2005 by Taylor & Francis
through commercial vendors and adjusted to reliable ground gauges, if necessary.
Hence, the radar rainfall volume adjusted through calibration with ground gauge,
combined with high-resolution spatial distribution, provides modelers with a very
accurate local estimate of rainfall. These estimates can be used with their flowme-
tering to characterize the basin of interest (Hamid and Nelson, 2001).
Radar Rainfall Application: Virtual Rain-Gauge Case Study
Precipitation varies with time and across a watershed. GIS can easily create a
rainfall contour map from point rainfall values. Unfortunately, point rainfall values
are generally scarce due to inadequate rain-gauge density. Many watersheds have
few or no rain gauges to accurately measure the spatial rainfall distribution. In this
case, a hydrologist may have to use the precipitation data from a nearby watershed.
Many watersheds do not have recording-type rain gauges to measure the hourly
variation of precipitation. In this case, a hydrologist may need to apply the temporal
distribution of a nearby watershed. The recent availability of radar precipitation data
via the Internet eliminates these problems by providing subhourly precipitation data
anywhere in the watershed.
Three Rivers Wet Weather Demonstration Program (3RWWDP) is a nonprofit
organization located in Pittsburgh, Pennsylvania. It was created in 1998 to help
Allegheny County (Pennsylvania) municipalities address the region’s aging and dete-
riorating sewer infrastructure to meet the requirements of the federal Clean Water Act.
Figure 10.2
Shapefile of the NEXRAIN-2k radar pixels for Colorado Springs, CO, on August
31, 2001. Top left: rainfall at 2 A.M.; top right: rainfall at 5 P.M.; bottom left: rainfall
at 8 P.M.; bottom right: attribute table; top center: pixel query window; bottom
center: rainfall overlaid on street map.
2097_C010.fm Page 184 Monday, December 6, 2004 6:06 PM
Copyright © 2005 by Taylor & Francis
Funded by federal grants and local matching funds, 3RWWDP strives to assist com-
munities through education, financial grants, and outreach efforts. In 1999, 3RWWDP
developed an Internet-based precipitation atlas for Allegheny County. The atlas con-
sisted of clickable maps that provided 15-min precipitation data every 1 km
2
from
the CALAMAR system. CALAMAR is a software and NEXRAD radar service
package that integrates high-resolution radar data with precipitation measurements
collected from a network of 21 rain-gauges to produce accurate, dependable precip-
itation maps. Each 1 km
×
1 km pixel of the rainfall atlas is equivalent to a virtual
rain-gauge. The users can click on any of the 2276 pixels to retrieve the 15-min
rainfall data in HTML or spreadsheet (Excel) format. This is equivalent to having
2276 virtual rain gauges in the County. This powerful tool revolutionizes collection
system planning, modeling, and management by providing the critical missing link
in urban hydrology — accurate local precipitation data. The rainfall atlas for a water-
shed near the city of Pittsburgh is shown in Figure 10.3. The figure also shows the
clickable pixel cells and retrieved 15-min-interval rainfall data for November 2000
for one pixel.
Vieux & Associates (Norman, Oklahoma) provides basin-averaged radar hyeto-
graphs at user-defined time increments (5, 15, 30, 60 min, or daily). Spatial resolu-
tions smaller than 1 km with data precision at 256 levels can be achieved. A real
time archive provides access to the radar rainfall estimates. Data are provided in
Figure 10.3
Radar-based virtual rain-gauge map and retrieved rainfall data.
2097_C010.fm Page 185 Monday, December 6, 2004 6:06 PM
Copyright © 2005 by Taylor & Francis
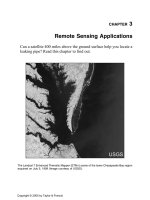
GIS-ready (Shapefile) and hydrologic-model-ready formats. Figure 10.4 shows a
sample image from the RainVieux Web site tailored for 3RWDDP. It provides historic
and real time radar rainfall measurements that can be queried from a Web site. Radar
and rain-gauge measurements are used for cost-effective design of sewer rehabili-
tation projects in the Pittsburgh Metro area.
Mandated by an EPA consent decree, Miami-Dade Water and Sewer Department
(MDWASD), which operates a 317-MGD wastewater treatment plant, implemented
a hydraulic computer model to reduce sanitary sewer overflows (SSOs). In order to
provide rainfall input to the computer model, MDWASD implemented a virtual rain-
gauge system similar to 3RWWDP. A grid-system GIS coverage was created, which
yielded 256 virtual rain gauges of 2 km
×
2 km size each. The rainfall data are
captured every 15 min and downloaded to a database. The grid is joined with the
rainfall database, which allows quantification of impacts of individual rainfall events
on specific regions within the system. This approach improves the accuracy of
modeled flow estimates that are used to design appropriate SSO control measures
(Day, 1998).
Figure 10.4
RainVieux radar rainfall data for Pittsburgh.
2097_C010.fm Page 186 Monday, December 6, 2004 6:06 PM
Copyright © 2005 by Taylor & Francis
FLOW-MONITORING APPLICATIONS
GIS is ideally suited to selecting the best sites for installing flowmeters, water
quality samplers, and rain gauges. The following case study illustrates a GIS appli-
cation for selecting appropriate flow-monitoring sites.
The city of Huntington, WV, has a combined sewer system with 23 combined
sewer overflow (CSO) discharge points permitted under the NPDES program. The
sewer system is operated by the Huntington Sanitary Board (HSB). One of the CSO
requirements specified in the NPDES permit was to monitor each CSO event for cause,
frequency, duration, quantity, and quality of flow. As a first alternative to complying
with this requirement, the feasibility of monitoring all the 23 CSO locations was
studied in 1993. This option required purchase, installation, monitoring, and mainte-
nance of flow monitors, water quality samplers, and rain gauges for each CSO site.
This option was ruled out because of its excessive cost, estimated at over a million
dollars, and other problems such as adverse environmental conditions in the CSO
structures, difficult access issues, and new federal requirements for confined space
entry. The second option consisted of a combination of monitoring and modeling. In
this option, a representative subset of CSOs can be monitored temporarily to collect
sufficient calibration data and develop a calibrated model for each monitored CSO
area. Calibrated model parameters could subsequently be applied to the models of
unmonitored CSO areas. CSO models can eventually be used to predict the quantity
and quality of CSO discharges from observed rainfall data. This option, costing
approximately one third of the first option, was preferred by both the HSB and the
EPA (Region V), and was selected for implementation.
In 1994, ArcView was used to select a representative subset of the 23 CSO sites
to be monitored. Selecting the representative sites is a complex process. The objective
is to maximize the extent and value of the data for use in model calibration and
provide a uniform distribution of flowmeters, samplers, and rain gauges throughout
the system so that all parts of the service area are equally covered. Other factors
such as providing coverage to all land uses, known problem CSO areas, and all types
of diversion chambers, as well as access for installation and maintenance of moni-
toring equipment should be thoroughly studied. Using these selection criteria, a total
of six sites were finally selected for sampling and monitoring. Figure 10.5 presents
an ArcView plot showing the monitored vs. unmonitored CSOs and CSO areas. The
map indicates that by monitoring only 25% of the total number of CSOs, approxi-
mately 70% of the study area was covered.
SCADA Integration
Real time monitoring systems called supervisory control and data acquisition
systems (SCADA) monitor field operations or remote sites for water and wastewater
utilities. Also referred to as telemetry, SCADA is a sophisticated means of monitoring,
reporting, and controlling the operation of modern water and wastewater systems and
treatment plants.
GIS stores the system design and operation data. A link between SCADA and the
GIS database can be established to use the GIS for real time decision making. For
2097_C010.fm Page 187 Monday, December 6, 2004 6:06 PM
Copyright © 2005 by Taylor & Francis
example, real time or near-real time rainfall data can be used in a raster GIS to estimate
the subbasin mean aerial rainfall. Real time subbasin rainfall data can be used to estimate
real time surface runoff, for flood forecasting, or to estimate real time sewer flows to
optimize storage and pumping operations for wet-weather overflow control.
Pidpa is a European company that produces and distributes drinking water to
more than 1.1 million people throughout the Antwerp province in Belgium
(Flanders). Pidpa used ESRI’s ArcIMS technology to create a Web site named
GeoLink as the central application to retrieve GIS data linked to corporate data. In
the GIS viewer of GeoLink, water storage tanks have a hyperlink that opens the
SCADA Web interface. The interface shows the real time water level or 24-hour
history of the water level for the selected tank (Horemans and Reynaert, 2003).
SCADA Connect from Haestad Methods (acquired by Bentley Systems in August
2004) is a commercially available software product for dynamically connecting a wide
range of SCADA systems with Haestad Methods’ WaterCAD, WaterGEMS, and Sewer-
CAD software programs. Using SCADA Connect, information can be automatically
queried from the SCADA system and passed to the WaterGEMS database, eliminating
manual processes. For example, tank levels and pump and valve settings can be updated
in WaterGEMS based on the SCADA database, so that the next time WaterGEMS is
run, it will reflect the current field conditions. SCADA Connect has been deployed for
the City of Bethlehem, Pennsylvania’s Bristol Babcock SCADA system and City of
Casselberry, Florida’s Citect SCADA system (Haestad Methods, 2004).
NPDES-PERMIT REPORTING APPLICATIONS
The well-known GIS magazine
Geospatial Solutions
holds an “Applications
Contest” each year (Geospatial Solutions, 2001a). The entries are judged based on
Figure 10.5
Flow-monitoring sites selected by using GIS.
2
3
4
22
23
24
5
6
7
8
9
10
11
12
13
14
15
16
18
19
20
21
Ohio River
17
N
012
miles
CSO Monitoring Sites
2
3
4
22
23
24
5
6
7
8
9
10
11
12
13
14
15
16
18
19
20
21
17
Legend
2
3
Monitored CSO Areas
Monitored CSOs (Flow
Meters and Samplers)
Unmonitored CSOs
Rain Gages
Treatment Plant
Unmonitored CSO Areas
Receiving Water
2097_C010.fm Page 188 Monday, December 6, 2004 6:06 PM
Copyright © 2005 by Taylor & Francis
interest, technology, and importance. The first place winner for the 2001 contest was
a stormwater pollutant load modeling application for Los Angeles, California.
As a condition of its NPDES Municipal Stormwater permit, the Los Angeles
County Department of Public Works is required to calculate and report pollutant load
for more than 256 contaminants. The County maintains a network of stormwater
monitoring devices to determine and report pollutant load for more than 256 contam-
inants. But, in addition to providing data about monitoring system locations and
readings, the County also has to estimate the pollutant load to the Pacific Ocean
from unmonitored drainage areas. The manual calculation of this information took
engineers 250 working hours for an area one quarter of the required study area. The
County, therefore, turned to GIS to create an automated model for calculating
pollutant load. Relying on an existing public-works GIS, a collaborative team added
several data layers to the system to integrate information about rainfall depth,
drainage area, land use, imperviousness, and mean countywide concentrations for
all the 256 pollutants based on monitoring-station data.
With that information, the team developed a modeling algorithm and refined its
operations (the weighting and correlations of different variables) by running models
for areas with known pollutant loads and comparing the results with monitoring-
station readings. After several iterations, the calibrated model estimated pollutant
loads with 95% accuracy. The team then developed an integrated menu-driven
interface that walks the user through the process of creating and setting parameters
and generating reports of pollutant load.
After specifying that he or she wants to perform a new load run, the user identifies
a study area by interactively defining a polygon on the screen. The program then
processes information in the background, extracting land-use information for the
study area stored in a land-use/imperviousness table. Next, the user selects a rainfall
year and event, which specifies the tabular database to use for the modeling, to
identify the inches of rainfall at each monitoring station. The application then
generates a rainfall grid using the tabular data for the specified rainfall year and
event to calculate the pollutant load. The final parameter the user specifies is the
pollutants. A dialog box enables interactive selection of the 256 pollutants (the
program automatically selects a default set of 64 pollutants). Once all the parameters
are defined, the user can calculate the pollutant load and generate maps and reports
for print using built-in templates. The program also automatically saves the selected
parameters and model results in a database table so that others can retrieve the load
run without having to reset all the parameters.
The project team used ESRI’s ArcView and Spatial Analyst for GIS analysis and
an automated report generation process from Crystal Decisions’ Crystal Reports.
MONITORING VIA INTERNET
Integration of GIS and Internet technologies is allowing users to click on a GIS
map and see the real time data from any type of Web-connected sensor, from stream
gauges to space and airborne Earth-imaging devices. Referred to as the Sensor Web,
the sharing of sensor data via the Internet represents a revolution in the discovery
2097_C010.fm Page 189 Monday, December 6, 2004 6:06 PM
Copyright © 2005 by Taylor & Francis
and use of live monitoring data. For example, data from the SAIC (a research and
engineering company in San Diego, California) Weather Monitoring System is
supplied from an Open GIS Consortium (OGC) Web Collection Service to a mapping
client, overlaying geographic information coming from an OGC Web Map Service.
The weather data are encoded in OGC Observation and Measurements Language,
which is an extension of Geography Markup Language (GML) (Reichardt, 2004).
MONITORING THE INFRASTRUCTURE
From 1998 to 2000, the City of Toronto (Ontario, Canada) collected water pipe
and soil samples to investigate the condition of its water distribution network. The
City hoped that this effort would explain the causes of water main deterioration and
guide the City in its water main rehabilitation efforts. The GIS data used in this
project consisted of three layers: (1) Geocoded street center lines, (2) sample loca-
tions, and (3) surface soils. Eighty-four pipe and associated soil samples (resistivity,
pH, and sulfide content) were collected, tested, and plotted on the street and soil
maps using the GIS’ address-matching capability. Using the GIS, a spatial analysis
of the data collected was performed to identify any trends between the data samples
and their locations. For example, water mains located in the clay-silt deposit near
lakeshores were suspected to be at greater risk for corrosion, and there was no
evident relationship between pH and soil formation (Doyle and Grabinsky, 2003).
Address geocoding
is a GIS process that locates street addresses as points on a map,
using a reference layer (usually a geocoded street layer).
Address matching
is the com-
parison of a street address to the address ranges in the reference layer. When an address
matches the address range of a street segment, an interpolation is performed to locate and
assign real-world coordinates to the address.
A Massachusetts water utility, puzzled by abnormally high lead and copper levels
in its distribution system, found that interpretations of water quality problems based
on aggregate monitoring data can be very misleading unless analysis is performed
at the appropriate scale. Incorporation of system and monitoring-site physical char-
acteristics data as well as the monitoring results into a GIS could have saved them
considerable investigatory effort (Schock and Clement, 1995).
USEFUL WEB SITES
Crystal Decisions www.crystaldecisions.net
Geospatial Solutions www.geospatial-online.com
Meteorlogix www.meteorlogix.com/GIS
NCDC Radar Products www.ncdc.noaa.gov/ol/radar/radarproducts.html
NEXRAIN Corporation www.nexrain.com
Vieux & Associates www.vieuxinc.com
WSI Corporation www.wsi.com
2097_C010.fm Page 190 Monday, December 6, 2004 6:06 PM
Copyright © 2005 by Taylor & Francis
CHAPTER SUMMARY
This chapter presented the methods and examples of GIS applications in install-
ing and maintaining various types of hydraulic characterization monitors (e.g., flow-
meters and rain gauges) and querying and analyzing the monitoring data. The
examples and case studies presented in this paper indicate that GIS is ideally suited
for selecting the best sites for installing the monitors. Once the monitors have been
installed, GIS allows user-friendly query of the monitoring data simply by clicking
on a map of monitoring sites. GIS facilitates studying the spatial trends in the
monitoring data. GIS is especially useful in processing and integrating radar rainfall
data with H&H models of sewage collection systems and watersheds.
CHAPTER QUESTIONS
1. What are radar rainfall data? How are they used in H&H modeling? How does
GIS help in processing them for H&H models?
2. How does GIS help in selecting the feasible flow-monitoring sites?
3. How does GIS allow a trend analysis of spatial patterns in monitoring data?
2097_C010.fm Page 191 Monday, December 6, 2004 6:06 PM
Copyright © 2005 by Taylor & Francis