Handbook Of Pollution Control And Waste Minimization - Chapter 7 doc
Bạn đang xem bản rút gọn của tài liệu. Xem và tải ngay bản đầy đủ của tài liệu tại đây (538.54 KB, 37 trang )
7
Energy Conservation
K. A. Strevett, C. Evenson, and L. Wolf
University of Oklahoma, Norman, Oklahoma
1 INTRODUCTION
A large proportion of our current pollution problems is the result of energy
technologies that rely on combustion of carbon-based fuels. Included in these
problems are emissions of greenhouse gases, acid rain precursors (oxides of sulfur
and nitrogen), and carbon monoxide; formation of photochemical oxidants;
releases to the biosphere of raw and refined petroleum products; and mining-
related pollution. Obviously, then, decreasing our consumption of carbon-based
energy will result in decreases in the amounts of these pollutants entering the
biosphere.
Global warming poses the threat of an environmental impact that is global
and, at least on a time scale of centuries, irreversible. Over the very long term of
two to three centuries, temperatures could rise by as much as 10 to 18˚C. While
it is impossible at this point to predict accurately all the effects of global warming,
its consequences are potentially so threatening to human and ecosystem health
that humans have an ethical obligation to do something about it (1).
It is obvious that strategies for reducing consumption of energy derived
from combustion of carbon-based fuels are among the most important means of
preventing global pollution. After a look at energy demands, this chapter dis-
cusses several such energy conservation strategies, the fuels currently being used
Copyright 2002 by Marcel Dekker, Inc. All Rights Reserved.
to supply these demands, and a survey of the environmental impacts of some of
the pollutants produced by these fuels.
2 ENERGY SUPPLIES AND DEMANDS
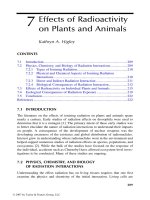
Coal, oil, and natural gas supply about 95% of global energy. Coal dominates
energy markets, accounting for about 44% of fossil energy consumption. Oil
accounts for about 32% of fossil fuel supply, while natural gas contributes 24%
(Figure 1).
Coal is the most abundant fossil fuel worldwide, with current reserves
expected to last more than 200 years. “Conventional” oil production is expected
to peak between 2010 and 2020, resulting in a switch to “unconventional”*
sources and a possible increase in price (2). The total ultimately recoverable
natural gas resources in the world are estimated to amount to about 80% as much
energy as the recoverable reserves of crude oil. At current usage rates, gas
reserves represent approximately a 60-year supply (3).
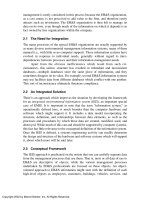
Although developed countries account for less than 20% of the world’s
population, these countries use more than two-thirds of the commercial energy
supply, consuming 78% of the natural gas, 65% of the oil, and about 50% of
the coal produced each year (Figure 2). The United States and Canada, for
example, account for only about 5% of the world’s population, but consume
about one-quarter of the available energy (3). Carlsmith et al. (1990, as cited in
Ref. 4) estimated that 36% of U.S. energy consumption is in commercial and
residential buildings; industry accounts for another 36% and transportation for the
remaining 28%.
*Oil is considered unconventional if it is not produced from underground hydrocarbon reservoirs by
means of production wells, and/or it requires additional processing to produce synthetic crude. It
includes such sources as oil shales, oil sands-based synthetic crudes and derivative products, and liquid
supplies derived from coal, biomass, or gas (2).
Coal
44%
Natural
Gas
24%
Oil
32%
FIGURE 1 Percent contribution of coal, oil, and natural gas to global energy
markets.
Copyright 2002 by Marcel Dekker, Inc. All Rights Reserved.
In November 1998, the World Energy Outlook (2) predicted 65% growth
in world energy demand and 70% growth in CO
2
emissions between 1995 and
2020, without policy changes. The Outlook estimates that fossil fuels will meet
95% of additional global energy between 1995 and 2020 and that two-thirds of
the increase in energy demand and energy-related CO
2
emissions over this period
could occur in China and other developing countries. The market share of gas is
expected to increase, while that of oil will decline slightly and the share of coal
will remain stable. By 2020, global electricity generation is predicted to have
increased by nearly 88% over 1995 rates. While electricity generation from
energy sources other than carbon-based fuels and hydropower is growing fast, it
is expected to represent less than 1% of world electricity generation by 2020
without policy changes.
3 NONRENEWABLE ENERGY SOURCES
3.1 Coal
Coal is fossilized plant material preserved by burial in sediments and altered by
geological forces that compact and condense it into a carbon-rich fuel. Its
advantage lies in its abundance of supply. The environmental effects of burning
all the remaining coal, however, could be catastrophic. Coal is the worst offender
among fossil fuels in terms of CO
2
per unit of energy generated. The supply of
coal is enough to permit atmospheric carbon buildup of severalfold (4). In
addition, the burning of coal is a primary source of acid rain precursors. Pollution
associated with the mining of coal is discussed later.
Industrialized countries generate between 20% and 30% of their energy
from coal; in the case of China, the figure is nearly 75% (5). In the United States,
the relative contribution of coal declined from a peak of about 75% of total energy
Developed Underdeveloped
Coal
50%
50%
Oil
65%
35%
Natural Gas
78%
22%
FIGURE 2 Comparison of coal, oil, and natural gas consumption in developed
and less developed countries.
Copyright 2002 by Marcel Dekker, Inc. All Rights Reserved.
supply in 1910 to about 17% in 1973 and increased again to about 23% in 1989.
In 1989, about 86% of domestic coal consumption was accounted for in electric
power production (6).
3.2 Petroleum
Petroleum, like coal, is derived from organic molecules created by living organ-
isms millions of years ago and buried in sediments where high pressures and
temperatures concentrated and transformed them into energy-rich compounds.
Petroleum has represented a relatively inexpensive source of fuel for transporta-
tion and provides the chemical industry with feedstocks, e.g., for the production
of plastics. However, its use results in emissions of carbon dioxide, carbon
monoxide, and acid rain precursors, and in the formation of photochemical
oxidants. In addition, aquatic and terrestrial systems may become polluted by
unintentional releases of raw and refined petroleum.
3.3 Natural Gas
Natural gas is a combustible mixture of methane (CH
4
) and other hydrocarbons
formed during the anaerobic decomposition of organic matter. It is the least
polluting of the fossil fuels, releasing only a little more than half as much CO
2
as
coal. Important disadvantages of natural gas are its limited supply, difficulty of
storage in large quantities, and difficulty of transport across oceans. It can be
transported across land via pipelines; however, leaks of methane from these pipelines
represent a significant contribution to global warming. Furthermore, such pipeline
networks are prohibitively expensive for developing countries. As a result, much of
the natural gas produced in conjunction with oil pumping is simply burned (flared
off), representing a terrible waste of a valuable resource (3).
4 SOURCES AND ENVIRONMENTAL IMPACTS
OF POLLUTANTS
The production and/or consumption of carbon-derived energy result in release to
the biosphere of a variety of pollutants. These include gaseous pollutants [carbon
dioxide, acid rain precursors (nitrogen oxides and sulfur dioxide), and carbon
monoxide], photochemical oxidants, unintentional releases of raw and refined
petroleum, mining-related pollution (i.e., acid mine drainage), methane, and
thermal pollution.
4.1 Gaseous Pollutants
4.1.1 Carbon Dioxide
Carbon dioxide is responsible for 55% of global warming. The two primary
anthropogenic sources of atmospheric CO
2
are fossil fuel burning (~77%) and
Copyright 2002 by Marcel Dekker, Inc. All Rights Reserved.
deforestation (~23%). Cline (4) has estimated that if human sources of atmo-
spheric carbon were immediately reduced by about 43%, warming could be held
to about 2.5˚C.
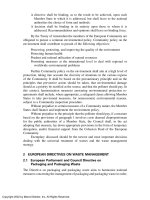
Atmospheric CO
2
concentration was more or less stable near 280 ppm for
thousands of years until about 1850, and has increased significantly since then
(Figure 3) (Schimel et al., 1995, as cited in Ref. 7). Since the beginning of the
industrial era, about 40% of all CO
2
released through the burning of fossil fuel
has been absorbed by sinks; the remainder has remained in the atmosphere (1).
The human-caused increase in atmospheric CO
2
already represents nearly a 30%
change relative to the preindustrial era (7); annual global emissions of CO
2
have
increased 10 times this century (8). At the current rate of increase in concentra-
tions of CO
2
and other heat-trapping gases in the atmosphere, greenhouse gas
concentrations will be equivalent to double the preindustrial CO
2
concentration
by 2050 (National Academy of Sciences, 1992, as cited in Ref. 1). Ultimately,
this could increase the average global temperature by about 1–5˚C, with a likely
figure of 2.5˚C. According to Cline (4), we are already committed to about 1.7˚C
of warming from the existing accumulation of greenhouse gases, and warming
could increase by 10˚C or more if nothing is done to alter likely fossil fuel
consumption patterns. The historic record suggests that the average global surface
temperature has already risen approximately 0.3–0.6˚C since the nineteenth
century (1).
Natural gas releases slightly less than half the amount of CO
2
released
during the combustion of coal, with petroleum in between. Coal and natural gas
each accounts for about 27% of U.S. fossil fuel supply, but coal accounts for about
275
300
325
350
375
1700 1750 1800 1850 1900 1950 2000
Atm. CO
2
Conc.
(ppm)
FIGURE 3 Historical increase in global CO
2
emissions. (Sources: Refs. 35–37.)
Copyright 2002 by Marcel Dekker, Inc. All Rights Reserved.
one-third of U.S. CO
2
emissions. In the United States, electric utilities account
for about one-third of all CO
2
releases, with transportation activities adding
approximately an additional third. Globally, oil consumption accounts for nearly
half of total CO
2
emissions and much of its air pollution (6).
4.1.2 Nitrogen Oxides
Nitrogen oxides (NO
x
) are responsible for about 35% of acid rain, and are a
precursor of O
3
pollution (Figure 4). Of all U.S. air pollutants, oxides of nitrogen
have been the most difficult to control. They are formed when ambient diatomic
nitrogen (N
2
) is heated to temperatures > 1200˚F, and their dominant sources are
the internal combustion engine and power plants (Figure 5) (1). The 900 million
tons of coal burned annually in the United States are responsible for about
one-third of all this country’s NO
x
emissions (3).
2NO + O
2
→ 2NO
2
2NO
2
+ H
2
O → HNO
2
+ HNO
3
There are various ways of reducing nitrogen oxide emissions including
combustion control and the use of catalysts (9). Our best option for reducing this
pollutant, however, is through reduced burning of fossil fuels and forests.
4.1.3 Sulfur Dioxide
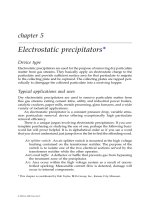
Sulfur dioxide (SO
2
) is responsible for about 60% of acid rain (Figure 4). At least
two-thirds of the sulfur oxides in the United States are emitted from coal-fired
power plants. Much of the coal burned in the United States has a high sulfur
content—2% or more. Most of the remaining SO
2
emissions are accounted for by
industrial fuel combustion and industrial processes such as petroleum refining,
sulfuric acid manufacturing, and smelting of nonferrous metals (Figure 5) (10).
4.1.4 Carbon Monoxide
Carbon monoxide (CO) is the result of incomplete combustion. CO inhibits
respiration in animals by binding irreversibly to hemoglobin. About half the CO
released to the atmosphere each year is the result of human activities. In the
United States, two-thirds of the CO emissions are created by internal combustion
engines in transportation (3).
4.2 Photochemical Oxidants
Photochemical oxidants are products of secondary atmospheric reactions driven
by solar energy—e.g., splitting of an O
2
or NO
2
molecule, freeing an oxygen
atom which reacts with another O
2
to form ozone (O
3
). O
3
is the result of
atmospheric chemistry involving two precursors, nonmethane hydrocarbons
(HCs) and NO
x
, which react in the presence of heat and sunlight (Figure 6) (11).
Copyright 2002 by Marcel Dekker, Inc. All Rights Reserved.
SO
2
NO
x
Acid Rain
Atmospheric mixing
yields sulfuric and
nitric acids
Dry deposition of
acidic compounds
Vehicular emissions
Burning of fossil fuels
yields SO
2
and NO
x
FIGURE 4 NO
x
and SO
2
contributions to acid rain formation.
Copyright 2002 by Marcel Dekker, Inc. All Rights Reserved.
This ground-level O
3
is a pollutant that can have harmful effects on human health,
while O
3
present in the upper atmosphere protects the earth from harmful
ultraviolet radiation. Figure 6 demonstrates the dynamic interactions between
HCs and NO
x
, which are produced from combustion, and atmospheric oxygen.
In addition to forming O
3
, NO
x
can also remove ground-level O
3
. This removal
is often temporary, however, as O
3
is re-formed through other reactions.
Ground-level O
3
is a respiratory irritant that causes health concerns at very
low concentrations because its very low solubility in water means it tends not to
be removed by the mucous in the upper respiratory tract and penetrates deeper
into the lungs. There is evidence that exposure to O
3
accelerates the aging of lung
tissue and increases susceptibility to respiratory pathogens. Human exposure to
O
3
can produce shortness of breath and, over time, permanent lung damage (12).
Costs of the health effects of O
3
in the United States are estimated to be about
$50 billion per year. In addition, O
3
causes more damage to plants than any other
pollutant (1). O
3
concentrations rise with temperature and are therefore expected
to be exacerbated by global warming. If cloud cover decreases as a result of global
SO
2
Emissions
Other
Combustion
3%
Industrial
Combustion
12%
Ind/Mfg
Processes
13%
Transport.
4%
Utilities
68%
NO
x
Emissions
Ind/Mfg
Processes
5%
Other
1%
Other
Combustion
4%
Transport.
42%
Industrial
Combustion
16%
Utilities
32%
FIGURE 5 Percent contribution to SO
2
and NO
x
emissions in the United
States of various industries. (Source: Ref. 34.)
Copyright 2002 by Marcel Dekker, Inc. All Rights Reserved.
warming, thus permitting increased penetration of sunlight, O
3
concentrations
will be further increased.
4.3 Raw and Refined Petroleum Spills and Leaks
Crude oil spills such as that of the Exxon Valdez are probably the most widely
known examples of this type of energy-related pollution. In addition, it has been
estimated that about 11 million gallons of gasoline are lost each year by leaking
underground storage tanks (3).
4.4 Mining-Related Pollution
Acid mine drainage is one of the most common and damaging problems in the
aquatic environment. Many waters flowing from coal mines and draining from
the waste piles that result from coal processing and washing have low microbial
H
OH
H
2
O
O
2
O
2
HO
NO
O
NO
2
hv
λ=0.39µ
m
O
2
OO
3
O
2
O
2
H
O
3
O
O
2
hv
λ=0.39µ
m
NO
2
NO
OH
FIGURE 6 The release of hydrocarbons and NO during combustion results in
the conversion of NO to NO
2
. Increased formation of NO
2
increases the
production of O
3
.
Copyright 2002 by Marcel Dekker, Inc. All Rights Reserved.
densities due to the highly acidic nature of these waters. Acidic mine water results
from the presence of sulfuric acid produced in a series of microbially mediated
reactions that begin with the oxidation of pyrite, FeS
2
(13). Often, mining
operations result in surface waters infiltrating into the subsurface voids, especially
after the mine is exhausted and pumping ceases. In some areas of Appalachia,
large underground impoundments of water have filtered into coal mines. These
waters have become very acidic and, when they are returned to the surface via
pumping or by subsurface flows, their low pH value devastates the aquatic
systems they infiltrate (14).
Another impact of underground mining is the waste materials that are a
by-product of any mining operation. Gaining access to the vein or seam of coal,
as well as transporting the coal to the surface, requires large amounts of waste
materials to be removed to the surface. These waste materials, or tailings, are
often piled up in large mounds in close proximity to the mine. The composition
of many tailings can contain toxic minerals such as mercury, lead, or iron sulfide.
Water percolating through these waste materials often produces water quality
problems downstream from the tailings similar to those associated with subsur-
face water flows from within the mines. In addition to the sterile conditions on
tailings mounds themselves, rain water running off the tailings often is so acidic
as to kill both the vegetation in the immediately affected lands and the aquatic
life in streams and rivers receiving these waters. Many lands and streams within
the Appalachian coalfield areas of western Pennsylvania, West Virginia, eastern
Kentucky, and eastern Ohio are devastated by the acidic waters resulting from
coal mining operations. The enactment of environmental legislation limits the
damage associated with active mining operations, but the land degradation
associated with past mining has left a filthy legacy of degraded landscapes (14).
Surface mining is usually favored over underground mining for primarily
economic reasons. It is virtually impossible to prevent land degradation when
surface mining occurs. First, in some operations, huge depressions result. Second,
the overburden (extracted soil, subsoil, and unconsolidated earth and rocks) must
be stored and then replaced systematically in their original order after the mineral
is removed. Even under optimal conditions, which rarely occur, restoration
usually results in a landscape that is less productive than it was prior to mining.
Subsurface groundwater flow is always disturbed, and revegetation is often slow.
Restoration is further complicated when toxic materials are leached from the
overburden during its storage. These conditions often occur in coal mining
operations, which have disturbed about 2.3 million acres in the United States (14).
The area affected by mining can be three to five times more widespread
than the area actually exploited (15). Even when increased acidity is not consid-
ered, mining-related soil erosion alone can impact natural waters significantly.
Added nutrients may increase aquatic productivity, resulting in eutrophication.
Lower levels of dissolved oxygen associated with eutrophication may render the
Copyright 2002 by Marcel Dekker, Inc. All Rights Reserved.
water uninhabitable by other aquatic organisms. On the other hand, suspended
sediments may reduce light penetration, reducing productivity and therefore
available fish food. Sediments may also interfere with salmon and trout spawning
and reduce survival of their eggs. Young fish may be more susceptible to
predation when sediments fill or cover hiding places (14). Species that stalk their
prey visually may be unable to survive in murky water.
4.5 Methane
Methane is responsible for about 20% of the greenhouse effect, and concentra-
tions have already risen to more than double preindustrial estimations. Con-
centrations continue to rise at about 0.9% annually (4). The majority of
anthropogenic methane is the result of non-energy-related human activities such
as ruminant livestock and cultivation of rice (from which about half the world’s
population derive about 70% of their calories), and decomposition of organic
matter in landfills. However, leaks in natural gas pipelines contribute about 21%
of anthropogenic methane, and the burning of coal adds an additional 6%. Other
energy-related sources of methane include coal mines, natural gas leaks, gas
associated with oil production, and the creation of new wetlands when forests are
flooded following construction of hydroelectric dams.
4.6 Thermal Pollution
When coal is burned to generate electricity at a power plant, some of the coal’s
energy content is lost to coolant water, which is then discharged into rivers or
lakes. Since an inverse relationship exists between water’s temperature and
its oxygen-holding capacity, the water’s dissolved oxygen concentration can
be diminished to a point below which some aquatic organisms may be able
to survive.
5 POLLUTION PREVENTION THROUGH DECREASED
FOSSIL FUEL CONSUMPTION
Carbon dioxide can be considered an inevitable product of fossil fuel combustion;
therefore, CO
2
emissions can be reduced only through reduced consumption of
fossil fuels. It is important to note that emissions of every other pollutant
discussed in Section 4 will be reduced as an additional benefit of reducing fossil
fuel consumption and thereby CO
2
emissions.
5.1 Imposition of a Tax on Traditional Energy Sources
Internal costs are the expenses, monetary or otherwise, that are borne by those
who actually use a resource. External costs are the expenses, monetary or
Copyright 2002 by Marcel Dekker, Inc. All Rights Reserved.
otherwise, borne by someone other than the individuals or groups who use a
resource (3). As an example, according to Tenenbaum (27), a 1990 study at Pace
University concluded that the true cost of an unscrubbed coal plant was 11.6 cents
per kilowatt hour (kWh), double the 5.8 cents that utilities were charging.
Cline (4) has produced an extensive analysis of the economic effects of
global warming. One strategy for reducing dependence on fossil energy sources
is the imposition on these sources of a tax large enough to “internalize” the costs
associated with fossil fuels, such as sea-level rise (estimated by Cline to amount
to about $7 billion annually in the United States*), agricultural losses ($18
billion), curtailed water supply due to reduced runoff ($7 billion), forest loss (>$3
billion, considering only lumber value), increased electricity demand for addi-
tional cooling ($11 billion), exacerbation of urban O
3
problems ($4 billion),
increased mortality from heat waves ($6 billion, valued at lifetime earning
potential), losses of leisure activities associated with winter sports (ski industry
$1.5 billion), increased hurricane ($750 million) and forest fire damage, and
species loss. Cline estimates total damage from CO
2
-equivalent doubling the
amount to about $61 billion,
†
or about 1.1% of the Gross Domestic Product
(GDP). Intangible losses such as species loss and decline in human quality of life
could raise the total to about 2% of GDP. If CO
2
doubling results in a temperature
increase of 4.5˚C rather than 2.5˚C, the corresponding damage could be as high
as 4% of GDP, with even greater losses in some other countries such as low-lying
island nations.
Some of the revenue derived from the tax could be channeled toward
improvements in public transportation, development and/or subsidization of more
environmentally benign energy sources, and research directed toward efficiency
improvements. Cline (4) suggests that some of the revenue be channeled to de-
veloping countries “to secure their participation in international abatement. . . .
The importance of including developing countries in international measures for
restraining and reducing emissions, and the political and equity considerations
that seriously limit the amount of growth these countries can be expected to
sacrifice to help avoid global warming, strongly point to the need to channel some
of the revenue from a carbon tax from industrial countries to assist developing
countries that are prepared to take measures to reduce deforestation and configure
future energy development along lines that minimize carbon emissions.”
*Figures are in 1990 dollars and are based on a doubling of CO
2
-equivalent resulting in an
approximate temperature increase of 2.5˚C; concentrations of more than double preindustrial levels
obviously would result in even higher costs.
†In contrast, Tenenbaum (27) cites a 1991 report that says the external costs of energy currently range
from $100 billion to $300 billion in the United States.
Copyright 2002 by Marcel Dekker, Inc. All Rights Reserved.
5.2 Establishing Emissions Caps and Trading Programs
Establishing emissions caps and trading programs would be similar to the
imposition of limits on sulfur emissions established by the 1990 Clean Air Act
Amendments (CAAA); a brief discussion of these limits is therefore warranted.
The CAAA established an absolute cap on sulfur dioxide (SO
2
) emissions
by electrical utilities of 8.95 million tons after an initial reduction of 10 million
tons; it is assumed that this cap is sufficient to protect ecosystem health. Under
the technology-forcing regulatory approach of the past, each utility would have
been required to install a technology that reduced emissions by an amount
sufficient to achieve the 10-million-ton reduction. Economists have argued that
this approach results in higher control costs than necessary. Different utilities are
likely to incur different control costs due to age and technological differences in
their facilities (i.e., one utility may have a much lower per-ton incremental cost
for emission reduction than another).
The 1990 Clean Air Act Amendments provides for the issuance of permits
to utilities equal to 30–50% of their emissions 10 years earlier. Utilities whose
per-ton incremental costs for emission reduction are low can reduce emissions
beyond the level required for permit compliance and then sell surplus permits. In
turn, utilities whose incremental costs are high can reduce their control costs by
purchasing permits from utilities whose incremental costs are low. The end result
is achievement of the desired level of SO
2
emissions reduction without imposing
unreasonable economic burdens on utilities while, at the same time, providing an
economic incentive for industries to reduce their SO
2
emissions.
A similar program could be developed and used for carbon emissions.
The cap for carbon emissions could be based on the degree to which coun-
tries would like to limit global warming. For instance, freezing global carbon
emissions at the current level of about 6 billion tons (gigatons, or GtC) would
limit warming to about 5˚C (1). Capping emissions at 4 GtC would limit
warming to 2.5˚C. Carbon emissions could by reduced by as much as 20–25%
through energy efficiency improvements and substitution of non-carbon en-
ergy sources (both of which are discussed later) at zero net economic cost
with significant economic benefit to those companies involved in this trading
program (4).
According to Cline (4), it is widely believed that a system of tradable
permits can be applied globally, on a country-by-country basis, in much the same
manner as would a carbon tax. If a country has a quota allocation that is small
relative to its demand, its firms could bid to purchase quotas from other countries.
Other countries could sell a portion of their quotas at a price that would equal or
exceed the cost of reducing their overall carbon emissions. Thus, global carbon
emissions could be reduced through an economic incentive program that would
reward countries that reduce their overall carbon emissions.
Copyright 2002 by Marcel Dekker, Inc. All Rights Reserved.
Booth (1), on the other hand, believes that permits issued on an individual
basis rather than by country would be more effective:
Permits could be domestically distributed annually on a per person basis
equal in amount to existing emissions initially, and then reduced by 3.6
percent of the initial amount each year over a phase-in period of
approximately 25 years to arrive at a 90 percent total reduction. Individ-
uals who don’t need the full allocation for their own energy consumption
could sell their surplus permits at the going market price. Such a system
would tend to redistribute income away from industries and high-income
families who are heavy consumers of energy to low-income families
who tend to consume less energy. Because of the potential to sell surplus
permits, the public resistance to a permit system would be less than to a
carbon tax. The rising price of permits over time would provide the
incentive needed for increased energy conservation and to shift to
non-fossil fuel energy sources. As in the case of acid rain control, a
marketable permit system for carbon emissions control results in control
being achieved at the lowest possible cost (1). p. 23
Either of the above strategies would constitute impetus for increases in
efficiency and other conservation measures. Both taxes and tradable permits
minimize overall abatement costs by allocating the cutbacks to the countries
where marginal costs of emissions reductions are the lowest. A major difference
between the two strategies is that, with tradable permits, it is possible to specify
the exact cutback in emissions (4). Cline (4) believes the best strategy to be
reliance on nationally set carbon or greenhouse gas taxes during an initial
phase-in period and then, in a subsequent phase, to set the taxes at an inter-
nationally agreed rate while each individual nation would continue to collect
them. If such taxes failed to achieve satisfactory progress toward global emis-
sion targets, it would then be appropriate to shift to an international system of
tradable permits.
5.3 Elimination of Subsidies
5.3.1 International Subsidies
For some years, the World Bank (33) has been drawing attention to the fact that
electricity is sold in developing countries at, on average, only 40% of the cost of
its production. A recent study pointed out:
Such subsidies waste capital and energy resources on a very large scale.
Subsidizing the price of electricity is both economically and environ-
mentally inefficient. Low prices give rise to excessive demands and, by
undermining the revenue base, reduce the ability of utilities to provide
Copyright 2002 by Marcel Dekker, Inc. All Rights Reserved.
and maintain supplies. Developing countries use about 20 percent more
electricity than they would if consumers paid the true marginal cost of
supply. Underpricing electricity also discourages investment in new,
cleaner technologies and more energy efficient processes (16). p. 12
Shah and Larsen (1991, as cited in Ref. 4) estimated that nine large
developing and Eastern European countries (China, Poland, Mexico, Czecho-
slovakia, India, Egypt, Argentina, South Africa, and Venezuela) spend a combined
$40 billion annually in subsidization of fossil fuels (with China’s* $15.7 billion
the largest). The former Soviet Union spends more than twice this amount—$89.6
billion annually—on fossil fuel subsidies. The removal of these subsidies would
eliminate an estimated 157 million tons of carbon annually from the developing
group and 233 million tons from the former Soviet Union alone. These cutbacks
would represent about 8% of global carbon emissions (or about 6% if deforesta-
tion emissions are included).
Prices that cover production costs and externalities are likely to encourage
efficiency, mitigate harmful environmental effects, and create an awareness
conducive to conservation. Subsidized energy prices, on the other hand, are one
of the principal barriers to raising energy efficiency in developing countries,
where it is only 50–65% of what would be considered best practice in the
developed world. Studies indicate that with the present state of technology a
saving of 20–25% of energy consumed would be achieved economically in many
developing countries with existing capital stock. If investments were made in
new, more energy-efficient capital equipment, a saving in the range of 30–60%
would be possible (9).
5.3.2 U.S. Subsidies
According to Ackerman (30), two studies have attempted to measure federal
energy subsidies. The Department of Energy’s Energy Information Administra-
tion identifies subsidies worth $5–$13 billion annually, while the Alliance to Save
Energy, an energy conservation advocacy group, estimates energy subsidies at
$23–$40 billion annually (in 1992 dollars). Ackerman also states that several
provisions of the tax code are, effectively, subsidies to the oil and gas industry
and that, depending on one’s view of a local tax controversy, the total subsidy to
oil and gas production alone might be as much as $255 million, almost 5% of
sales in 1990.
*China accounts for 11% of global carbon emissions, excluding emissions from deforestation. Seventy
percent of China’s energy comes from coal (4).
Copyright 2002 by Marcel Dekker, Inc. All Rights Reserved.
5.4 Increases in Energy Efficiency
Primary energy is defined as the energy recovered directly from the Earth in the
form of coal, crude oil, natural gas, collected biomass, hydraulic power, or heat
produced in a nuclear reactor from processed uranium. Generally, primary energy
is not used directly but is converted into secondary energy (9). The process of
energy conversion and transformation results in part of the energy being wasted
as heat. Energy efficiency considerations focus on the following factors:
The efficiency of original extraction and transportation
The primary energy conversion efficiency of central power plants, refiner-
ies, coal gasification plants, etc.
The secondary energy conversion efficiency into storage facilities, distribu-
tion systems and transport networks (e.g., of electricity grids)
Efficiency of final energy conversion into useful forms such as light and
motion (9)
For the world as a whole, the overall efficiency with which fuel energy is
currently used is only around 3–3.5% (17). According to Orr (32), a Department
of Energy study showed that U.S. energy consumption could be reduced by 50%
with present technologies with a net positive economic impact. The United States
did indeed reduce the energy intensity of its domestic product by 23% between
1973 and 1985 (18).
5.4.1 The Industrial Sector
The industrial sector in the more advanced industrial countries is the most
efficient energy user. It is easier to be efficient when operating on a larger scale
and when energy is an explicit element of operating costs. Profit margins mandate
careful cost analysis, and in industries where energy costs comprise a significant
portion of total costs, managers are more alert to opportunities for savings (9).
According to the Office of Technology Assessment (1991, as cited in Ref. 2) four
sectors—paper, chemicals, petroleum, and primary metals—account for three-
fourths of the energy used in manufacturing. More than half the energy consumed
by industry in the leading industrial countries is as fuel for process heat, and over
one-fifth (gross) is in the form of electricity for furnaces, electrolytic processes,
and electric motors. Most process heat is delivered in the form of steam, with an
overall efficiency variously estimated to be between 15% and 25%. The biggest
users of process heat are the steel, petroleum, chemicals, and paper and pulp
industries (9).
Potential for improvements does exist. In general, sensors and controls,
advanced heat-recovery systems, and friction-reducing technologies can decrease
energy consumption (5). Many efficiency measures are specific to each industry.
For instance, the World Energy Council (9) offers several options for improving
Copyright 2002 by Marcel Dekker, Inc. All Rights Reserved.
efficiency in the chemical industry, including the use of biotechnology and
catalysts (Table 1).
In the paper industry, automated process control, greater process speeds,
and high-pressure rollers can boost efficiencies significantly (5). According to
Carlsmith et al. (1990, as cited in Ref. 4), electric arc furnaces using scrap are
much more energy efficient for steel production than are traditional techniques
and could increase their share of output from 36% to 60%. According to Cline
(4), these authors also estimate that by 2010, direct reduction or smelting of ore
for making iron would reduce energy requirements in steelmaking by 42% with
a net cost savings. Even greater opportunities exist for improving energy effi-
ciency in developing countries: for example, China and India use four times as
much energy as Japan does to produce a ton of steel (5).
In aluminum production, energy efficiency can be increased by improved
design of electrolytic reduction cells, recycling, and direct casting. Other exam-
ples of improvements in industrial processes include low-pressure oxidation in
industrial solvents, changes in paper-drying techniques (as well as paper recycl-
ing), and shifting from the wet to the dry process in cement making (4).
Co-generation, the simultaneous production of both electricity and steam or
hot water, represents a great opportunity for improving energy efficiency in that
the net energy yield from the primary fuel is increased from 30–35% to 80–90%.
In 1900, half the United States’ electricity was generated at plants that also
provided industrial steam or district heating. However, as power plants became
larger, dirtier, and less acceptable as neighbors, they were forced to move away
from their customers. Waste heat from the turbine generators became an unwanted
pollutant to be disposed of in the environment. In addition, long transmission
lines, which are unsightly and lose up to 20% of the electricity they carry, became
necessary. By the 1970s, co-generation had fallen to less than 5% of our power
TABLE 1 Options for Improving Efficiency in Chemical Industry
Options Benefits
Biotechnology Speed reaction times
Reduce necessary temperatures
and pressures
Catalysts Improve yields and reaction times
Reduce necessary temperatures
and pressures
Separation and concentration Improve product purity
Waste heat management Reduce necessary temperatures
and pressures
Copyright 2002 by Marcel Dekker, Inc. All Rights Reserved.
supply, but interest in this technology is being renewed, and the capacity for
co-generation has more than doubled since the 1980s.
5.4.2 Buildings
In developed countries, buildings are the largest or second-largest consumers of
energy. In the United States, buildings account for about 75% of all electricity
consumption (19) and about 35% of total primary energy consumption (3); most
of this is for heating and cooling. Electricity generation alone produces more than
25% of energy-related carbon dioxide emissions (20). Building improvements
could therefore have a major impact on overall energy consumption and carbon
emissions.
In a “typical” North American house, the average efficiency of insulation
is about 12% compared with the ideal. As a result, the overall energy efficiency
of air cooling systems has been estimated to be barely 5%, and the overall energy
efficiency for space heating is less than 1%. These figures do not take into account
avoidable losses through heating or cooling unoccupied rooms (9).
Building design is one of the simplest yet most effective ways to take
advantage of solar energy. Buildings can incorporate either passive or active solar
technologies. Passive solar heating and cooling function with few or no mechan-
ical devices; primarily they involve designing the form of landscape and building
in relation to each other and to sun, earth, and air movement (19). In general,
passive technologies use a building’s structure to capture sunlight and store heat,
reducing the requirements for conventional heating and lighting. Heating can be
cut substantially by the use of one or several technologies in the building’s design
(Table 2). When included in a building’s initial design, these methods can save
up to 70% of heating costs (21). Orr (32) points out that it is cheaper and less
risky by far to weatherize houses than it is to maintain a military presence in the
Persian Gulf at a cost of $1 billion or more each month.*
Cooling needs also may be reduced by passive means; one strategy is the
reduction of internal heat gains. Another passive strategy for reducing cooling
needs is by reduction of external heat gains. Several technologies that can be used
to reduce internal and external heat gains are listed in Table 2. Also, it is important
*Nearly one-quarter of all jet fuel in the world, about 42 million tons per year, is used for military
purposes. The Pentagon is considered to be the largest consumer of oil in the United States and perhaps
in the world. One B-52 bomber consumes about 228 liters of fuel per minute; one F-15 jet, at peak
thrust, consumes 908 liters of fuel per minute. It has been estimated that the energy the Pentagon uses
up annually would be sufficient to run the entire U.S. urban mass transit system for almost 14 years.
Further, it has been estimated that total military-related carbon emissions could be as high as 10% of
emissions worldwide, and that between 10% and 30% of all global environmental destruction can be
attributed to military-related activities (28).
Copyright 2002 by Marcel Dekker, Inc. All Rights Reserved.
to trade in old, wasteful for newer, more efficient ones; the payback period may
be as little as two to three years (3).
One measure proposed in several developed countries is to require all
houses to be subject to an energy efficiency survey that would lead to an energy
efficiency rating which would have to be disclosed to prospective buyers when
the house is sold (9).
5.4.3 Lighting
About 40–50% of the energy consumed in a typical house is used for heating and
cooling, with an additional 5–10% used for lighting. Lighting is the least efficient
common use of energy: about 95% of the energy used in an average lighting
system dissipates as heat (19). Incandescent bulbs have an efficiency of about 4%
in converting electricity to visible radiant energy. In contrast, the efficiencies of
fluorescent lights is typically around 20%, and can be as high as 35% (9).
According to Lovins and Lovins (1991, as cited in Ref. 4), a 15-W compact
fluorescent bulb emits the same amount of light as a 75-W incandescent bulb and
lasts 13 times as long. Further, over its lifetime, it can save enough coal-fired
TABLE 2 Technologies for Increasing a Building’s Energy Efficiency
Area for improving
energy efficiency Technology
Heating Heat-circulation systems using natural convective
forces
Heat pumps
Solar-thermal collectors
Insulated windows and shutters
Special window glazings
Heat-storing masses built into structure
Building orientation
Draft proofing
Superinsulation of structure
Cooling Fluorescent lighting over incandescent
Lower-wattage bulbs
Landscaping that provides maximum shade
Window shades
Reflective or tinted window coatings
Insulated windows
Light-colored roofs
Ventilation by natural convection
Ground absorption of heat
Copyright 2002 by Marcel Dekker, Inc. All Rights Reserved.
electricity to reduce carbon emissions by 1 ton with a net savings. The National
Academy of Science (1991, as cited in Ref. 4) contends that the replacement of
an average of just 2.5 heavily used interior incandescent bulbs and one exterior
bulb by compact fluorescent lights would reduce average household lighting
energy requirements by 50%. Why, then, do we continue to use incandescents?
Lack of awareness
Easy commercial availability or promotion
High first cost
High replacement cost in the event of breakage
Cost and inconvenience of retrofitting new lighting systems to existing
domestic buildings, where rewiring and new sockets, holders, and appli-
ances may be needed (9)
5.4.4 Government’s Role
MacNeill (31) contends that, in order to make steady gains in energy efficiency,
governments must institute politically difficult changes in at least three areas:
1. Countries must consider “conservation pricing,” i.e., taxing energy
during periods of low real prices to encourage increases in efficiency.
2. Stricter regulations should demand steady improvement in the effi-
ciency of appliances and technologies, and in building design, auto-
mobiles, and transportation systems. [In the United States, efficiency
standards for appliances were adopted in 1986. For refrigerators, the
biggest users of electricity in most households, the energy efficiency of
new models almost tripled from 1973 to 1993 (22).]
3. Institutional innovation will be necessary to break utility-supply
monopolies and to reorganize the energy sector so that energy services
can be sold on a competitive, least-cost basis.
In addition, governments should excise policies that retard the development of
new and renewable energy resources, particularly those that serve as substitutes
for fuelwood.
5.4.5 Caution
As a final word on the issue of efficiency, it is worthwhile to quote Cline (4):
In reaching the overall conclusion that some 20 percent to 25 percent of
carbon emissions in the United States might be eliminated at zero cost
by a move to “best practices,” it is important that there not be a
misguided inference that dealing with the greenhouse problem will be
cheap over the longer term. . . . Serious action to curb global warming
would involve emissions restraints over a period of two to three centu-
Copyright 2002 by Marcel Dekker, Inc. All Rights Reserved.
ries. . . . Whether the first step is low-cost (or even no-cost) is significant
but of limited help in gauging the eventual costs.
The central point is that a one-time gain from elimination of
inefficiencies would shift the entire curve of baseline emissions down-
ward but still leave future emissions far above present levels. Consider
the period through the year 2100 . . . a central baseline estimate calls for
approximately 20 GtC of global carbon emissions by that year . . . an
aggressive program to limit global warming would mean restricting
emissions to approximately 4 GtC annually. Suppose the engineering
approach is correct that, 20 percent of emissions can be eliminated for
free. Such gains would still leave emissions at 16 GtC in the year 2100,
far above the 4-GtC ceiling needed to substantially curb the greenhouse
effect. The remaining cutbacks would have to be achieved through more
costly industrial reductions in energy availability beyond those achiev-
able through costless efficiency gains. In short, the “best practices”
school provides a basis for expecting that addressing the global warming
problem may be less costly than otherwise might be thought, but it by
no means warrants the conclusion that action will be costless over the
longer term (4).
5.5 Energy Conservation in Transportation
Transport activities account for about 30% of the energy used by final consumers,
and about 20% of the gross energy produced (9). About 98% of the total comes
from petroleum products refined into liquid fuels, and the remaining 2% is
provided by natural gas and electricity (3). Movement of people takes about 70%
of the total, and movement of freight about 30%. Within this sector, road transport
accounts for the largest proportion, over 80% in industrialized countries, with air
transport next, at 13% (9). According to the United Nations Fund for Population
Activities (29), the world car fleet increased by seven times between 1950 and
1980 while human population only doubled during that period. Fifteen percent of
the world’s oil is consumed by automobiles and light trucks in the United States
alone (Office of Technology Assessment, 1991, as cited in Ref. 4).
About 75% of all freight in the United States is carried by trains, barges,
ships, and pipelines, but because they are very efficient, they use only 12% of all
transportation fuel (3). The rapid increase in road transport in recent years is a
major contributor to the rise in oil demand. Further, motor vehicles are believed
to be responsible for 14% of all CO
2
derived from fossil fuel combustion (9),
along with their contribution to acid rain and other forms of air pollution such
as O
3
.
The Reagan administration relaxed automobile efficiency standards that had
already been met by Chrysler. If the regulations had been left in place, the amount
Copyright 2002 by Marcel Dekker, Inc. All Rights Reserved.
of gasoline saved in a decade or so would have been equivalent to the entire
amount of oil estimated to underlie the Arctic National Wildlife Refuge (23).
Gasoline prices in Europe and Japan are double or triple the U.S. price
because governments there impose levies that force consumers to consider and
internalize the full costs of their behavior (5). The gradual imposition of a
significantly higher gasoline tax, until the cost of gasoline in the United States is
comparable to that in Europe, would create a powerful incentive for people to
drive smaller, more fuel-efficient cars and use energy-efficient alternative forms
of transportation. Highways and bridges would last longer, and emissions would
be reduced, attenuating global warming and acid rain. This would, of course,
necessitate improvement of public transportation to accommodate people who
could no longer afford to drive to work; some of the gas-tax funds could be set
aside for this. In the United States, mass transport accounts for only 6% of all
passenger travel; in Germany the figure is over 15% and in Japan it is 47% (9).
Another possibility for internalization of the many hidden costs of driving
would be the implementation of an insurance program based on the average
number of miles a driver travels. This would link a portion of drivers’ insurance
programs to the number of miles they drive and collect payments at the gas pump
(12). Ledbetter and Ross (11) provide the details of such an arrangement:
The price of gasoline at the pump could include a charge for basic,
driving-related automobile insurance that would be organized by state govern-
ments and auctioned in blocks to private insurance companies. All registered
drivers in the state could automatically belong. Supplementary insurance above
that provided by the base insurance purchased at the pump could be indepen-
dently arranged, as we presently do for all our insurance. For example, owners of
expensive cars, or people who desire higher levels of liability coverage, could
purchase supplemental insurance. Drivers with especially bad driving records
could be required to purchase supplemental liability insurance. Below are some
of the advantages of such an arrangement.
Insurance costs become much more closely tied to the amount of driving
alone. The more miles a person drives, the more insurance he or she pays.
Since accident exposure is closely correlated with miles driven, the
proposed system would be more fair than the present system, in which
people who drive substantially less than the average miles per year are
given only small discounts, and people who drive substantially more than
the average don’t pay any additional premium.
If insurance were part of the cost of gasoline, a person could not drive
without paying for insurance. Uninsured motorists would be brought into
the system, substantially lowering the cost of driving for insured motor-
ists: in California for example, uninsured motorists increase premiums
for insured motorists by about $150 per year.
Copyright 2002 by Marcel Dekker, Inc. All Rights Reserved.
The apparent cost of gasoline at the pump would rise substantially, roughly
50 cents to a dollar per gallon. Such a price rise would encourage the
purchase of more fuel-efficient vehicles and help slow the growth in
vehicle miles of travel. For consumers, the increase in the price of fuel
would be offset by a decrease in the annual insurance premium motorists
would pay directly to insurance companies, resulting in no net increase
in driving costs.
Unlike a gasoline tax, this system would not be regressive: many low-
income persons drive substantially less miles per year than their higher-
income counterparts. They would, therefore, see a substantial drop in the
money they pay for auto insurance (11).
5.5.1 Efficiency Issues in Transportation
The efficiency of a motor vehicle is a function of several factors (Table 3).
Typically, about 80% of the fuel used in a representative vehicle traveling over a
mix of urban, rural, and highway routes is unproductive energy spent in overcom-
ing internal friction in auxiliary items and in thermodynamic losses in the engine
(9). Improvements in vehicle design and alternative fuels can have a major impact
in improving efficiency and reducing emissions. However, much of the forward
momentum achieved in the decade prior to 1985 has slowed in response to
downward oil price movements and apparent consumer preferences (9).
The inherent efficiency of the internal combustion engine began to ap-
proach its limits in the 1960s. Engines built since then range from 34% efficiency
for spark-ignition automobile-type engines under optimum load/speed conditions
to about 42% for large marine-type and direct-injection diesels. The difference is
attributable to the higher compression ratios, lower throttle losses and improved
direction injection achievable in large diesels.
In practice, however, optimum load/speed conditions are never achieved.
The energy efficiency of a vehicle operating in traffic, with variable speeds and
TABLE 3 Factors Affecting a Motor Vehicle’s Fuel Efficiency
Factor Components
Design Weight
Efficiency
Frictional losses
Aerodynamics
Use Effectiveness of use in transporting
materials and people
Typical operational cycle Length of journey
Traffic conditions
Copyright 2002 by Marcel Dekker, Inc. All Rights Reserved.
loads, is at least 30% lower. Short journeys, when the engine is cold at start-up
and never warms up sufficiently for optimal fuel combustion, create suboptimal
fuel use and high emissions. Stop/start conditions in heavy traffic also cause
relatively high fuel use and emissions (9).
Engine efficiency is further reduced, often by an additional 30% or so,
by the carrying of oil pumps, air pumps, fuel pumps, electrical systems, heat-
ing, air conditioning, and other related equipment. Friction and viscosity losses
in the vehicle’s drive train—e.g., in automatic transmissions, which alone can
reduce engine efficiency by 10–15%, cut efficiency still further. As a result, the
average thermodynamic efficiency of the motor vehicle is only between 10%
and 17%.
Nevertheless, significant improvements in automobile fuel economy have
been achieved in recent years. The biggest gains have been made by cutting down
on excess weight in the body, improving aerodynamics, and improving tires. Still,
the “payload efficiency” of a medium-sized car is only about 10%, while that of
fully loaded commercial aircraft is around 30–35%. Heavy-duty trucks, freight
trains, and ships also achieve greater payload efficiencies than cars (9).
Raising the average fuel efficiency of the U.S. car and light truck fleet by
1 mpg would cut oil consumption about 295,000 bbl per day. In one year, this
would equal the total amount the Interior Department hopes to extract from the
Arctic National Wildlife Refuge in Alaska (3). Increased fuel efficiency can
be supplemented by savings from transportation management, including in-
creased mass transit, carpooling, and improved maintenance (including proper
tire inflation) (4).
5.6 Increased Exploitation of Natural Gas
Increased exploitation of natural gas in preference to coal or oil as an interim
measure has the potential to slow global warming as non-hydrocarbon primary
energy sources are developed and put into place. Natural gas provides about
one-fifth of global commercial energy and is our most efficient “traditional”
energy source. Only about 10% of its energy content is lost in shipping and
processing, since it moves by pipelines and usually needs very little refining.
Ordinary gas-burning furnaces are about 75% efficient, and high-economy fur-
naces can be as much as 95% efficient (3). It generates fewer pollutants than any
other traditional fuel and less CO
2
as well: 42% less than coal and 30% less than
oil (5).
According to Gibbons et al. (5), some analysts feel that the most promising
future option for electric power generation is the aeroderivative turbine, which is
based on jet engine designs and burns natural gas. With additional refinement,
this technology could raise conversion efficiency from its present 33% to more
than 45%.
Copyright 2002 by Marcel Dekker, Inc. All Rights Reserved.
North America has a pipeline network for delivering natural gas to market.
However, most countries cannot afford a pipeline network, and much of the
natural gas that comes out of the ground in conjunction with oil pumping is
simply burned (flared off), a terrible waste of a valuable resource (3).
Natural gas is quite easy to ship through pipelines as long as it is going
from one place to another on the same continent. The problem is that much of
the gas is in Russia or the Middle East, while the markets are in Europe, Japan,
or North America. One way of shipping gas across oceans is to liquefy it by
cooling it below its condensation point (–140˚C). Liquefied natural gas (LNG)
has only 1/600 the volume of the gaseous form, and is therefore economical to
transport by tanker ship. However, if a very large LNG tanker had an accident
and blew up, it would release as much energy as several Hiroshima-sized atomic
bombs (3).
5.7 Increased Exploitation of Passive Technologies
Because most paved surfaces, and the surfaces of most buildings, tend to retain
and release more heat than is true of vegetated areas, and because heating and air
conditioning equipment releases/generates a great deal of heat, urban areas
typically are several degrees warmer than vegetated areas. For example, an early
study of this subject showed downtown St. Louis to be 13˚F warmer in the winter
and 9˚F warmer in June than the large, tree-canopied Forest Park, 5 miles away.
Tree cover can moderate this “heat island effect,” helping to control micro-
climate in three different ways:
1. Absorption and reflection of solar radiation. A tree in full leaf intercepts
between 60% and 90% of the radiation that strikes it, depending on the
density of its canopy. Clusters of trees spaced closely together can
therefore reduce ambient summer temperature significantly. Placed
directly adjacent to buildings on the east, west, and south sides, they
can reduce incoming solar radiation in the summer and, if deciduous,
allow most of it to pass through in the winter, when a deciduous tree
intercepts only 25–50%.
2. Creation of a “still zone” under the canopy. Around the edges of a tree
canopy is a band of air turbulence where the cooler air within and the
warmer outside air meet and mix. This turbulent zone appears to form
a containing frame for the still, cool air beneath the canopy.
3. Release of cooling water vapor from their leaf surfaces through evap-
oration and transpiration (19).
A study of a mobile home in Florida showed that well-placed plantings
could reduce cooling costs by more than 50% (Hutchinson et al., 1983, as cited
in Ref. 19). Calculations of electrical energy saved by tree planting suggest that
Copyright 2002 by Marcel Dekker, Inc. All Rights Reserved.