Handbook Of Pollution Control And Waste Minimization - Chapter 17 pptx
Bạn đang xem bản rút gọn của tài liệu. Xem và tải ngay bản đầy đủ của tài liệu tại đây (647.82 KB, 23 trang )
17
Risk-Based Pollution Control and
Waste Minimization Concepts
Gilbert J. Gonzales
Los Alamos National Laboratory, Los Alamos, New Mexico and
New Mexico State University, Las Cruces, New Mexico
1 INTRODUCTION
Ecological risk assessment is defined as “the qualitative or quantitative appraisal
of impact, potential or real, of one or more stressors (such as pollution) on flora,
fauna, or the encompassing ecosystem.” The underlying principles behind risk
reduction and integrated decision making that are detailed in U.S. Environmental
Protection Agency (EPA) strategic initiatives and guiding principles include
pollution prevention (1). Pollution control (PC) and waste minimization (WM)
are probably the most effective means of reducing risk to humans and the
environment from hazardous and radioactive waste. Pollution control can be
defined as any activity that reduces the release to the environment of substances
that can cause adverse effects to humans or other biological organisms. This
includes pollution prevention and waste minimization. Waste minimization is
defined as pollution prevention measures that reduce Resource Conservation and
Recovery Act (RCRA) hazardous waste (2). Reduced risk is one benefit of these
practices, and it results most directly from lower concentrations of contaminants
entering the environment from both planned and accidental releases.
Copyright 2002 by Marcel Dekker, Inc. All Rights Reserved.
Although it is difficult to quantify the reductions in the release of contam-
inants to the environment that have resulted from reductions in waste, the
reductions have most assuredly reduced risk to humans and the environment
posed by toxicants. Using examples from Los Alamos National Laboratory
(LANL), we will discuss the interrelatedness of pollution prevention/waste min-
imization with risk reduction and how risk assessment can be generally applied
to the field of pollution prevention and waste minimization. While emphasis in
this chapter is on “ecological risk assessment,” the concepts and principles can
also be applied to human health risk assessment. For purposes of this chapter,
distinction is not made between pollution prevention, waste minimization, re-
cycling or other waste management techniques, and other related terms. Rather,
emphasis is on source reduction, which includes any practice that reduces the
amount of contaminant entering a waste stream or the environment.
It is evident that the EPA’s hierarchy of general pollution prevention and
waste minimization methods is implicitly related to risk reduction (2). The
preferred method, source reduction, results in the greatest reduction in human and
ecological risk from contaminants. Source reduction is followed in effectiveness
by recycling, treatment, and disposal. While it is possible, depending on the
technology used, that recycling and treatment may increase risk to worker health
because of increases in contact handling of waste, the prioritized list (source
reduction → recycling → treatment → disposal) generally results in a decrease
in risk to the public and the environment as one progresses from the least
preferred to the most preferred method. The reason for this is simple. The
preferred method results in little, if any, release of contaminants into the environ-
ment compared to the less preferred methods; with the less preferred methods,
not only does the quantity of contaminants potentially released into the environ-
ment increase, the potential to release them increases. With this premise, it is then
important to realize the magnitude of risk reduction achieved by employing
pollution prevention and waste minimization at facilities such as LANL.
2 SITE DESCRIPTION AND CHARACTERIZATION
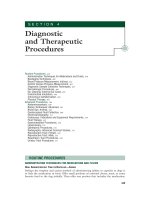
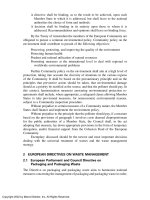
LANL is located in north-central New Mexico, approximately 60 miles northwest
of Santa Fe (Figure 1). LANL is a U.S. Department of Energy-owned complex
managed by the University of California that was founded in 1943 as part of the
Manhattan Project to create the first nuclear weapon. Since then, LANL’s mission
to design, develop, and test nuclear weapons has expanded to other areas of
nuclear science and energy research.
The Laboratory comprises dozens of individual technical areas located on
43 square miles of land area; about 1400 major buildings and other facilities are
part of the Laboratory. The Laboratory is situated on the Pajarito Plateau, which
consists of a series of fingerlike mesas separated by deep east-to-west–oriented
Copyright 2002 by Marcel Dekker, Inc. All Rights Reserved.
RIO ARRIBA COUNTY
SANTA FE COUNTY
0 0.5 1 2 mi
0 0.5 1 2 km
SANTA FE COUNTY
SANDO-
VAL CO.
SANDOVAL COUNTY
LOS ALAMOS COUNTY
SANDOVAL COUNTY
WHITE
SANTA FE
NATIONAL
FOREST
S
A
N
T
A
F
E
N
A
T
I
O
N
A
L
F
O
R
E
S
T
BANDELIER
NAT. MON.
SAN ILDEFONSO
PUEBLO LANDS
Rio Grande
★
Taos
Los Alamos
Grants
Albuquerque
Socorro
Las Cruces
Santa Fe
NEW MEXICO
To
Espanola
To
Santa Fe
LOS ALAMOS
COUNTY
LOS ALAMOS COUNTY
RIO ARRIBA COUNTY
TAOS
COUNTY
SANDOVAL
COUNTY
SANTA
FE
COUNTY
BERNALILLO
COUNTY
Tierra Amarilla
Taos
Los Alamos
Santa Fe
Bernalillo
Albuquerque
LOS ALAMOS
COUNTY
Pajarito R
oad
East Jemez Road
Los Alamos National Laboratory
Technical Area boundaries
County boundaries
Other political boundaries
Major paved roads
ROCK
NM
CO
UT
AZ
TX
OK
cARTography by A. Kron 4/5/00
BANDELIER
NATIONAL MONUMENT
N
4
4
30
4
502
502
502
501
4
U. S. A.
LOS ALAMOS
FIGURE 1 Location of the Los Alamos National Laboratory.
Copyright 2002 by Marcel Dekker, Inc. All Rights Reserved.
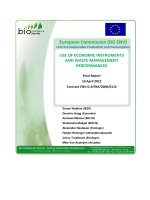
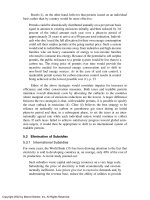
canyons cut by intermittent streams (Figure 2). Mesa tops range in elevation from
approximately 7800 ft on the flanks of the Jemez Mountains to about 6200 ft at
their eastern termination above the Rio Grande.
Researchers at Los Alamos work on initiatives related to the Laboratory’s
central mission of enhancing global security as well as on basic research in a
variety of disciplines related to advanced and nuclear materials research, devel-
opment, and applications; experimental science and engineering; and theory,
modeling, analysis, and computation. As a fully functional institution, LANL also
engages in a number of related activities including waste management; infrastruc-
ture and central services; facility maintenance and refurbishment; environmental,
FIGURE 2 Overhead view of the topography in and around the Los Alamos
National Laboratory.
Copyright 2002 by Marcel Dekker, Inc. All Rights Reserved.
ecological, cultural, and natural resource management; and environmental resto-
ration, including decontamination and decommissioning. As result of the scien-
tific and technical work conducted at Los Alamos, the Laboratory generates,
treats, and stores hazardous, mixed, and radioactive wastes.
About 2120 contaminant potential release sites (PRSs) have been identified
at LANL. The LANL PRSs are diverse and include past material disposal areas
(landfills), canyons, drain lines, firing sites, outfalls, and other random sites such
as spill locations. Categorizing contaminants into three types—organics, metals,
and radionuclides—Los Alamos has all three present. The contaminants include
volatile and semivolatile organics, polychlorinated biphenyls (PCBs), asbestos,
pesticides, herbicides, heavy metals, beryllium, radionuclides, petroleum prod-
ucts, and high explosives (3). The primary mechanisms for potential contaminant
release from the site is surface-water runoff carrying potentially contaminated
sediments and soil erosion exposing buried contaminants. The main pathways by
which released contaminants can reach off-site residents are through infiltration
into alluvial aquifers, airborne dispersion of particulate matter, and sediment
migration from surface-water runoff. Like many other sites, the predominant
pathway by which contaminants enter terrestrial biological systems is the inges-
tion of soil, intentional or not.
Diverse topography, ecology, and other factors make the consideration of
issues related to contamination in the LANL environment complex. “Since 1990,
LANL’s environmental restoration project has conducted over 100 cleanups. The
environmental restoration project has also decommissioned over 30 structures and
conducted three RCRA closure actions during this period. Schedules have been
published for the planned cleanup of approximately 700 to 750 additional sites.
This schedule encompasses a period of about 10 years, beginning with fiscal year
1998. The number of cleanups per year varies from approximately 100 in fiscal
year 2002 to 18 in fiscal year 2008. An important and integral part of this
pollution prevention technology and of identifying interim protection measures is
ecological risk assessment” (3).
3 POLLUTION PREVENTION AND WASTE MINIMIZATION
AT LANL
The pollution prevention program at the Laboratory has been successful in
reducing overall LANL wastes requiring disposal by 30% over the last 5 years.
The program is site wide but has facility-specific components, especially for the
larger generators of radioactive and hazardous chemical wastes. Past reductions
indicate that waste generation in the future should be less than that projected. The
Site Pollution Prevention Plan for Los Alamos National Laboratory (4) describes
the LANL Pollution Prevention and Waste Minimization Programs, including a
general program description, recently implemented actions, specific volume
Copyright 2002 by Marcel Dekker, Inc. All Rights Reserved.
reductions resulting from recent actions, and current development/demonstration
efforts that have not yet been implemented.
More specifically, LANL has achieved reductions in the generation of
hazardous waste, low-level radioactive waste (LLW), and mixed LLW. These and
two other waste types are defined as follows:
Hazardous waste—Any substance containing waste that is regulated by
RCRA, the Toxic Substances Control Act, and New Mexico as a Special
Waste.
Low-level radioactive waste (LLW)—Radionuclide-containing substances
with a radionuclide activity (sometimes referred to as concentration) of
less than 100 nCi/g.
Mixed LLW—Substances containing both RCRA constituents and LLW.
Transuranic radioactive (TRU) waste—Radionuclide-containing substances
with a radionuclide activity (concentration) equal to or greater than
100 nCi/g.
Mixed TRU waste—Substances containing both RCRA and TRU waste.
Estimated reduction rates of chronically generated waste, by waste type,
over a 6-year period are (D. Wilburn, personal communication, 2000)
Hazardous waste: 11%/yr (65% from 1993 to 1999)
LLW: 11%/yr (67% from 1993 to 1999)
Mixed LLW: 12%/yr (72% from 1993 to 1999)
Production of TRU and mixed TRU waste combined has increased by an
average of 38%/yr (228% from 1993 to 1999).
The Laboratory has dozens of pollution prevention projects ongoing and
planned. Some of the efforts are pollution prevention and waste minimization in
the strictest sense and some (e.g., separation of waste types or satellite treatment
followed by centralized treatment) are pollution control in the broadest sense,
including efforts where cost savings is the primary goal and pollution control is
a secondary benefit. Three examples of pollution control/waste minimization at
LANL follow.
Generator Set-Aside Fee-Funded (GSAF) Plutonium Ingot Storage Cubicle
Project. “An aliquot casting and blending technique is under imple-
mentation at LANLs Plutonium Facility. The aliquot process allows
out-of-specification plutonium to be blended with other plutonium so that
the final mixed batch meets specifications and is uniform. This avoids
the cost and waste generation related to reprocessing out-of-specification
plutonium ingots through the nitric acid line. In addition the more
uniform product will reduce the reject rate and will avoid reprocessing
and remanufacturing wastes. This project will fabricate a storage system
Copyright 2002 by Marcel Dekker, Inc. All Rights Reserved.
with 20 cubicles. It is expected that 12.5 m
3
of TRU waste can be avoided
over the 25 year life of the cubicle system. This project has an estimated
100% return on investment when prior investments are included in the
base project cost. This project is the final step necessary to achieve
aliquot blending. The GSAF program is funding purchase of the storage
cubicle and the operating group has programmatic support for installing
and qualifying the cubicle.”
GSAF Reduction of Acid Waste and Emissions. “The Laboratory’s Analyti-
cal Chemistry Sciences Group’s performance of analytical services at one
of the Laboratory’s technical areas requires the dissolution of up to
20,000 samples per year. The current process is hot plate digestion which
requires large quantities of chemicals, mostly acids, and results in the
volatilization and release to the atmosphere of 90% of those chemicals.
The yearly consumption of HNO
3
, HCl, HF, HClO
4
and NH
4
OH is
estimated to be 3395 kgs. About 3095 kgs of these chemicals are
volatilized and become air emissions from the stacks; the balance is
diluted and discharged to the Laboratory’s Radioactive Liquid Waste
Treatment Facility via the LLW acid line. The stack emissions constitute
about 30% of the Laboratory’s annual hazardous air pollutant discharges.
By switching to a microwave and muffle furnace oven process, annual
consumption of the chemicals listed above can be reduced to about 370
kgs, an 89% reduction. It is estimated that implementing the new process
will reduce the Laboratory’s hazardous air pollution discharges by three
tons. The estimated return on investment for this project is 82%.”
Waste Minimization and Microconcentric Nebulization for Inductively Cou-
pled Plasma-Atomic Emission Spectroscopy. “One of the most popular
techniques for multi-element analysis is inductively coupled plasma
atomic emission spectroscopy (ICP-AES). The most common method of
introducing samples into the ICP torch is pneumatic nebulization. The
standard nebulizers, in conjunction with typical spray chambers, exhibit
very low transport efficiency. Because of this inefficiency the ICP-AES
generates almost a liter per day of rinse water that consists primarily of
dilute nitric acid mixed with other contaminants. The other contaminants
can be TRU waste, LLW, mixed LLW or hazardous waste depending on
the samples analyzed. Under this project an existing microconcentric
nebulizer will be deployed with the ICP-AES and optimized for analysis
of trace elements in a variety of plutonium-containing matrices. It is
expected that using an optimized microconcentric nebulizer will reduce
the daily rinse water from the spray chamber drain to about 50 ml. This
represents a 95% or 200 l/yr reduction in the volume of waste requiring
disposal. A 50 liter per year reduction in LLW plastic sample containers
is expected. Reducing the volume of samples in the glovebox will
Copyright 2002 by Marcel Dekker, Inc. All Rights Reserved.
simplify the ICP-AES operation, reducing various risk parameters. The
return on investment ranges from 10–50%.”
4 ECOLOGICAL RISK ASSESSMENT
Ecological risk assessment is defined as “the qualitative or quantitative appraisal
of impact, potential or real, of one or more stressors (such as pollution) on flora,
fauna, or the encompassing ecosystem.” The Laboratory is employing the EPA’s
iterative and tiered approach to ecological risk assessment whereby less complex
assessments with greater conservatism and uncertainty are employed first, fol-
lowed by the advancement of potential problem areas and contaminants to
progressively more complex and realistic assessments with lower uncertainty. The
purpose of this section is not to present ecological risk assessment methods, as
there are many excellent sources on this subject (5–8). Rather, the purpose is to
introduce concepts in ecological risk assessment that could be considered in
designing pollution control and waste minimization programs.
4.1 History at the Los Alamos National Laboratory
Ecological risk assessment (“ecorisk”) at the Laboratory is a work in progress.
Methods for ecorisk screening and “tier 2” assessments have been in development
and implementation since approximately 1993. Most screenings and assessments
completed at the Laboratory thus far are based on the U.S. EPA hazard quotient
method, whereby hazard quotient values are calculated for receptors for each
contaminant by area and may be thought of as a ratio of a receptor’s exposure at
the site to a safe limit or benchmark:
HI
i
=
∑
j=1
n
HQ
ij
(1)
where
HI
i
is the hazard index for receptor I to n contaminants of potential concern
(COPCs), and
HQ
ij
=
exposure
ij
safe limit
ij
(2)
where
HQ
ij
is the hazard quotient for receptor I to COPC j
exposure
ij
is the dose to receptor i for COPC j
safe limit is an effects or no effects level, such as a chronic no-observed-
adverse-effects level (NOAEL)
Copyright 2002 by Marcel Dekker, Inc. All Rights Reserved.
4.1.1 Screening
In 1995 a very conservative method for screening contaminants and contaminated
areas was developed (9). The method involved the selection of ecological
endpoints that focused on animal feeding guilds, a listing of candidate contami-
nants, exposure/dose–response estimation, estimation of food and soil ingestion,
and risk characterization. A comparison value or safe limit was based on foraging
mode, behaviors, types of food consumed, the amount consumed, and NOAELs
or radiation dose limits when available. The safe limits for radionuclides were
largely laboratory-derived rat-based values used in human risk assessments.
As such, this and the use of other conservative factors or assumptions resulted in
a method that likely overestimated potential risk by orders of magnitude, espe-
cially for radionuclides. At least one application of the method is known to have
occurred (10).
Currently at LANL, ecorisk screening encompasses qualitative “scoping
evaluation” as the basis of problem formulation and “screening evaluation” to
identify contaminants of potential concern (COPCs) by exposure media. The
screening evaluation focuses on identifying sites that require further investigation
and risk characterization (11). A key component to the screening evaluation, and
one of interest to PC/WM, is the ecological screening level (ESL) concept. An
ESL is basically a contaminant safe limit, or acceptable effects level, below which
measurable effects are not expected. ESLs are most useful in units of contaminant
amount per quantity of soil, so that measurements of contaminant levels in soil
can be quickly and directly compared. The ESLs are developed for each ecolog-
ical receptor of interest, each chemical, and are media specific. They are deter-
mined so that if an area has levels of a chemical above the ESL in any medium,
then the area is deemed to pose a potentially unacceptable risk to ecological
receptors. Calculations of ESLs require toxicity information, including toxicity
reference values (TRVs), preferably chronic NOAELs, and knowledge of transfer
coefficients including bioconcentration and bioaccumulation factors. Details on
this information and on the process for calculating and selecting ESLs are
documented in a LANL report (11); however a summary is provided here.
Nonradionuclides. “Although soil ESLs are based on exposure of terres-
trial receptors—plants, invertebrates (earthworms), and wildlife—they are deter-
mined differently for each receptor. The different approaches are required because
of the different ways that toxicological experiments are performed for these
organisms. For plants, earthworms and other soil-dwelling invertebrates, effects
are based on the concentration of a COPC in soil. Therefore, ESL values are
directly based on effects concentrations and modeling is not required. For plants
and invertebrates the soil ESL was ‘back-calculated’ from No-Observed-Effect-
Concentrations. Exposure to wildlife, however, is dependent on exposure of the
organism to a chemical constituent from a given medium (such as soil or
Copyright 2002 by Marcel Dekker, Inc. All Rights Reserved.
foodstuff) through direct and indirect means (i.e., ingestion, inhalation, and
dermal). Wildlife ESL values were based on the dietary regimen of the receptor,
including consumption of plants, invertebrates, and vertebrate flesh, with some
incidental soil ingestion (11).” The soil ESL was “back-calculated” as the soil
concentration of a COPC resulting from exposure to the NOAEL. Starting with
the EPA’s general terrestrial wildlife exposure model (12), inverting to convert
soil concentration to dose, relating food intake to soil intake, and solving for
COPC- and receptor-specific ESLs, models such as Eq. (3) for omnivores were
used to compute ESLs for nonradionuclides:
ESL
ij
=
NOAEL
ij
I
i
⋅(fs
i
+ fp
i
⋅ TF
plant,j
+ fi
i
⋅ TF
invert,j
(3)
where
ESL
ij
is the soil ESL for omnivore i and COPC j (mg/kg)
NOAEL
ij
is the NOAEL for omnivore i and COPC j (mg/kg/day)
fs
i
is the fraction of soil ingested by omnivore i, expressed as a fraction of
the dietary intake
I
i
is the normalized daily dietary ingestion rate for omnivore i (kg/kg/day)
fp
i
is the fraction of plants in diet for omnivore i
TF
plant,j
is a unitless transfer factor from soil to plants for COPC j
fi
i
is the fraction of invertebrates in diet for omnivore i
TF
insect,j
is a unitless transfer factor from soil to insects for COPC j
For any given COPC, the soil ESL used for initial screening was often the lowest
receptor-specific soil ESL value among plants, invertebrates, robin, kestrel,
shrew, mouse, cottontail, and fox. Models were developed for sediment and water.
More detail can be found in Ref. 11.
Radionuclides. Radionuclide dose limits are the equivalent of the
NOAELs used to develop nonradionuclide ESLs (11). For screening at LANL,
radionuclide ESLs were based on the International Atomic Energy Agency
(IAEA)-recommended dose limit of 0.1 rad per day (13). At LANL the radionu-
clide dose to terrestrial biota was taken as the sum of the dose from internally
deposited radionuclides and external dose from gamma emitting radionuclides in
soil [Eq. (4)].
Total acceptable dose = 0.1 (rad/day) = internal dose
+ external dose
(4)
Detailed formulas can be found in Ref. 11. Conservative assumptions about the
size of the organism, its diet, the geometry of the contaminated source, and the
location of the receptor relative to the contaminated source are used by LANL for
estimating internal and external doses for screening purposes. The internal dose
Copyright 2002 by Marcel Dekker, Inc. All Rights Reserved.
to wildlife is calculated by multiplying the effective energy of a radionuclide by
the body burden of that radionuclide in an organism. The external dose is the dose
coefficient for skin exposed to contaminated water or soil. Calculations for
estimating internal and external doses from radionuclides in soil can be found in
literature by Higley and Kuperman (14). At LANL, ESLs are developed sepa-
rately for plants and invertebrates versus wildlife, and decay and metabolic
elimination rates are incorporated (11).
4.1.2 Integration with Safety Analyses
In 1994 the Laboratory began a pilot project to develop an ecological risk
assessment method that could be used to augment hazards and safety analyses
(15). Specifically, the Laboratory explored the possiblity of using an ecological
risk assessment approach to explicitly incorporate environmental consequence
analysis into hazards analyses and probabilistic risk assessment processes. Inves-
tigators used a two-phase approach: (a) Using five COPCs, conservative eco-
logical screening was interacted with worst-case accident analysis results to
determine whether ecological impacts could be excluded from further investiga-
tion or would require more detailed assessment; (b) using a dynamic ecological
transport model (BIOTRAN), a more detailed and realistic assessment was
conducted of the land area that the screening process identified as most suscepti-
ble to potential adverse impacts from the five contaminants. BIOTRAN (now
BIOTRAN.2) is an ecological transport model used for predicting the flow of
organic and inorganic contaminants, including radionuclides, through simulated
ecosystems—which can include plant, animal, and human populations—using
biomass vectors (16). Twenty-two subroutines include variables of meteorol-
ogy, soil physics, hydrology, geology, plant and animal physiology, limnology,
radiation biology, ecology, epidemiology, risk analysis, and health physics.
“The results of the detailed assessment were consistent with the findings of the
screening assessment, thus validating the screening assessment approach in
the context of hazards analysis.”
4.1.3 Tier 2 Assessments
From 1997 to 1999, Gonzales et al. completed tier 2 preliminary ecological risk
assessments of federally protected threatened and endangered species (17–19).
Risk assessments of the Mexican spotted owl (Strix occidentalis lucida),
the American peregrine falcon (Falco peregrinus), the bald eagle (Haliaeetus
leucocephalus), and the Southwestern willow flycatcher (Empidonax traillii
extimus) were performed using a custom FORTRAN model, ECORSK.5, and the
geographic information system (GIS) (17–19). Using Eq. (5), estimated doses
resulting from soil ingestion and food consumption were compared against TRVs
for nonradionuclides and radiation dose limits for radionuclides. This generated
hazard indices (HIs) that included a measure of additive effects from multi-
Copyright 2002 by Marcel Dekker, Inc. All Rights Reserved.
ple contaminants (radionuclides, metals, and organic chemicals) and included
bioaccumulation and biomagnification factors.
HI =
I
f
/BW
∑
i=1
ncs
O
i
ENH
i ∑
j=1
ncoc
[F
s
+(1 − F
s
) BMF
j
] Cs
i,j
TRV
(5)
where
HI = hazard index, cumulative for all summed COPC hazard quotients
I
f
= food consumption, kgdwt/day
BW = body weight of organism, kgfwt
ncs = total number of nest sites
O
i
= occupancy factor for the ith feeding site
ENH
i
= enhancement factor for the ith feeding site
ncoc = total number of different COPCs found over all nesting sites
F
s
= % soil in diet
BMF
j
= biomagnification factor via food chain transport for the jth
contaminant
Cs
i,j
= COPC concentration of soil/sediment, mg/kgdwt, for the ith
feeding site and the jth COPC
TRV
j
= toxicity reference value (“safe limit”), mg/kg-body weight/day,
for the jth COPC
Other terms were sometimes included, such as calculating sediment intake from
prey data and inferring BMFs through differential equations.
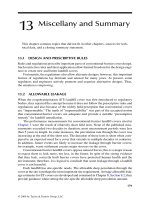
ECORSK.5 was used to integrate environmental contaminant data, species-
specific biological, ecological, and toxicological information, and GIS spatial
information as depicted in Figure 3. Using ECORSK.5, the risk assessor is able
to scale home ranges (HRs) so that a rectangular HR simulates foraging patterns
based on natural features such as topography or prey distribution. ECORSK.5 is
also coded to allow the option of weighting the simulated foraging process on an
exponential basis as based on the distance from randomly selected nest sites such
that a species forages more in the vicinity of its nest (or any other focal point)
than it does at the extremity of its HR. A second manner in which the simulated
foraging process is weighted in the tier 2 process is based on animal distribution
and other population data. For example, a GIS elk habitat use model based on
positions fed from radio collars via a Global Positioning System was used to
create an occupancy scheme whereby the amount of time spent foraging on any
one area is specified. Coding schemes identify home ranges, habitat core areas,
species, and occupancy weights.
ECORSK.5 generates information on risk by specific geographic location
for use in management of contaminated areas, species habitat, facility siting,
Copyright 2002 by Marcel Dekker, Inc. All Rights Reserved.
MAPCDE.DAT
INRSK.DAT
EEUINP.DAT
OUTRSK.DAT
ENTRSK.DAT
GIS.DAT
HQ.DAT
HQP.DAT
HQPC.DAT
HABIT.DAT
GRIDXY.DAT
HQPO.DAT
HQPCO.DAT
2-D and 3-D plots
GIS
EEU and NEST
coordinates
FIMAD
Contaminant
location and
concentration
Database
development
LOAEL/
NOAEL
toxicology
CONVRT
Species-
specific
input
ECORSK.5
Select
PLTRSK
FIGURE 3 Schematic respresenting the integration of ecological risk assess-
ment parameters by ECORSK.5.
Copyright 2002 by Marcel Dekker, Inc. All Rights Reserved.
and/or facility operations in order to maintain risk from contaminants at accept-
ably low levels. Several different levels of risk breakdown, from very summarized
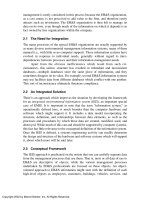
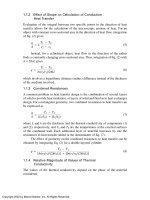
values to very detailed values, are generated by ECORSK.5. Figure 4 shows one
level of breakout, where the risk contribution by Aroclor-1254 from different
discrete locations in a HR is presented graphically. Thus, the strength of this
custom FORTRAN model is for animals with large individual home ranges or
populations with large distributions. ECORSK.5 is documented in an internal
report (20).
4.2 Ecorisk Assessments Applied
Results of the tier 2 assessments described above indicated a small potential for
impact to the peregrine falcon, but the studies concluded no appreciable potential
impact was expected to the Mexican spotted owl, the bald eagle, or the South-
western willow flycatcher. With all the hazardous substances used at the Labora-
tory over the years, including radionuclides, an application of a pesticide
unrelated to Laboratory operations 37 years ago resulted in the contaminant
that dominated the risk contribution for the peregrine falcon. In 1963,
dichlorodiphenyltrichloroethane (DDT) was applied to one-half million acres of
forest west of the Rio Grande at an application rate of about 140,000 ppm (21).
DDT and dichlorodiphenylethelyne (DDE), a DDT breakdown product, were two
of the three top contaminants in several modeling scenarios for the peregrine
falcon. Since this is currently a widely diffuse source that largely originated in
1963, PC/WM cannot be applied to this chemical, raising the point that not all
risk issues can be addressed in the design of a PC/WM program. Nevertheless,
the risk assessments summarized above also provide an example of how risk
information can be used to augment PC/WM activities as follows. The top three
contaminants, DDT, DDE, and a PCB mixture—Aroclor-1254—contributed a
total of 81% of the risk under conditions of one of several modeled foraging
scenarios. In part this resulted in a charter at the Laboratory to give added
emphasis to PCB pollution control (A. Jackson, personal communication, 2000).
The increased effort aims to
Adopt a PCB-free program for authorized sources as an institutional
sponsored program (consistent with Laboratory policy of zero environ-
mental incident)
Incorporate into the yearly budgetary exercise a schedule to replace PCB
items
Place greater division-level organizational emphasis on PCB-free facilities
Gain senior management endorsement of an approach to address PCB
vulnerabilities based on an ecological-risk concept as a coordinated
institutional program, i.e., as a Laboratory taking a leadership and
proactive role in working with regulators and the Department of Energy
Copyright 2002 by Marcel Dekker, Inc. All Rights Reserved.
0
30
60
75
81
87
93
99
105
111
117
129
150
165
191
197
203
209
215
221
227
233
255
285
0
25
50
61
70
85
125
0
0.05
0.1
0.15
0.2
0.25
0.3
0.35
0.4
0.45
0.5
Hazard Quotient
Grid cell column
Grid cell row
0.45-0.5
0.4-0.45
0.35-0.4
0.3-0.35
0.25-0.3
0.2-0.25
0.15-0.2
0.1-0.15
0.05-0.1
0-0.05
Nesting Habitat
FIGURE 4 Three-dimensional plot of ecological risk hazard quotient contributions for Aroclor-1254 by discrete location.
Copyright 2002 by Marcel Dekker, Inc. All Rights Reserved.
in arriving at a cost-effective and scientifically sound risk management
framework for decision making that meets performance goals and is
protective of the environment).
Implementing pollution controls such as those listed above is no small task
at a sprawling 43-mi
2
industrial site, and costs can be substantial. In the example
above, risk assessments helped focus field studies such that in the first year
following the completion of the assessments approximately $122,000 was saved
by targeting specific contaminants and omitting the analysis of those deemed
inconsequential from a risk perspective. Thus, the consideration of risk issues in
the design of PC/WM programs can improve the effectiveness and efficiency of
the programs.
As mentioned earlier, the Laboratory is employing the iterative and tiered
approach to ecological risk assessment whereby less complex assessments with
greater conservatism and uncertainty are employed first, followed by the advance-
ment of potential problem areas and COPCs to progressively more complex and
realistic assessments with lower uncertainty.
4.3 Risk-Based Prioritization of PC/WM COPC Targets
As discussed in the previous section, development of the ecorisk screening
method at LANL included the calculation of screening values termed ESLs.
Table 1 is a list of soil ESLs by contaminant in decreasing order (22). For each
contaminant ESLs were developed for eight terrestrial species. The values in
Table 1 are for the species that usually had the most stringent (lowest) ESL. ESL
values are still undergoing revision at LANL, but the relative rank is not expected
to change much.
Ecological screening levels are related directly to toxicity and expo-
sure, therefore ranking contaminants on the basis of ESL value gives some
indication of the contaminants, which if eliminated or reduced by PC/WM
techniques, would most effectively reduce risk to flora and fauna. However,
before prioritizing contaminants from a PC/WM perspective, one must also
consider other factors, some practical, such as the ubiquity of contaminants in
the environment because if a contaminant were quite toxic but was absent or
present at very low levels in the environment relative to its ESL, elimination
or reduction of the contaminant would gain little in terms of risk reduction.
For example, since 2,3,7,8-tetrachlorodibenzodioxin is ranked first in Table
1, thus can be considered relatively very toxic, a large degree of risk reduction
could be achieved by PC/WM efforts that minimize emissions or releases of
it into the environment. However, its presence in the environmental contaminant
database used in the threatened and endangered species assessments discussed
above was sparse, therefore it is not likely a good candidate for PC/WM
consideration.
Copyright 2002 by Marcel Dekker, Inc. All Rights Reserved.
TABLE 1 Examples of Ecological Screening Levels (ESLs) in Soil Used
for Screening-Level Ecological Risk Assessments at the Los Alamos
National Laboratory
Type
a
Name CAS no. ESL
b
Rank
dioxin/furan Tetrachlorodibenzodioxin[2,3,7,8-] 1746-01-6 1.80E-06 1
pest DDE[4,4′-] 72-55-9 1.80E-03 2
pest DDT[4,4′-] 50-29-3 2.80E-03 3
pcbs Aroclor-1248 12672-29-6 3.00E-03 4
pest Endrin 72-20-8 3.40E-03 5
inorg Mercury (methyl) 22967-92-6 1.60E-02 6
inorg Thallium 7440-28-0 3.30E-02 7
pest BHC[gamma-] 58-89-9 3.40E-02 8
pest Dieldrin 60-57-1 4.10E-02 9
inorg Mercury (inorganic) 7439-97-6 5.00E-02 10
pcbs Aroclor-1260 11096-82-5 5.00E-02 11
pcbs Aroclor-1254 11097-69-1 1.20E-01 12
svocs Di-n-butylphthalate 84-74-2 1.30E-01 13
he m-Dinitrobenzene 99-65-0 1.60E-01 14
pcbs Aroclor-1242 53469-21-9 1.60E-01 15
pest Kepone 143-50-0 1.60E-01 16
pest Heptachlor 76-44-8 1.80E-01 17
Inorg Silver 7440-22-4 2.00E-01 18
pahs Naphthalene 91-20-3 2.00E-01 19
svocs Bis(2-ethylhexyl)phthalate 117-81-7 2.40E-01 20
inorg Vanadium 7440-62-2 2.50E-01 21
he Trinitrotoluene[2,4,6-] 118-96-7 3.00E-01 22
svocs Pentachlorophenol 87-86-5 3.20E-01 23
inorg Chromium VI 18540-29-9 3.50E-01 24
pest Endosulfan 115-29-7 3.50E-01 25
inorg Antimony 7440-36-0 5.00E-01 26
inorg Selenium 7782-49-2 5.00E-01 27
inorg Cobalt 7440-48-4 5.10E-01 28
inorg Arsenic 7440-38-2 5.70E-01 29
he dinitrotoluene[2,6-] 606-20-2 7.40E-01 30
pest BHC[beta-] 319-85-7 9.70E-01 31
inorg Beryllium 7440-41-7 1.00E+00 32
inorg Cadmium 7440-43-9 1.00E+00 33
inorg Cyanide 57-12-5 1.00E+00 34
he HMX 2691-41-0 1.00E+00 35
vocs Xylenes 1330-20-7 1.10E+00 36
he dinitrotoluene[2,4-] 121-14-2 1.20E+00 37
svocs Chlorophenol[2-] 95-57-8 1.20E+00 38
pahs Benzo(a)pyrene 50-32-8 1.80E+00 39
Copyright 2002 by Marcel Dekker, Inc. All Rights Reserved.
TABLE 1 Continued
Type
a
Name CAS no. ESL
b
Rank
vocs Acetone 67-64-1 1.80E+00 40
vocs Trichloroethene 79-01-6 1.90E+00 41
pest Chlordane[alpha-] 5103-71-9 2.10E+00 42
pest Chlordane[gamma-] 5103-74-2 2.10E+00 43
he Tetryl 479-45-8 2.20E+00 44
pahs Dibenz(a,h)anthracene 53-70-3 2.30E+00 45
pahs Acenaphthene 83-32-9 2.50E+00 46
inorg Chromium, total 7440-47-3 3.10E+00 47
pcbs Aroclor-1016 12674-11-2 3.20E+00 48
pahs Benzo(a)anthracene 56-55-3 3.30E+00 49
pahs Chrysene 218-01-9 3.30E+00 50
vocs Trichlorobenzene[1,2,4-] 120-82-1 3.50E+00 51
svocs Chloro-3-methylphenol[4-] 59-50-7 3.60E+00 52
vocs Tetrachloroethene 127-18-4 3.80E+00 53
he 4-amino-2,6-dinitrotoluene 19406-51-0 4.20E+00 54
inorg Aluminum 7429-90-5 5.00E+00 55
inorg Manganese 7439-96-5 5.00E+00 56
inorg Uranium 7440-61-1 5.00E+00 57
he o-Nitrotoluene 88-72-2 5.00E+00 58
he RDX 121-82-4 5.10E+00 59
inorg Boron 7440-42-8 5.70E+00 60
pahs Methylnaphthalene[2-] 91-57-6 5.90E+00 61
he 2-amino-4,6-dinitrotoluene 35572-78-2 6.10E+00 62
he m-Nitrotoluene 99-08-1 6.10E+00 63
vocs Methylene chloride 75-09-2 6.60E+00 64
he sym-Trinitrobenzene 99-35-4 7.00E+00 65
pahs Benzo(b)fluoranthene 205-99-2 7.40E+00 66
svocs Phenol 108-95-2 7.90E+00 67
svocs Benzoic acid 65-85-0 8.20E+00 68
pest Methoxychlor[4,4′-] 72-43-5 8.40E+00 69
svocs Pentachloronitrobenzene 82-68-8 8.80E+00 70
inorg Zinc 7440-66-6 1.00E+01 71
he p-Nitrotoluene 99-99-0 1.10E+01 72
pest Toxaphene 8001-35-2 1.10E+01 73
pahs Benzo(g,h,i)perylene 191-24-2 1.20E+01 74
pahs Indeno(1,2,3-cd)pyrene 193-39-5 1.20E+01 75
vocs Dichlorobenzene[1,4-] 106-46-7 1.20E+01 76
inorg Copper 7440-50-8 1.30E+01 77
pahs Benzo(k)fluoranthene 207-08-9 1.30E+01 78
svocs Nitrobenzene 98-95-3 1.40E+01 79
pahs Pyrene 129-00-0 1.50E+01 80
rad Americium-241 86954-36-1 1.70E+01 81
Copyright 2002 by Marcel Dekker, Inc. All Rights Reserved.
Type
a
Name CAS no. ESL
b
Rank
rad Plutonium-238 13981-16-3 1.70E+01 82
rad Thorium-228 14274-82-9 1.70E+01 83
rad Plutonium-239/240 15117-48-3 1.80E+01 84
rad Neptunium-237 13994-20-2 1.90E+01 85
rad Thorium-229 15594-54-4 1.90E+01 86
inorg Fluoride 16984-48-8 2.00E+01 87
inorg Lead 7439-92-1 2.00E+01 88
inorg Nickel 7440-02-0 2.00E+01 89
rad Radium-226 13982-63-3 2.00E+01 90
rad Thorium-230 14269-63-7 2.00E+01 91
rad Uranium-233 13968-55-3 2.00E+01 92
rad Uranium-234 13966-29-5 2.00E+01 93
rad Uranium-235 15117-96-1 2.10E+01 94
rad Uranium-236 13982-70-2 2.10E+01 95
rad Uranium-238 7440-61-1 2.20E+01 96
inorg Barium 7440-39-3 2.30E+01 97
rad Thorium-232 7440-29-1 2.30E+01 98
svocs Chlorobenzene 108-90-7 2.40E+01 99
pahs Fluoranthene 206-44-0 2.60E+01 100
pahs Fluorene 86-73-7 2.90E+01 101
vocs Chloroform 67-66-3 3.20E+01 102
vocs Tetrachloroethane[1,1,2,2-] 79-34-5 3.90E+01 103
svocs Dibenzofuran 132-64-9 6.10E+01 104
vocs Benzene 71-43-2 6.60E+01 105
vocs Toluene 108-88-3 7.10E+01 106
inorg Titanium 7440-32-6 7.20E+01 107
vocs Dichloroethylene[1,1-] 75-35-4 7.60E+01 108
vocs Dichloroethylene[1,2-] 540-59-0 9.20E+01 109
pahs Phenanthrene 85-01-8 1.10E+02 110
svocs Dimethylphthalate 131-11-3 1.30E+02 111
he Nitrogylcerin 53-63-0 1.50E+02 112
pahs Acenaphthylene 208-96-8 1.60E+02 113
svocs Di-n-octylphthalate 117-84-0 1.60E+02 114
inorg Strontium 7440-24-6 1.90E+02 115
pahs Anthracene 120-12-7 2.20E+02 116
rad Strontium-90 + Yttrium-90 10098-97-2 2.80E+02 117
svocs Butyl benzyl phthalate 85-68-7 3.40E+02 118
rad Plutonium-241 14119-32-5 3.70E+02 119
rad Cobalt-60 10198-40-0 4.10E+02 120
rad Europium-152 14683-23-9 4.20E+02 121
rad Cesium-134 13967-70-9 4.90E+02 122
rad Lead-210 14255-04-0 5.10E+02 123
Copyright 2002 by Marcel Dekker, Inc. All Rights Reserved.
Another practical consideration is the source type of a PC/WM candidate
constituent, i.e., a point source versus diffuse. Obviously, point-source contami-
nants are subject to PC/WM and diffuse sources typically are not. For example,
DDT and DDE rank high in terms of toxicity as measured by its safe limit, or
ESL (Table 1), and as measured in potential risk to threatened and endangered
species at Los Alamos (17); however, the predominant source at the Laboratory
was aerial spraying in the 1960s (20).
Seven of the 10 most stringent ESLs in Table 1 are for organic contami-
nants. This is consistent with the results of ecorisk screening and ecological risk
assessments and related studies that have been completed to date at LANL. The
assessments and studies have begun to demonstrate that organic contaminants
dominate risk to nonhuman organisms, and radionuclides are of less concern
(17–19, 23). Thus, for purposes of reducing ecological risk from contaminants, it
may be that the largest gains in risk reduction (ignoring other factors) can be
achieved by targeting a category or group of contaminants as a priority.
TABLE 1 Continued
Type
a
Name CAS no. ESL
b
Rank
rad Cesium-137 + Barium-137 5.50E+02 124
vocs Dichloroethane[1,1-] 75-34-3 7.30E+02 125
vocs Butanone[2-] 78-93-3 9.50E+02 126
rad Sodium-22 13966-32-0 1.00E+03 127
vocs Trichloroethane[1,1,1-] 71-55-6 2.80E+03 128
he PETN 78-11-5 1.40E+04 129
rad Tritium 10028-17-8 2.10E+04 130
rad Radium-228 15262-20-1 3.50E+04 131
inorg Calcium 7440-70-2 n/a 132
inorg Chloride 16887-00-6 n/a 133
inorg Iron 7439-89-6 n/a 134
inorg Lithium 7439-93-2 n/a 135
inorg Magnesium 7439-95-4 n/a 136
inorg Molybdenum 7439-98-7 n/a 137
inorg Potassium 7440-09-7 n/a 138
inorg Sodium 7440-23-5 n/a 139
svocs Carbazole 86-74-8 n/a 140
vocs Dichloroethane[1,2-] 107-06-2 n/a 141
a
he, high explosives; inorg, inorganic; pahs, polycyclic aromatic hydrocarbons; pcbs,
polychlorobiphenyls; pest, pesticide; rad, radionuclide; vocs, volatile organic carbons;
svocs, semivolatile organic carbons.
Copyright 2002 by Marcel Dekker, Inc. All Rights Reserved.
In summary, risk-related factors that should be considered in designing a
PC/WM program include
Contaminant risk rank
Contaminant ubiquity
Contaminant source and date of origin
There are factors additional to the three above that can influence the effectiveness
of prioritization of PC/WM efforts but that are inherent in the above three. For
example, in addition to toxicity, contaminant risk ranks that are based on ESLs
inherently consider the potential for a contaminant to bioaccumulate (soil-to-first-
level transfer) or biomagnify (food-chain transfer). This is true because ESLs are
derived from safe limits using transfer coefficients that include bioaccumulation
and biomagnification factors for those contaminants that exhibit this tendency.
Another example of a factor inherently included in ESL-based risk ranking is the
amount of soil ingested by an organism. Soil ingestion is an important route of
exposure to environmental contaminants for wildlife (24).
5 CONCLUSION
Pollution control and waste minimization can be used to effectively minimize or
eliminate risk to humans and the environment. Using the Los Alamos National
Laboratory as a case study, concepts have been introduced at the rudimentary
level that may serve as “seeds” that enable practitioners to further increase the
effectiveness of pollution control and waste minimization programs in minimiz-
ing or eliminating risk. Numerous factors, some practical and some technical,
must be considered when attempting to design holistic pollution control and waste
minimization programs. Indices of risk used to rank contaminants that are targeted
for elimination or reduction by pollution control/waste minimization techniques
can be used effectively to reduce risk to flora and fauna.
REFERENCES
1. CENR (Committee on Environment and Natural Resources of the National Science
and Technology Council), Ecological Risk Assessment in the Federal Government,
CENR/5-99/001, Washington, DC, 1999.
2. P. A. Reinhardt, K. L. Leonard, and P. C. Ashbrook, Pollution Prevention and Waste
Minimization in Laboratories. Boca Raton, FL: CRC Press, Lewis Publishers, 1996.
3. DOE (U.S. Department of Energy), Site-Wide Environmental Impact Statement for
Continued Operation of the Los Alamos National Laboratory, DOE/EIS-0238 Albu-
querque, NM: Albuquerque Operations Office, 1999.
4. LANL (Los Alamos National Laboratory), Site Pollution Prevention Plan for Los
Alamos National Laboratory, Los Alamos National Laboratory Report LA-UR-97-
1726, Los Alamos, NM, 1997.
Copyright 2002 by Marcel Dekker, Inc. All Rights Reserved.
5. EPA (U.S. Environmental Protection Agency), Guidelines for Ecological Risk Assess-
ment; Final, U.S. Environmental Protection Agency Report EPA/630/R-95/002F,
Washington, DC, 1998.
6. E. J. Calabrese and L. A. Baldwin, Performing Ecological Risk Assessments. Chelsea,
MI: Lewis Publishers, 1993.
7. S. M. Bartell, R. H. Gadner, and R. V. O’Neill, Ecological Risk Estimation. Chelsea,
MI: Lewis Publishers, 1992.
8. G. W. Suter II, Ecological Risk Assessment. Chelsea, MI: Lewis Publishers, 1993.
9. M. H. Ebinger, R. W. Ferenbaugh, A. F. Gallegos, W. R. Hansen, O. B. Myers, and
W. J. Wenzel, Screening Methodology for Ecotoxicological Risk Assessment, Los
Alamos National Laboratory Report LA-UR-95-3272, Los Alamos, NM, 1995.
10. G. J. Gonzales and P. G. Newell, Ecotoxicological Screen of Potential Release Site
50-006(d) of Operable Unit 1147 of Mortandad Canyon and Relationship to the
Radioactive Liquid Waste Treatment Facilities Project, Los Alamos National Labo-
ratory Report LA-13148-MS, Los Alamos, NM, 1996.
11. LANL (Los Alamos National Laboratory), Screening Level Ecological Risk Assess-
ment Methods for the Los National Laboratory’s Environmental Restoration Pro-
gram, R. Ryti, E. Kelly, M. Hooten, G. Gonzales, G. McDermott, L. Soholt, Los
Alamos National Laboratory Report LA-UR-99-1405, Rev. 1, Los Alamos, NM,
December, 1999.
12. EPA (U.S. Environmental Protection Agency). Wildlife Exposure Handbook; Final,
U.S. Environmental Protection Agency Report EPA/630/R-95/002F, Washington,
DC, 1998.
13. IAEA (International Atomic Energy Agency), Effects of Ionizing Radiation on Plants
and Animals at Levels Implied by Current Radiation Standards, Technical Report
Series No. 332, Vienna, Austria, 1992.
14. K. A. Higley and R. Kuperman, Ecotoxicological Benchmarks for Radionuclide
Contaminants at Rocky Flats Environmental Technology Site. Appendix C, Argonne
National Laboratory Report RF/ER-96-0039, Argonne, IL, 1996.
15. A. Gallegos, E. Kelly, M. Kramer, C. McDaniel, P. Newell, K. Sasser, and D. Stack,
Integrating Ecological Risk Assessment and Hazards Analysis, A Pilot for the
Proposed Los Alamos Waste Treatment and Storage Facilities, Los Alamos National
Laboratory Report LA-UR-95-2555, Los Alamos, NM, 1995.
16. A. F. Gallegos, Documentation and Utilization of the Ecological Transport Model
BIOTRAN.2. Los Alamos National Laboratory Report LA-UR-97-1469, Los Ala-
mos, NM, 1997.
17. G. J. Gonzales, A. F. Gallegos, and T. S. Foxx, Update Summary of Preliminary Risk
Assessments of Threatened and Endangered Species at the Los Alamos National
Laboratory, Los Alamos National Laboratory Report LA-UR-97-4732, Los Alamos,
NM, 1997.
18. G. J. Gonzales, A. F. Gallegos, T. S. Foxx, P. R. Fresquez, M. A. Mullen, L. E. Pratt,
and P. E. Gomez, Preliminary Risk Assessment of the Bald Eagle at the Los Alamos
National Laboratory, Los Alamos National Laboratory Report LA-13399-MS, Los
Alamos, NM, 1998.
19. G. J. Gonzales, A. F. Gallegos, M. A. Mullen, K. D. Bennett, and T. S. Foxx,
Preliminary Risk Assessment of the Southwestern Willow Flycatcher (Empidonax
Copyright 2002 by Marcel Dekker, Inc. All Rights Reserved.
traillii extimus) at the Los Alamos National Laboratory, Los Alamos National
Laboratory Report LA-13508-MS, Los Alamos, NM, 1998.
20. A. F. Gallegos and G. J. Gonzales, Documentation of the Ecological Risk Assessment
Computer Model ECORSK.5, Los Alamos National Laboratory Report LA-13571-
MS, Los Alamos, NM, 1999.
21. G. J. Gonzales, P. R. Fresquez, and M. A. Mullen, Organic Contaminant Levels in
Three Fish Species Down-channel from the Los Alamos National Laboratory, Los
Alamos National Laboratory Report LA-13612-MS, Los Alamos, NM, 1999.
22. LANL (Los Alamos National Laboratory), ECORISK Database (version 1.1), Los
Alamos National Laboratory Environmental Restoration Project, Records Processing
Facility Package ID 186, April 2000.
23. J. K. Ferenbaugh, P. R. Fresquez, M. H. Ebinger, G. J. Gonzales, and P. A. Jordan,
Elk and Deer Study, Material Disposal Area G, Technical Area 54, Los Alamos
National Laboratory Report LA-13596-MS, Los Alamos, NM, 1999.
24. W. N. Byer, E. E. Connor, and S. G. Gerould, Estimates of Soil Ingestion by Wildlife.
J. Wildlife Manage., vol. 58, no. 2, pp. 375–382, 1994.
Copyright 2002 by Marcel Dekker, Inc. All Rights Reserved.