báo cáo khoa học: "Analysis of right anterolateral impacts: the effect of head rotation on the cervical muscle whiplash response" doc
Bạn đang xem bản rút gọn của tài liệu. Xem và tải ngay bản đầy đủ của tài liệu tại đây (695.66 KB, 11 trang )
BioMed Central
Page 1 of 11
(page number not for citation purposes)
Journal of NeuroEngineering and
Rehabilitation
Open Access
Research
Analysis of right anterolateral impacts: the effect of head rotation
on the cervical muscle whiplash response
Shrawan Kumar*
1
, Robert Ferrari
2
and Yogesh Narayan
3
Address:
1
Physical Therapy, University of Alberta, 3–75 Corbett Hall, Edmonton, Alberta T6G 2G4, Canada,
2
Department of Medicine, University
of Alberta, Edmonton, Alberta T6G 2B7, Canada and
3
Physical Therapy, University of Alberta, 3–78 Corbett Hall, Edmonton, Alberta T6G 2G4,
Canada
Email: Shrawan Kumar* - ; Robert Ferrari - ; Yogesh Narayan -
* Corresponding author
Cervical musclesElectromyographyAccelerationAnterolateral impactsWhiplash
Abstract
Background: The cervical muscles are considered a potential site of whiplash injury, and there
are many impact scenarios for whiplash injury. There is a need to understand the cervical muscle
response under non-conventional whiplash impact scenarios, including variable head position and
impact direction.
Methods: Twenty healthy volunteers underwent right anterolateral impacts of 4.0, 7.6, 10.7, and
13.0 m/s
2
peak acceleration, each with the head rotated to the left, then the head rotated to the
right in a random order of impact severities. Bilateral electromyograms of the
sternocleidomastoids, trapezii, and splenii capitis following impact were measured.
Results: At a peak acceleration of 13.0 m/s
2
, with the head rotated to the right, the right trapezius
generated 61% of its maximal voluntary contraction electromyogram (MVC EMG), while all other
muscles generated 31% or less of this variable (31% for the left trapezius, 13% for the right spleinus.
capitis, and 16% for the left splenius capitis). The sternocleidomastoids muscles also tended to
show an asymmetric EMG response, with the left sternocleidomastoid (the one responsible for
head rotation to the right) generating a higher percentage (26%) of its MVC EMG than the left
sternocleidomastoid (4%) (p < 0.05). When the head is rotated to the left, under these same
conditions, the results are reversed even though the impact direction remains right anterolateral.
Conclusion: The EMG response to a right anterolateral impact is highly dependent on the head
position. The sternocleidomastoid responsible for the direction of head rotation and the trapezius
ipsilateral to the direction of head rotation generate the most EMG activity.
Background
Although many diagnostic efforts over the decades have
aimed at objectively identifying the acute whiplash injury
that is often labelled as "soft tissue injury" or "neck
sprain", with the exception of a few case reports and
excluding spinal cord or bony injury, the pathology of the
Published: 31 May 2005
Journal of NeuroEngineering and Rehabilitation 2005, 2:11 doi:10.1186/1743-
0003-2-11
Received: 26 November 2004
Accepted: 31 May 2005
This article is available from: />© 2005 Kumar et al; licensee BioMed Central Ltd.
This is an Open Access article distributed under the terms of the Creative Commons Attribution License ( />),
which permits unrestricted use, distribution, and reproduction in any medium, provided the original work is properly cited.
Journal of NeuroEngineering and Rehabilitation 2005, 2:11 />Page 2 of 11
(page number not for citation purposes)
acute whiplash injury remains elusive [1]. In the absence
of an identifiable injury, efforts have simultaneously
focused on development of better preventative measures
and treatment approaches. Even without knowing what
the acute whiplash injury is, for example, knowing more
of the human response to whiplash type impacts led to
the introduction of head restraints in 1969[2] and further
innovations of head restraints have followed as the
knowledge has increased [3]. Most efforts to understand
the whiplash injury mechanism have focused on rear
impacts [4-11]. Although it has been traditionally
reported that rear-impacts account for most cases of whip-
lash injury, epidemiological evidence suggests that rear,
lateral, and frontal collisions account for whiplash injury
in roughly equal proportions [12].
Frontal collisions thus require more investigative atten-
tion, and yet there are a number of variables to consider
in terms of understanding how the cervical muscles
respond to a whiplash-type frontal impact. First, not all
collision victims have their head in the neutral (facing for-
ward) position. We recently reported on the effect of head
rotation in straight-on frontal impacts [13], and com-
pared this to the head in neutral position in a frontal
impact [14]. With the head in neutral position, a frontal
impact causes the greatest EMG activity to be generated
symmetrically in the trapezii, which have an EMG activity
that is 30–50% of their maximal voluntary contraction
(MVC EMG). In a frontal impact with head rotated to the
left, however, the left trapezius generated 77% of its max-
imal voluntary contraction (MVC) EMG (more than dou-
ble the response of other muscles). In comparison, the
right trapezius generated only 33% of its MVC. The right
sternocleidomastoid (25%) and left splenius muscles
(32%), the ones responsible for head rotation to the left,
were more active than their counterparts. On the other
hand, with the head rotated to the right, the right trape-
zius generated 71% of its MVC EMG, while the left trape-
zius generated only 30% of this value. Again, the left
sternocleidomastoid (27% of its MVC EMG) and right
splenius (28% of its MVC EMG), being responsible for
head rotation to the right, were more active than their
counterparts. Thus, head rotation produces an asymmet-
ric EMG response.
Then there is the direction of impact. Frontal impacts are
not always straight-on impacts. We have considered the
example of a right anterolateral impact [15], and the
results confirm the importance of direction of impact on
the cervical muscle response. When the impact is a right
anterolateral impact, the left trapezius still generated the
greatest EMG, up to 83% of the maximal voluntary con-
traction EMG, and the left splenius capitis instead became
more active and reached a level of 46% of this variable
[15]. This is greater than the response of the splenius capi-
tis in straight-on frontal impacts. Thus, direction of
impact also determines which muscles respond and the
proportionality of the response among the different mus-
cle groups.
The question is whether head rotation in anterolateral
impacts will increase or decrease the EMG activity, and
how. We thus undertook a study to assess the cervical
muscle response in right anterolateral impacts, but with
the head rotated to either the left or right at the time of
impact. This is part of a series of experiments to approach
the more complex impact scenarios of varying directions
and head positions.
Materials and methods
Sample
The methods for this study of offset frontal impacts are the
same as that used previously for our previous right anter-
olateral and frontal impact studies [13-15]. Twenty
healthy normal subjects (10 males, 10 females, all right-
hand dominant) with no history of whiplash injury and
no cervical spine pain during the preceding 12 months
volunteered for the study. The study was approved by the
University Research Ethics Board. The twenty subjects had
a mean age of 23.6 ± 3.0 years, a mean height of 172 ± 7.7
cm, and a mean weight of 69 ± 13.9 kg.
Tasks and Data Collection
Active surface electrodes with 10 times on-site amplifica-
tion were placed on the belly of the sternocleidomastoids,
upper trapezius at C4 level, and splenius capitis in the tri-
angle between sternocleidomastoids and trapezii bilater-
ally. The fully-isolated amplifier had additional gain
settings up to 10, 000 times with frequency response DC-
5 kHz and common mode rejection ratio of 92 dB. Before
calibrating sled acceleration, the cervical strength of the
volunteers was measured to develop force-EMG calibra-
tion factor [16,17]. The seated and stabilized subjects
exerted their maximum isometric effort in attempted flex-
ion, extension, and lateral flexion to the left and the right
for force-EMG calibration, as described by Kumar et
al.[16,17]. The acceleration device consisted of an acceler-
ation platform and a sled. The full details of the device
and the electromyography data collection are given by
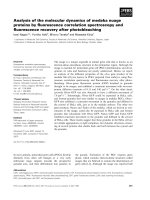
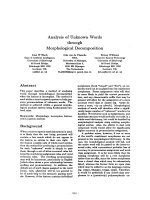
Kumar et al.[7] and the device is as shown in Fig. 1. After
the experiment was discussed and informed consent
obtained, the age, weight, and height of each volunteer
was recorded. The volunteers then were seated on the
chair and stabilized in neutral spinal posture. The chair
was rigid so as to minimize any effect of elastic properties
of the chair following acceleration. Subjects were then
outfitted with triaxial accelerometers (Model # CXL04M3,
Crossbow technology, Inc., San Jose, California, U. S. A.)
on their glabella and the first thoracic spinous process.
Another triaxial accelerometer was mounted on the sled,
Journal of NeuroEngineering and Rehabilitation 2005, 2:11 />Page 3 of 11
(page number not for citation purposes)
not the chair. The accelerometers had a full scale nonline-
arity of 0.2%, dynamic range of ± 5 g, with a sensitivity of
500 mV/g, resolution of 5 mg within a bandwidth of DC-
100 Hz, and a silicon micromachined capacitive beam
that was quite rugged and extremely small in die area. The
subjects were then exposed to right anterolateral impacts
(offset from a frontal impact by 45 degrees) with their
head rotated 45 degrees to their left and right at accelera-
tions of 4.0, 7.6, 10.7, and 13.0 m/s
2
generated in a ran-
dom order by a pneumatic piston. To release the piston
the solenoid of the pneumatic system was activated by an
electronic impulse which was recorded for timing refer-
ence. Upon delivery of impact by the pneumatic piston,
the sled moved on two parallel tracks mounted 60 cm.
apart. The coefficient of friction of the tracks was 0.03
which allowed for smooth gliding of the sled on the rails.
The opposite end of the track was equipped with non-lin-
ear springs and high density rubber stopper to prevent the
subject from sliding off the platform. Each subject effec-
tively underwent 4 levels of accelerative impacts under
two conditions of head rotation, for one direction of
impact (a total of 8 impacts). The head rotation itself did
not place the head in a more forward position. Although
the subjects are asked to rotate their head prior to impact,
nothing was done to fix the position, and the head is free
to move after impact. The accelerations involved in this
experiment were low enough that injury was not expected.
The acceleration was delivered in a way that mimicked the
time course seen in motor vehicle collisions and occurred
fast enough to produce eccentric muscle contractions. The
acceleration impulse reached its peak value in 33 ms. Sub-
jects were asked to report any headache or other aches
they experienced in the days following the impacts.
Data analysis
The data on the peak and average accelerations in all three
axes of the sled, shoulder, and head for all four levels of
accelerative impacts were measured. The gravity bias was
Illustration of the sled device for whiplash-type impactsFigure 1
Illustration of the sled device for whiplash-type impacts.
Track
Base Board
Rotating Board
Sliding Board
Subject
Pneumatic Cylinder
Journal of NeuroEngineering and Rehabilitation 2005, 2:11 />Page 4 of 11
(page number not for citation purposes)
eliminated by subtracting this value from the accelerome-
ter readings. The onset of acceleration was measured by
dropping the ascending slope line on the base line. The
point of intersection of these lines was considered as onset
of acceleration. In the analysis, the sample of volunteers
was collapsed across gender because preliminary analysis
showed no statistically significant differences in the EMG
amplitudes between the men and women. The sled veloc-
ity and its acceleration subsequent to the pneumatic pis-
ton impact and the rubber stopper impact were measured.
All timing data (time to onset of EMG and peak EMG)
were referred to the solenoid of the piston firing. The time
of the peak accelerations of sled and head were measured.
Also, the time relations of the onset and peak of the EMG
were measured and analyzed. The time to onset was deter-
mined when the EMG perturbation reached 2% of the
peak EMG value to avoid false positives due to tonic activ-
ity. This method was chosen to avoid any false positives
due to tonic EMG. This method was in agreement with
projection of the line of slope on the baseline. EMG
amplitudes were normalised against the subjects' maxi-
mal voluntary contraction electromyogram. The ratio per-
centage of the EMG amplitude versus the maximal
contraction normalised EMG activity for that subject
allowed us to determine the force equivalent generated
due to the impact for each muscle.
Statistical analysis was performed using the SPSS statisti-
cal package (SPSS Inc., Chicago, IL) to calculate descrip-
tive statistics, correlation analysis between EMG and head
acceleration, analysis of variance (ANOVA) of the time to
EMG onset, time to peak EMG, average EMG, and the
force equivalents. Additionally, a linear regression analy-
sis was carried out for the kinematic variables of head dis-
placement, head velocity and head acceleration and EMG
variables on the peak of the sled acceleration. Initially, all
regressions were carried out to the level of exposure and
subsequently they were extrapolated to twice the level of
acceleration used in the study. The purpose of the regres-
sion analysis was to see if using the acceleration of the sled
– one could predict the head acceleration and EMG
response. The regression analysis was carried out using
linear and non-linear functions. The linear regression was
found to be the best fit, perhaps because the input accel-
eration impulse was non-linear.
Results
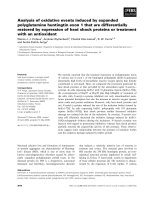
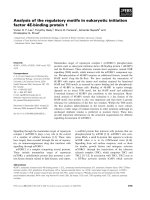
Head acceleration
The kinematic response of the head to the four levels of
applied acceleration are shown in Fig. 2. As anticipated,
an increase in applied acceleration resulted in an increase
in excursion of the head and accompanying accelerations
(p < 0.05). The accelerations in these impacts were not
associated with any reported symptoms in the volunteers.
Electromyogram amplitude
In a right anterolateral impact, with the head rotated 45
degrees to the right or left, the trapezius muscle ipsilateral
to the direction of head rotation showed the greatest EMG
response (p < 0.05). The sternocleidomastoid muscles
responsible for the head rotation each showed more EMG
response to the pertubation than their counterparts (p <
0.05).
At a peak acceleration of 13.0 m/s
2
, for example with the
head rotated to the right, the right trapezius generated
61% of its maximal voluntary contraction electromyo-
gram, while all other muscles generated 31% or less of this
variable. Though they generated less EMG activity, the
sternocleidomastoids muscles also tended to show an
asymmetric EMG response, with the left sternocleidomas-
toid (the one responsible for head rotation to the right)
generating a higher percentage (26%) of its maximal vol-
untary contraction electromyogram than the right
sterno-
cleidomastoid (4%) (p < 0.05). When the head is rotated
to the left, under these same conditions, the EMG results
are reversed even though the impact direction remains
right anterolateral. When looking left, the left trapezius
generated 51% of its maximal voluntary contraction elec-
tromyogram, with only 14% of the maximal voluntary
contraction for the right trapezius, and less than 25% for
the remaining muscles. The sternocleidomastoid muscles
in this case still showed an asymmetric EMG response,
with the right sternocleidomastoid (the one responsible
for head rotation to the left) generating a higher percent-
age (22%) of its maximal voluntary contraction electro-
myogram than the left sternocleidomastoid (4%) (p <
0.05).
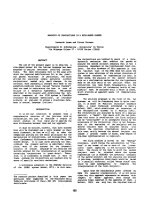
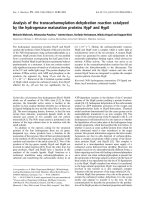
The normalized EMG for the sternocleidomastoid (SCM),
splenius capitis (SPL) and trapezius (TRP) muscles are
shown in Fig. 3. As the level of applied acceleration in the
impact increased, the magnitude of the EMG recorded
from the trapezius ipsilateral to the head rotation
increased progressively and disproportionately compared
to other muscles (p < 0.05). The reverse occurred when the
head was rotated to the left, where the left TRP instead
generated 77% of its MVC and again the remaining mus-
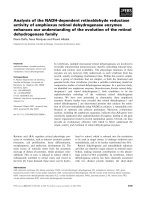
cles generated 33% or less of their MVC. Figure 4 also
compares these responses at the highest level of accelera-
tion to the cervical muscle responses with the head in neu-
tral position. The results indicate that head rotation
affected the muscle response independent of direction of
impact. Although the data concerning EMG responses
with the head in neutral posture are from a different group
of subjects, the methodology of always normalizing the
EMG response to an individual's maximal voluntary con-
traction helps to adjust for these variables (i.e, gender,
stature and age affects maximal voluntary contraction,
and EMG responses should thus be normalized before
Journal of NeuroEngineering and Rehabilitation 2005, 2:11 />Page 5 of 11
(page number not for citation purposes)
Head acceleration in the x, y, and z axes of one subject in response to the level of applied accelerationFigure 2
Head acceleration in the x, y, and z axes of one subject in response to the level of applied acceleration. The z-axis is parallel,
the x-axis orthogonal, and the y-axis vertical to the direction of travel. Head X, head acceleration in the x-axis; Head Y, head
acceleration in the y-axis; Head Z, head acceleration in the z-axis.
Head Rotated to the Left
0.0 0.4 0.8 1.2
Time (s)
Acceleration (m/s
2
)
-10
-5
0
5
4.0 m/s
2
Head X
Head Y
Head Z
0.0 0.4 0.8 1.2
Time (s)
-10
-5
0
5
Acceleration (m/s
2
)
7.6 m/s
2
0.0 0.4 0.8 1.2
Time (s)
-10
-5
0
5
Acceleration (m/s
2
)
10.7 m/s
2
0.0 0.4 0.8 1.2
Time (s)
-10
-5
0
5
Acceleration (m/s
2
)
13.0 m/s
2
Head Rotated to the Right
0.0 0.4 0.8 1.2
Time (s)
Acceleration (m/s
2
)
-2
0
2
4
6
8
10
4.0 m/s
2
Head X
Head Y
Head Z
0.0 0.4 0.8 1.2
Time (s)
-2
0
2
4
6
8
10
Acceleration (m/s
2
)
7.6 m/s
2
0.0 0.4 0.8 1.2
Time (s)
-2
0
2
4
6
8
10
Acceleration (m/s
2
)
10.7 m/s
2
0.0 0.4 0.8 1.2
Time (s)
-2
0
2
4
6
8
10
Acceleration (m/s
2
)
13.0 m/s
2
Journal of NeuroEngineering and Rehabilitation 2005, 2:11 />Page 6 of 11
(page number not for citation purposes)
Normalized average and peak electromyogram (EMG) (percentage of isometric maximal voluntary contraction), force equiva-lent of EMG (N), and head rotated right or left, and applied accelerationFigure 3
Normalized average and peak electromyogram (EMG) (percentage of isometric maximal voluntary contraction), force equiva-
lent of EMG (N), and head rotated right or left, and applied acceleration. LSCM, left sternocleidomastoid; RSCM, right sterno-
cleidomastoid; LSPL, left splenius capitis; RSPL, right splenius capitis; LTRP, left trapezius; RTRP, right trapezius.
lscm lspl ltrp rscm rspl rtrp
CHANNEL
0
20
40
60
80
Norm. EMG (%)
0
20
40
60
Force Equiv. EMG (N)
Norm. P eak EMG
Force Equivalent of EMG
4.0 m /s
2
lscm lspl ltrp rscm rspl rtrp
0
20
40
60
80
Norm. EMG (%)
0
20
40
60
Force Equiv. EMG (N)
7.6 m /s
2
lscm lspl ltrp rscm rspl rtrp
0
20
40
60
80
Norm. EMG (%)
0
20
40
60
Force Equiv. EMG (N)
10.7 m /s
2
lscm lspl ltrp rscm rspl rtrp
0
20
40
60
80
Norm. EMG (%)
0
20
40
60
Force Equiv. EMG (N)
13.0 m /s
2
Head Rotated to the Left
Head Rotated to the Right
lscm lspl ltrp rscm rspl rtrp
CHANNEL
0
20
40
60
80
Norm. EMG (%)
0
20
40
60
Force Equiv. EMG (N)
4.0 m /s
2
lscm lspl ltrp rscm rspl rtrp
0
20
40
60
80
Norm. EMG (%)
0
20
40
60
Force Equiv. EMG (N)
7.6 m /s
2
lscm lspl ltrp rscm rspl rtrp
0
20
40
60
80
Norm. EMG (%)
0
20
40
60
Force Equiv. EMG (N)
10.7 m /s
2
lscm lspl ltrp rscm rspl rtrp
0
20
40
60
80
Norm. EMG (%)
0
20
40
60
Force Equiv. EMG (N)
13.0 m /s
2
Journal of NeuroEngineering and Rehabilitation 2005, 2:11 />Page 7 of 11
(page number not for citation purposes)
making comparisons among individuals or groups). Thus,
we were able to compare normalized populations from
different studies, each group undergoing the same experi-
mental protocols are used.
Timing
The time to onset of the sled, shoulder, and head acceler-
ation onset in the z-axis (axis along impact direction) and
the EMG signals of the six muscles examined for head
rotated to the left or right are presented in Table 1. The
timing data is in relation to firing of the solenoid of the
piston. The time to onset of the sled, torso, and head
acceleration decreased with increased applied acceleration
(p < 0.05). Similarly, the time to onset of the EMG show
a trend (p > 0.05) for all muscles to decrease with
increased applied acceleration. The mean times at which
peak EMG occurred for all the experimental conditions
are presented in Table 2, and also show a trend to earlier
times of peak activity with increasing acceleration, though
this again did not reach statistical significance.
Normalized peak electromyogram (EMG) (percentage of isometric maximal voluntary contraction), for head in neutral posi-tion, rotated right, or rotated left, at an applied acceleration of 13.0 m/s
2
Figure 4
Normalized peak electromyogram (EMG) (percentage of isometric maximal voluntary contraction), for head in neutral posi-
tion, rotated right, or rotated left, at an applied acceleration of 13.0 m/s
2
. LSCM, left sternocleidomastoid; RSCM, right sterno-
cleidomastoid; LSPL, left splenius capitis; RSPL, right splenius capitis; LTRP, left trapezius; RTRP, right trapezius.
lscm lspl ltrp rscm rspl rtrp
0
20
40
60
80
Norm EMG (%)
Applied Accel: 13 m/s
2
Head Rotated Left
Head Neutral
Head Rotated Right
Journal of NeuroEngineering and Rehabilitation 2005, 2:11 />Page 8 of 11
(page number not for citation purposes)
The relationship between the force equivalent EMG
response of each muscle and the head acceleration are
shown in Table 3. To obtain the force equivalency of a
muscle response due to impact, we first performed a linear
regression analysis on the graded EMG data obtained in
the maximal voluntary contraction trials. This resulted
inan equation for force/emg ratio. EMG values from each
muscle as measured in this impact study were then
entered into the equation, giving us a force equivalent
value (Newtons) for each muscle as shown in Table 3. The
kinematic responses show that very-low velocity impacts
produce less force equivalent than the maximal voluntary
contraction for the same subject. The head accelerations
were correspondingly lower than the sled accelerations in
this experiment. For very-low velocity impacts, this is to
be expected, as it is usually only when the sled accelera-
tion exceeds 5 g's that head acceleration begins to exceed
sled acceleration. This experiment involved less than 2 g
accelerations.
Regression analyses
The applied acceleration, and the muscles examined had
significant main effects on the peak EMG activity (p <
0.05) as shown in Table 4. We used a linear regression
Table 1: Mean Time to Onset (msec) of Acceleration and of Muscle EMG From the Firing of the Solenoid of the Pneumatic Piston
Muscle
Sternocleidomastoid Splenius Capitis Trapezius
Acceleration (m/s
2
) Sled Shoulder Head Left Right Left Right Left Right
Right Head Rotation
4.0 44 (19) 65 (32) 85 (17) 199 (116) 224 (136) 125 (45) 104 (52) 105 (44) 108 (48)
7.6 34 (10) 52 (18) 61 (21) 177 (81) 197 (143) 109 (33) 97 (40) 104 (42) 96 (46)
10.7 30 (11) 42 (14) 55 (21) 170 (49) 141 (109) 104 (42) 96 (47) 97 (33) 92 (41)
13.0 26 (11) 35 (15) 52 (21) 132 (60) 125 (63) 91 (22) 93 (36) 89 (30) 90 (28)
Left Head Rotation
4.0 48 (21) 64 (26) 97 (22) 185 (61) 222 (50) 114 (43) 196 (105) 137 (35) 180 (55)
7.6 31 (15) 49 (22) 71 (25) 99 (45) 194 (45) 98 (37) 172 (78) 106 (45) 114 (44)
10.7 29 (14) 43 (12) 65 (22) 86 (47) 181 (77) 94 (35) 163 (107) 98 (41) 110 (48)
13.0 27 (11) 42 (19) 64 (19) 79 (48) 180 (70) 85 (27) 138 (48) 78 (29) 101 (36)
Times for the sled, shoulder, and head represent the time at which acceleration in z-axis (direction of travel) began. Times for the cervical muscles
represent the time to onset for EMG activity. Values in parentheses represent one standard deviation.
Table 2: Mean Time (msec) at Which Peak Electromyogram Occurred After the Firing of the Solenoid of the Pneumatic Piston
Muscle EMG
Sternocleidomastoid Splenius Capitis Trapezius
Acceleration (m/s
2
) Left Right Left Right Left Right
Right Head Rotation
4.0 479 (298) 599 (374) 247 (46) 264 (374) 223 (20) 228 (28)
7.6 379 (281) 569 (263) 225 (36) 224 (32) 211 (28) 227 (24)
10.7 363 (212) 547 (414) 219 (36) 219 (30) 206 (31) 224 (35)
13.0 321 (225) 521 (349) 210 (35) 211 (23) 196 (30) 210 (26)
Left Head Rotation
4.0 526 (342) 687 (433) 243 (34) 822 (511) 281 (90) 664 (255)
7.6 255 (72) 576 (141) 227 (19) 704 (365) 267 (42) 262 (60)
10.7 245 (34) 521 (240) 223 (27) 631 (225) 256 (57) 246 (58)
13.0 244 (25) 510 (284) 215 (32) 608 (208) 249 (52) 218 (55)
Values in parentheses represent one standard deviation.
Journal of NeuroEngineering and Rehabilitation 2005, 2:11 />Page 9 of 11
(page number not for citation purposes)
model to plot the available data and extrapolate from the
experimental accelerations to accelerations on the order of
30 m/s
2
. Initially, regression analyses were performed
only up to 13.0 m/s
2
using a linear function. The kine-
matic variables of head displacement, velocity, and accel-
eration in response to applied acceleration were
calculated (see Fig. 5.). Additionally, we also regressed the
EMG magnitudes on acceleration. The responses of the
left and right muscle groups were extrapolated to more
than twice the applied acceleration value.
Discussion
The chief purpose of this study was to see what effect head
rotation had on muscle responses in a right anterolateral
impact. When the head was in neutral position in a previ-
ous study of right anterolateral impact [15], the left trape-
zius generated the greatest EMG, up to 83% of the
maximal voluntary contraction EMG, and the left splenius
capitis instead became more active and reached a level of
46% of this variable. In the current study, having kept the
impact direction constant, but varying head rotation to
right or left we see that the muscles responsible for head
rotation (the contralateral sternocleidomastoid), and
those which are likely stretched by this rotation (the ipsi-
lateral trapezius), are most active and differ from their
counterparts.
Although one might predict this, the human response to
impacts and the neck structure is seemingly complex
enough that it cannot always be assumed to be as one pre-
dicts. Our study methodology allowed for direct testing of
the response rather than assumptions. There is no direct
way to measure forces exerted by muscles due to neck
perturbation and subsequent muscle activity, examining
the EMG activity generated allows one to compare this to
EMG activity in voluntary contractions. This in turn
allows one to relate the muscle responses to normal mus-
cle forces in various physiological ranges of activity.
Because one cannot test the higher accelerations for ethi-
cal reasons, the best one can do currently is to compare to
the small volunteer studies that were done previously.
Further studies with larger samples and perhaps
somewhat higher accelerations (within ethical limits) will
allow to determine further how reasonable these extrapo-
lations are. The projected values are hypothetical and
likely to be affected by the ligaments and joint geometry
in a manner different from that recorded in the
experiment.
In frontal impacts, the direction of impact, anterolateral
or straight-on, determines the muscle response, but so too
does the occupant's head position, rotated right or left, at
the time of impact. Anecdotally at least, whiplash patients
Table 3: Mean Force Equivalents (Newtons, N) and Mean Head Accelerations at Time of Maximal EMG in Direction of Travel for Right
Anterolateral Impact.
Force Equivalents for Muscle (N)
Sternocleidomastoid Splenius Capitis Trapezius
Sled Acceleration (m/s
2
) Head Acceleration (m/s
2
) Left Right Left Right Left Right
Right Head Rotation
4.0 3.6 (0.8) 9 (4) 3 (2) 19 (7) 19 (8) 11 (4) 18 (6)
7.6 6.1 (1.0) 10 (5) 5 (2) 21 (14) 22 (10) 18 (7) 21 (10)
10.7 8.0 (1.1) 11 (6) 6 (2) 23 (10) 26 (9) 21 (5) 27 (11)
13.0 9.7 (1.4) 12 (7) 7 (5) 26 (10) 18 (16) 23 (9) 28 (11)
Left Head Rotation
4.0 4.3 (0.7) 4 (2) 7 (5) 19 (13) 11 (6) 17 (6) 10 (4)
7.6 7.7 (1.3) 4 (3) 10 (6) 29 (13) 12 (8) 22 (7) 11 (6)
10.7 10.0 (1.3) 5 (4) 11 (8) 33 (19) 17 (7) 29 (10) 12 (6)
13.0 11.7 (1.8) 6 (5) 13 (7) 34 (17) 19 (8) 35 (14) 13 (6)
Values in parentheses represent one standard deviation.
Table 4: ANOVA table for Peak EMG (µV) by Muscles and
Applied Acceleration.
Source df F Sig.
Right Head
Rotation
applied acceleration 3 13.38732 0.00
muscle 5 64.17247 0.00
Left Head
Rotation
applied acceleration 3 18.76792 0.00
muscle 5 87.74690 0.00
Journal of NeuroEngineering and Rehabilitation 2005, 2:11 />Page 10 of 11
(page number not for citation purposes)
report both offset impacts and also may report head rota-
tion to the left or right at the time of impact. These
patients also tend to emphasize the unilateral nature of
their neck pain, but it remains to be seen in epidemiolog-
ical studies if this is true. The evidence from low-velocity
impacts studies does point in the direction of differential
injury risks to different muscles depending on the impact
conditions. This is in keeping with other studies of the
pattern of muscle activation. Gabriel et al.[19] assessed
maximal static strength and bilateral EMG activity associ-
ated with force exerted in the direction of the anatomic
reference planes, as well as for planes at 30° intervals
between the anatomic reference planes. In extending
previous work in this area [19,20], Gabriel et al. observed
that right-hand dominant subjects have the greatest
strength directed to the right side of the body. For this rea-
son, it is important to normalize EMG responses to
impact to the subject's maximal voluntary contraction
Extrapolated regression plots of the effect that applied acceleration has on the head motion variables of displacement (A) (mm), velocity (B) (m/s), and acceleration (C) obtained (m/s
2
)Figure 5
Extrapolated regression plots of the effect that applied acceleration has on the head motion variables of displacement (A)
(mm), velocity (B) (m/s), and acceleration (C) obtained (m/s
2
).
0 5 10 15 20 25 30 35
0
120
240
360
480
Displacement (mm)
0 5 10 15 20 25 30 35
0
1
2
3
Velocity (m/s)
0 5 10 15 20 25 30 35
Applied Acceleration (m/s
2
)
0
10
20
30
Head Acceleration (m/s
2
)
0 5 10 15 20 25 30 35
0
110
220
330
440
Displacement (mm)
0 5 10 15 20 25 30 35
0
1
2
3
Velocity (m/s)
0 5 10 15 20 25 30 35
Applied Acceleration (m/s
2
)
0
10
20
30
Head Acceleration (m/s
2
)
Head Rotated to the Left
Head Rotated to the Right
20.88+13.31a R
2
=0.97
0.18+0.082a R
2
=0.97
0.93+0.67a R
2
=0.99
36.97+13.70a R
2
=0.93
0.29+0.087a R
2
=0.94
1.19+0.83a R
2
=0.98
∆ - sample response
Journal of NeuroEngineering and Rehabilitation 2005, 2:11 />Page 11 of 11
(page number not for citation purposes)
EMG, to account for directional and other confounders.
Also, they showed that the SCM muscles are an agonist for
static contractions with force exerted in a direction that
corresponded to flexion, and a synergist for a force direc-
tion associated with lateral bending. It is thus expected
that an anterolateral impact will generate the greatest
response from the SCMs, and this is consistent with our
findings.
Whether or not the pathology of the acute whiplash injury
is known, measures to prevent this injury or understand
its nature may well be advanced by understanding both
the cervical muscle responses and the head kinematics in
response to whiplash-type impacts. The difficulty is that
besides individual subject characteristics, there are many
collision parameters which may affect the pattern of
response, including severity of impact, direction of
impact, awareness of impending impact, head position,
seat design and restraint systems. We have, however,
begun the process of a larger series of investigations by
showing what effect increasing acceleration, impact direc-
tion, head rotation and expectation has on muscle
responses when other factors are held constant (i.e. seat
and restraint type) [7,13-15]. Future studies can build on
this and determine how different seat design or other fac-
tors that exist in vehicles affect muscle responses when
things such as acceleration, expectation, and direction, for
example, are held constant. EMG studies also allow one to
examine muscle group responses and patterns, rather than
simply describe head or other body region accelerations.
The experimental design we have used to study neck
perturbations to very low-velocity change is not intended
to mimic vehicle occupancy, but rather to allow for the
initial exploration of the role of EMG in assessing neck
perturbations.
Abbreviations
MVC (Maximal Voluntary Contraction); EMG (Electro-
myogram); cm (Centrimetres); dB (decibels); C4 (fourth
cervical vertebra); mV/g (Millivolts per gram); Hz (Hertz);
kHz (kilohertz); g (acceleration due to gravity); m/s2
(metres per second per second); kg (kilograms); SCM
(Sternocleidomstoid); TRP (Trapezius); SPL (Splenius
capitis)
Competing Interests
The author(s) declare that they have no competing
interests.
Authors' Contributions
SK made substantial contributions to conception and
design, to acquisition of data, and analysis and interpreta-
tion of data, was involved in drafting the article and
revising it critically for important intellectual content. RF
made substantial contributions to analysis and interpreta-
tion of data, and was involved in drafting the article and
revising it critically for important intellectual content. YN
made substantial contributions to acquisition of data, and
analysis and interpretation of data. All authors read and
approved the final manuscript.
Acknowledgements
There was no external funding source for this research
References
1. Ferrari R: The Whiplash Encyclopedia. The Facts and Myths of Whiplash
Gaithersburg, Maryland: Aspen Publishers Inc; 1999:449-470.
2. Ruedmann AD Jr: Automobile safety device – headrest to pre-
vent whiplash injury. JAMA 1969, 164:1889.
3. Jakobsson L, Lundell B, Norin H, Isaksson-Hellman I: WHIPS –
Volvo's whiplash protection study. Accid Anal Prev 2000,
32:307-319.
4. Brault JR, Wheeler JB, Siegmund GP, Brault EJ, Weber M, Peuker C,
Wortler K.: Clinical response of human subjects to rear-end
automobile collisions. Arch Phys Med Rehabil 1998, 79:72-80.
5. Castro WH, Schilgen M, Meyer S, Weber M, Peuker C, Wortler K:
Do "whiplash injuries" occur in low-speed rear impacts ? Euro
Spine J 1997, 6:366-375.
6. Kumar S, Narayan Y, Amell T: Role of awareness in head-neck
acceleration in low velocity rear-end impacts. Accid Anal Prev
2000, 32:233-241.
7. Kumar S, Narayan Y, Amell T: An electromyographic study of
low-velocity rear-end impacts. Spine 2002, 27:1044-1055.
8. Magnusson ML, Pope MH, Hasselquist L, Bolte KM, Ross M, Goel VK,
Lee JS, Spratt K, Clark CR, Wilder DG: Cervical electromyo-
graphic activity during low-speed rear-end impact. Euro Spine
J 1998, 8:118-125.
9. Siegmund GP, Sanderson DJ, Myers BS, Inglis JT: Awareness affects
the response of human subjects exposed to a single whiplash-
like perturbation. Spine 2003, 28:671-679.
10. Szabo TJ, Welcher J, Anderson RD: Human occupant kinematic
response to low speed rear-end impacts. Proceedings of the
Thirty Eighth Stapp Car Crash Conference. Warrendale, Penn-
sylvania: Society of Automotive Engineers 1994:23-35. SAE 940532
11. Szabo TJ, Welcher J: Dynamics of low speed crash tests with
energy absorbing bumpers. Warrendale, Pennsylvania: Society of
Automotive Engineers 1992, 101(6):1367-1375. SAE 921573
12. Cassidy JD, Carroll LJ, Cote P, Lemstra M, Berglund A, Nygren A:
Effect of eliminating compensation for pain and suffering on
the outcome of insurance claims for whiplash injury. N Engl J
Med 2000, 342:1179-1186.
13. Kumar S, Ferrari R, Narayan Y: Turning away from whiplash. An
EMG study of head rotation in whiplash impact. J Orthop Res in
press.
14. Kumar S, Narayan Y, Amell T: Analysis of low-velocity frontal
impacts. Clin Biomech 2003, 18:694-703.
15. Kumar S, Ferrari R, Narayan Y: Cervical muscle response to
whiplash-type right anterolateral impacts. Euro Spine J 2004,
13:398-407.
16. Kumar S, Narayan Y, Amell T: Cervical strength of young adults
in sagittal, coronal, and intermediate planes. Clin Biomech 2001,
6:380-388.
17. Kumar S, Narayan Y, Amell T, Ferrari R: Electromyography of
superficial cervical muscles with exertions in sagittal, coro-
nal, and oblique planes. Euro Spine J 2002, 11:27-37.
18. Kumar S, Narayan Y, Amell T: An electromyographic study of
low-velocity rear-end impacts. Spine 2002, 27:1044-1055.
19. Spitzer WO, Skovron ML, Salmi LR, Cassidy JD, Duranceau J, Suissa
S, Zeiss E: Scientific monograph of the Quebec Task Force on
Whiplash-Associated Disorders. Spine 1995, 120(suppl
8):1S-73S.
20. Gabriel DA, Matsumoto JY, Davis DH, Currier BL, An KN: Multidi-
rectional neck strength and electromyographic activity for
normal controls. Clin Biomech 2004, 19:653-658.
21. Vasavada AN, Peterson BW, Delp SL: Three-dimensional spatial
tuning of neck muscle activation in humans. Exp Brain Res 2002,
147:437-448.