báo cáo khoa học: "Three-dimensional kinematic motion analysis of a daily activity drinking from a glass: a pilot study" pdf
Bạn đang xem bản rút gọn của tài liệu. Xem và tải ngay bản đầy đủ của tài liệu tại đây (363.99 KB, 11 trang )
BioMed Central
Page 1 of 11
(page number not for citation purposes)
Journal of NeuroEngineering and
Rehabilitation
Open Access
Research
Three-dimensional kinematic motion analysis of a daily activity
drinking from a glass: a pilot study
Margit Alt Murphy*
1
, Katharina S Sunnerhagen
1
, Bo Johnels
2
and
Carin Willén
1
Address:
1
Dept. of Clinical Neuroscience – Rehabilitation Medicin, University of Göteborg, Sweden and
2
Dept. of Clinical Neurology, University
of Göteborg, Sweden
Email: Margit Alt Murphy* - ; Katharina S Sunnerhagen - ;
Bo Johnels - ; Carin Willén -
* Corresponding author
Abstract
Background: Development of reliable and objective evaluation methods is required, particularly
for natural and goal-oriented upper-extremity tasks. Three-dimensional imaging measurement
techniques have turned out to be a powerful tool for a quantitative and qualitative assessment of
multijoint movements. The purpose of this study was to develop and test a method of three-
dimensional motion analysis for the activity "drinking from a glass" and describe the drinking task
with kinematic variables in control subjects.
Methods: A protocol was developed for the drinking activity including the set-up of cameras and
positions of the markers and the subject. The drinking task included reaching, forward transport
with glass, drinking, back transport and returning the hand to the initial position. An optoelectronic
system was used for the three-dimensional kinematic motion capture. Movement times, velocities,
joint angles and interjoint coordination for shoulder and elbow were computed and analyzed for
twenty control subjects. Test-retest consistency was evaluated for six subjects.
Results: The test protocol showed good consistency in test-retest. Phase definitions for the
drinking task were defined and verified. Descriptive kinematic variables were obtained for
movement times, positions, velocities and joint angles for shoulder and elbow joint. Interjoint
coordination between shoulder and elbow joint in reaching phase showed a high correlation.
Conclusion: This study provides a detailed description of the three-dimensional kinematic analysis
of the drinking task. Our approach to investigate and analyze a goal-oriented daily activity has a
great clinical potential. Consequently, the next step is to use and test this protocol on persons with
impairments and disabilities from upper extremities.
Background
The upper extremity has an important role in several daily
activities such as eating, drinking, clothing, grooming,
writing, as well as in different sports and leisure activities.
These activities require coordination of multiple joints
and involve both the musculoskeletal and neural systems
[1]. Impairment of upper extremity is one of the most
common sequels following CNS lesions [2,3] and is also
Published: 16 August 2006
Journal of NeuroEngineering and Rehabilitation 2006, 3:18 doi:10.1186/1743-0003-3-18
Received: 22 March 2006
Accepted: 16 August 2006
This article is available from: />© 2006 Murphy et al; licensee BioMed Central Ltd.
This is an Open Access article distributed under the terms of the Creative Commons Attribution License ( />),
which permits unrestricted use, distribution, and reproduction in any medium, provided the original work is properly cited.
Journal of NeuroEngineering and Rehabilitation 2006, 3:18 />Page 2 of 11
(page number not for citation purposes)
frequent in patients with musculoskeletal impairments
involving the upper extremity. A dysfunction in the upper
extremity can significantly limit a person's level of activity
and participation in their social and physical environment
[4].
Upper extremity function is in neurological settings gener-
ally assessed with observer-initiated standardized meas-
ures based on ordinal scales, e.g. Fugl-Meyer Assesment,
Frenchay Arm Test, Motor Assessment Scale, Action
Research Arm Test, or as timed tests, e.g. Box and Block
Test, Nine Hole Peg Test [5-7]. These outcome measures
are reliable and sensitive for measuring gross changes in
functional performance but have less sensitivity to smaller
and more specific changes. Furthermore, despite the
extensive experience in using these observer-initiated
measures by clinicians, the subjectivity of these tests can-
not be denied.
A better understanding of human movement requires
more objective testing and accurate analysis of motion to
describe the arm movements more precisely and specifi-
cally during functional testing. Kinematic analysis is one
such method. Kinematics describes movements of the
body through space and time, including linear and angu-
lar displacements, velocities and accelerations, but with-
out reference to the forces involved [8,9]. Three-
dimensional imaging measurement techniques, including
optoelectronic systems, have turned out to be a powerful
tool for a quantitative assessment of movement in all
degrees of freedom. The models for lower extremity move-
ments and gait analysis have been well established in bio-
mechanical and clinical research and are now applied to
the detailed diagnosis and treatment planning of patients.
However, the variety, complexity and range of upper-
extremity movements is a challenge to assessment and
interpretation of data and the clinical routines for three-
dimensional analysis in upper extremities are not fully
established [10].
Movement analysis of reaching can provide precise quan-
titative and qualitative data of arm movement in space
including movement velocities and accelerations. Joint
angles and interjoint coordination can be calculated. In
addition to the assessment of performance, kinematic
measures can be useful for elucidating the motor strate-
gies in goal-oriented tasks, as well as for evaluating upper-
extremity therapies [7]. Most studies with kinematic anal-
ysis of upper extremities involve reaching movement car-
ried out in the horizontal plane with the arm supported
and in highly constrained conditions [7,11]. There are,
however, an increasing number of studies with more "nat-
ural" reaching or pointing movements were in some cases
even grasping an object is included [12-15].
Only a few studies have analyzed a functional task for
upper extremity with three-dimensional kinematic analy-
sis. Two of these studies have had the intention to attain
data for upper limb kinematics in order to support the
development of upper limb joint replacements [16,17].
Murgia et al investigated the motor control of wrist move-
ments in two activities of daily living (jar opening and car-
ton pouring) in four healthy persons [18]. One pilot study
investigated the two-dimensional forearm movement
during transport phase of drinking activity, with focus on
effects of concentric and eccentric exercise training in eld-
erly healthy women [19].
Kinematics studies have shown that reaching and grasping
movements vary according to the goal and constraints of
the task. For example, a pointing movement has different
kinematics than a movement combined with grasping an
object, in the same way that reaching movement kinemat-
ics are different depending on if the real-life object is
present or not [9,20]. Studies of natural and goal-oriented
movements are of particular relevance to clinical practice
since they provide essential information of person's real
capabilities [7,10].
There are no studies, in our knowledge, which have ana-
lyzed the whole drinking movement with kinematic char-
acteristics. The starting-point for this study was to
investigate and analyze this daily activity with kinematic
analysis without physical restraints on the normal move-
ment of drinking. We were also interested to explore the
potential of this method for use in clinical practice. To get
answers for these considerations it is necessary to develop
a method of three-dimensional analysis of the drinking
activity and gather the reference data for control persons.
The aims of the present study were:
1. To develop a protocol and test the consistency of that
protocol for the three-dimensional motion analysis of an
daily activity "drinking from a glass",
2. To obtain descriptive group data for this drinking task
in control subjects.
Methods
Subjects
The study group was based on a sample of convenience
and included 20 control subjects (9 male and 11 female).
The mean age was 48.2 years (range 31–64). The subject's
height measurements were collected by self report. The
length of the right arm was measured with a flexible meas-
uring tape, arm adducted, inward rotated and elbow in 90
degrees flexion and defined as a distance between
acromion and styloid process of ulna. The subjects mean
height was 171.5 cm (range 157–187), and the mean right
arm length was 61.1 (range 55–68). Inclusion criteria
Journal of NeuroEngineering and Rehabilitation 2006, 3:18 />Page 3 of 11
(page number not for citation purposes)
were: subjects with right dominant hand who were, in
their own opinion, in "good health". Exclusion criteria
were: the presence of musculosceletal or neurological
problems that could affect the function of the arm. The
study was approved by the Ethics Committee, Göteborg
University, Sweden. All subjects received written informa-
tion about the study and gave their consent before enter-
ing the study.
Research set-up and procedure
A standardized test protocol was developed by testing a
range of different marker positions, camera positions and
subject positions. The final protocol met the measure-
ment goals and did not interfere with or physically restrict
the natural movement of drinking.
The ProReflex motion capture system
The three-dimensional motion analysis was performed
with a ProReflex Motion Capture System (Qualisys, Swe-
den). Data was transferred to Windows-based data acqui-
sition software (Qualisys Track Manager). This system
includes an advanced optoelectronic camera system that
produces clean and accurate 3D data. The measurement
accuracy is better at high frequencies (120 Hz–240 Hz)
and is dependent on the size of markers. The system has
been shown to calculate angles within 0.07 degrees of the
actual angle [21]. Data analysis itself was performed with
special software developed in MATLAB (The Mathworks,
Inc).
Ballshaped markers, positioned on the body, reflect infra-
red light from camera flashes, and only those markers are
displayed on the computer image. The markers image pro-
duces X, Y and Z coordinate values throughout the meas-
ured movement. The coordinate system was defined with
X-axis directed forward (anteriorly), Y-axis directed later-
ally and Z-axis directed upward (superiorly).
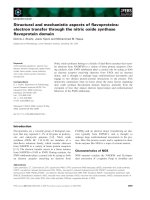
In the present study three cameras with a capture rate of
240 Hz were used. The cameras were positioned around
the testing area as shown in Figure 1. The system was cal-
ibrated to a measurement volume of 75 × 75 × 65 cm and
validated with a person sitting in the measurement area to
ensure the visibility of markers throughout the drinking
activity. The length of the camera capture period was set to
10 seconds, which was enough for a person to drink one
swallow. A web camera was also used during measure-
ments to complement motion data with synchronized
video data.
Marker sites
Nine spherical 12 mm and 19 mm reflective markers were
attached to the skin with double-sided tape. The markers
were positioned on the superficial bony prominences to
reduce the effect of skin movement and to facilitate
marker replacement in repeated testing. Similar marker
positions have been used in other kinematics studies [11-
13,21]. Markers were placed on the index finger (distal
interphalangeal joint – DIP II), hand (third metacar-
pophalangeal joint – MCP III), wrist (styloid process of
ulna), elbow (lateral epicondyle), shoulder (in the middle
part of acromion), thorax (upper part of sternum), face
(highest point on the left cheek) and two markers were
placed on the object (near to the upper and lower edge of
drinking glass). The thorax marker was used as a reference
point to control amount of trunk displacement during the
measurement.
Set-up and procedure
All subjects performed the drinking movement with their
right arm. Subjects were seated on a 43 cm high, strait-
back chair in front of a 72 cm high table. A hard non-
translucent plastic drinking container was used, since
glass would reflect the camera flashes and disturb the
motion capture. The drinking glass had a 7 cm diameter
with a 9.5 cm height (volume 2.4 dl) and was filled with
1.5 dl water (half-full), and placed at a distance of 30 cm
from the table edge, in a marked area 8 × 8 cm in the mid-
line of the body. The set-up is shown in Figure 1.
In the start position, the subjects were sitting against the
chair back, feet on the floor. Right arm was pronated with
the hand resting on the table and wrist line close to the
edge of the table. Subjects were asked to find a comforta-
ble sitting position with right upper arm in vertical and
adducted position and approximately 90 degrees flexion
at elbow. The subject's left hand was resting on the lap.
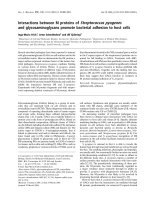
View from above of the set-up for the drinking activity with the XYZ coordinate systemFigure 1
View from above of the set-up for the drinking activity with
the XYZ coordinate system. The subject is represented with
the arm in the initial position and marker sites are shown as
black dots.
camer
a
camer
a
y
x
z
camera
camera
y
x
z
camera
Journal of NeuroEngineering and Rehabilitation 2006, 3:18 />Page 4 of 11
(page number not for citation purposes)
Drinking movement included reaching and grasping the
glass with all fingers (no fingers at the bottom), lifting the
glass from the table and taking a drink (one swallow),
placing the glass back on the table inside the marked area
and returning to the start position. Subjects were
instructed to sit against the chair back during the whole
drinking task. This was also verified by a marker on the
thorax, which provided exact kinematic displacements of
the trunk during the whole task. The intention was to keep
the drinking activity as normal as possible and let the sub-
jects sit close enough to reach the drinking glass without
their back leaving the chair support.
The subjects were allowed to try the drinking movement a
few times to find a comfortable sitting position. When
ready, the test leader announced, "you can start now", and
the subject started the drinking task at a comfortable self-
paced speed. Every subject was recorded for at least three
and at most six trials in one testing session, depending on
how well the computer could track the markers automat-
ically.
To assess the consistency of the test protocol we per-
formed test-retest on six randomly chosen subjects. Those
six subjects were first tested according to the protocol.
Then the subject left the measurement area and markers
were removed. After a 5–10 minutes break the markers
were replaced and subject was tested a second time.
Data analysis and raw data handling
After the recording process, each of the markers were iden-
tified in Qualisys Track Manager and reviewed to ensure
that the markers were tracked correctly throughout the
data capture. In some recordings certain markers were
partly hidden or merged with other markers and could not
be tracked automatically. While, it was possible to per-
form a manual analysis of this data, this would demand
an excessive amount of work and was considered not fea-
sible according to the goal of this study. From all record-
ings (test-retest included), 7 % of the recordings were
excluded due to high segmentation and gaps in data. In
the final analysis the first three successful recordings from
every subject were used and the mean of those were calcu-
lated as a final measurement value for each subject.
The data was transferred to the MATLAB software for fur-
ther analysis. For every recording we calculated and plot-
ted coordinate data showing position, velocity and
acceleration. The drinking task was broken down in five
logical phases: reaching, forward transport, drinking, back
transport, returning. Phase definitions are described in
detail under the results.
The goal was to find and define parameters that could
render us clinically useful information and be comparable
for different patient groups in later studies. After analyz-
ing the graphical plots from the recordings the kinematic
data analysis was focused on following variables:
• Movement times were calculated for the whole move-
ment (total movement time) and separately for each
phase based on phase definitions.
• Peak velocities, were determined for the different move-
ment phases from tangential velocity traces of hand
marker.
• Time to peak velocity and percentage of time to peak
velocity were calculated for reaching phase.
• Joint angles were computed from the position data for
elbow flexion/extension, for shoulder flexion/extension
in sagittal plane and abduction/adduction in frontal
plane. The elbow angle was determined by the angle
between the vectors joining elbow and wrist markers and
the elbow and shoulder markers. Shoulder angle was
determined by the angle between the vectors joining the
shoulder and elbow markers and the vertical vector from
the shoulder marker toward the hip. Joint angles for dif-
ferent movement phases and the range for all movement
were calculated.
• Interjoint coordination was calculated with correlation
coefficient (Pearson product moment correlation)
between the shoulder and elbow joint excursions for
reaching phase from rawdata in Matlab software.
Statistical analysis
Statistical analyses were performed with SPSS (Statistical
Packages for Social Sciences, 11.0). Descriptive statistics
including mean, standard deviation and 95% confidence
intervals (CI) were calculated for the study group of 20
subjects and for test-retest data. The mean of the three
recordings was used in statistical calculations.
The difference between test and retest was analyzed with a
paired t-test with alpha level at 0.05 and with hypothesis
testing based on confidence intervals of the test-retest
data. The agreement between test and retest was evaluated
with 95% limits of agreement (LOA) method [22,23]. The
95% LOA were calculated as the mean of difference ± 1.96
standard deviations of difference. This method calculates
the limits within which expected differences between two
measurements will lie with 95% probability. To check the
assumptions of the limits of agreement the differences
were plotted against the average of the two measurements
for every variable.
Journal of NeuroEngineering and Rehabilitation 2006, 3:18 />Page 5 of 11
(page number not for citation purposes)
Results
Phase definitions and movement times
The drinking task was broken down into five logical
phases: reaching (includes grasping), forward transport
with glass to mouth, drinking, back transport with glass
(includes release of grasp) and returning the hand to the
initial position. The mathematical and dynamical proper-
ties of kinematic data were used to determine the start and
the end of each phase. Five subsequent phases for the
drinking movement were defined and verified for all
measurements (Table 1). Based on the phase definitions
the movement times for each phase and for the whole
movement (total movement time) were calculated and are
displayed Table 2.
Marker position analysis
Position graphs with coordinate data from each marker
were plotted in three different dimensions (transverse,
sagittal and frontal plane) for qualitative visual analysis.
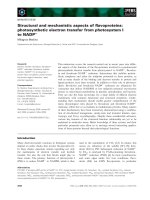
The position trajectories from five markers are shown in
Figure 2.
Position graphs for all subjects were rather similar and
had a characteristic path pattern. The elbow, wrist and
hand markers had distinguished and smooth movement
trajectories. The displacement data for the thorax, face and
shoulder markers showed that the biggest displacement
occurred in sagittal plane. The thorax marker remained
relatively motionless with mean displacement 22.9 mm,
confirming that subject's upper body was fairly still. Even
face (mean displacement 47.6 mm) and shoulder markers
(mean displacement 76.2 mm) had a small movement.
The wrist, hand and finger markers had rather similar tra-
jectories thus in all presented graphs only the hand
marker is plotted representing the endpoint trajectory.
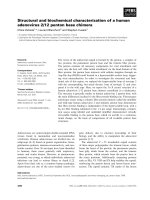
Hand marker velocities
The tangential velocity profiles were calculated and plot-
ted for the hand marker. Those velocity profiles were
smooth and bell-shaped with one predominant peak.
There were four distinctive velocity peaks for the whole
movement task representing different movement phases.
The velocity in the reaching and returning phases was
approximately double the velocity in the transporting
phases when the subject was holding the drinking glass.
Hand tangential velocity decreased shortly before the
glass was grasped or released. The back transport phase
had a longer movement time and the peak velocity
occurred earlier compared to the forward transport phase,
thus indicating that placing the glass back on the table
required more precision. The hand marker velocity profile
for the drinking task is shown in Figure 3. Kinematic data
for peak velocities in different phases, time to peak veloc-
ity and percentage of the peak velocity in reaching phase
is shown in Table 2.
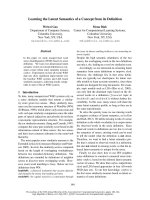
Joint angles
Joint angles were calculated for the elbow (extension-flex-
ion) and also for the shoulder in sagittal plane (flexion-
extension) and in frontal plane (abduction and adduc-
tion). Joint angles versus timeline are displayed in Figure
4. Kinematic data for joint angles are presented in Table 2.
The elbow angle graph demonstrated a characteristic
smooth movement pattern with the maximal elbow
extension during grasping and releasing the glass. The
maximal elbow flexion occurred during the drinking
phase.
Shoulder flexion approached the maximal angle in the
end of the reaching phase, and peaked shortly thereafter
second time during the drinking phase. Shoulder abduc-
tion approach a small peak in the middle of reaching,
indicating a slight half-circular arm movement in the
Table 1: Phase definitions for drinking task.
Phase name Start Detected by End Detected by
Reaching (includes
grasping)
Hand movement begins Hand marker velocity
surpassed 2% of the peak
velocity
Hand begins to move
towards the mouth with
the glass
Elbow angle is in maximal
extension
Forward transport
(glass to mouth)
Hand begins to move
towards the mouth with
the glass
Elbow angle is in maximal
extension
Drinking begins Hand marker velocity
returned to (5 %) of the
peak velocity
Drinking Drinking begins Hand marker velocity
returned to (5 %) of the
peak velocity
Drinking ends Hand marker velocity
surpassed 5% of the peak
velocity
Back transport (glass to
table, includes release
of grasp)
Hand begins to move to
put the glass back to table
Hand marker velocity
surpassed 5% of the peak
velocity
Hand releases the glass and
begins to move back to
initial position
Elbow angle is in maximal
extension
Returning (hand back
to initial position)
Hand begins to move back
to initial position
Elbow angle is in maximal
extension
Hand is back resting in
initial position
Hand marker velocity
returned to 2% of the peak
velocity
Journal of NeuroEngineering and Rehabilitation 2006, 3:18 />Page 6 of 11
(page number not for citation purposes)
reaching phase. The maximal adduction was achieved in
the end of reaching phase and followed up by a maximal
abduction during drinking phase.
The second part of the movement was almost identical
with the first part in all graphs. The movement patterns
were fairly similar for all subjects. Some stylistic differ-
ences were noticed with slightly different drinking styles.
For example some subjects had their elbow near to the
body (adducted) and others away from body (more
abducted) in the drinking phase. For example the joint
angle in abduction in drinking phase ranged from 20.9 to
74.9 degrees with a mean of 39.3 degrees and standard
deviation 13.0 which was the highest standard deviation
among the different joint angles.
Interjoint coordination between the shoulder and elbow
joint excursions during reaching phase showed a high cor-
relation. Correlation coefficients (r) ranged from 0.92 to
0.98 with a mean value of 0.96 (SD 0.02). Interjoint coor-
dination for the shoulder and elbow joints were plotted
on an angle/angle graph for the reaching movement and
are shown in Figure 5. Trajectory for interjoint coordina-
tion was smooth and continuous, forming an almost lin-
ear correlation between elbow and shoulder joint
excursions.
Test-retest consistency
The mean difference between test and retest, 95% confi-
dence intervals of the difference, and 95% limits of agree-
ment (LOA) were calculated for all kinematic variables.
Statistics are presented in Table 3 for total movement
time, peak velocity, and joint angels, representing the cen-
tral components of kinematic analysis.
According to the assumptions of the limits of agreement,
the differences did not vary in any systematic way over the
range of measurement and all measurements were within
the 95% limits of agreement. All values of mean difference
were close to the zero and the widths of the 95% CI of dif-
ference and the 95% LOA were narrow. Hypothesis testing
based on confidence intervals of test and retest data con-
firmed that the mean values of the retest were within the
95% confidence intervals for the first test. Based on these
analyses we can say that there were confidently no differ-
ences between test and retest with 95% probability.
Discussion
The present study provides a detailed three-dimensional
kinematic analysis of the drinking task in control subjects.
A standardized test protocol for the drinking task was
developed, including the set-up of cameras, measurement
volume, location of markers and position of the subjects.
The test protocol demonstrated a good consistency in test-
retest and provided clear and accurate results. The phase
analysis which divided the drinking task into five sequen-
tial phases was unique for the present study. Kinematic
data are presented for the movement times, marker posi-
tions, velocities and joint angles for the control subjects.
The drinking activity is a complex task in terms of kine-
matics. It contains several different movements as reach-
ing, grasping, transporting the glass and drinking. In the
present study, five sequential phases were identified:
reaching, forward transport, drinking, back transport and
returning. This phase analysis gives a logical and easy
observable structure for the drinking task and provides the
possibility to investigate different variables separately in
each phase. There are no studies, to our knowledge, which
have presented the phase definitions for the whole drink-
ing movement; hence the phase analysis applied for the
drinking task in this study is unique.
Table 2: Kinematic variables for the control subjects (n = 20).
Kinematic variables Mean SD 95% CI
Movement times (s)
Reaching 1.21 0.22 1.11–1.31
Forward transport 1.15 0.19 1.06–1.24
Drinking 1.71 0.44 1.51–1.92
Back transport 1.77 0.37 1.60–1.94
Returning 1.00 0.14 0.94–1.07
Total movement time 6.84 1.00 6.38–7.32
Peak velocity (PV) (mm/s)
PV for reaching 551 78.3 514–587
PV for forward transport 273 50.4 249–296
PV for back transport 228 66.8 196–259
PV for returning 560 79.1 523–597
Time to PV in reaching (s) 0.41 0.10 0.37–0.46
Time to PV in reaching (%) 34.3 5.7 31.7–37.0
Joint angles (°)
Shoulder (sagittal plane)
Initial position 5.5 2.7 4.2–6.8
Grasping (maximal flexion) 48.9 5.1 46.5–51.2
Drinking (maximal flexion) 53.5 7.0 50.2–56.8
Range 48.3 7.5 44.8–51.8
Shoulder (frontal plane)
Initial position 15.0 4.0 13.1–16.9
Reaching (abduction) 27.8 6.0 25.0–30.7
Grasping (maximal adduction) 10.6 4.6 8.5–12.8
Drinking (maximal abduction) 39.3 13.0 33.2–45.4
Range 28.7 10.5 23.8–33.6
Elbow
Initial position 105.0 6.8 101.8–108.2
Grasping (maximal extension) 42.5 7.3 39.1–45.9
Drinking (maximal flexion) 136.4 3.8 134.6–138.1
Range 93.9 8.1 90.1–97.7
Abbreviations: SD – standard deviation, CI – confidence interval
Journal of NeuroEngineering and Rehabilitation 2006, 3:18 />Page 7 of 11
(page number not for citation purposes)
The concept of three-dimensional joint movements and
joint angles is a quite unusual for clinicians. It is common
to think of two-dimensional movement in different
planes. To make this study more obtainable for clinicians
and more comparable with other clinical studies, we
divided the shoulder elevation into abduction and flexion
and recalculated the values for elbow angle into an ana-
tomical angle rather the technical/mathematical angle
values. One limitation of this study, for example, is that
we have not analyzed the rotations in shoulder and elbow
joints or joint angles in the wrist joint. Wrist joint motion
and forearm rotations could provide additional informa-
tion of different drinking strategies. Although the system
has the potential to provide this information, a much
more complex set-up and analysis would be required. The
goal of this study was not to measure the joint angles in
all joints and in all degrees of freedom. Our intention was
to collect informational and clinically useful data for the
drinking task with the existing camera system and accord-
ing to the current stage of software development.
We have used surface markers and computed the joint
angles as the angles between the corresponding vectors
joining the adjacent markers or vertical vector. It must be
understood that those joint angles do not pass through
the centers of rotation of the joints, thus they are not the
true joint angles. However, placing the markers on the
well-defined superficial bony prominences increases the
reproducibility of data on different occasions. This was
confirmed by the good consistency in test-retest in this
study as well in other studies using surface markers [21].
Earlier studies of reaching movements have reported that
trunk movement is acting both as stabilizer and as an inte-
gral component in positioning the hand close to the target
[24]. Several studies have also shown that when reaching
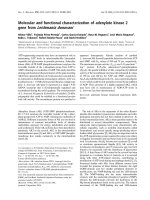
Position graphs with coordinate data from five markers, plotted in the three-dimensional graph and separately in transversal plane (X-Y), sagittal plane (X-Z), frontal plane (Y-Z) for one subjectFigure 2
Position graphs with coordinate data from five markers, plotted in the three-dimensional graph and separately in transversal
plane (X-Y), sagittal plane (X-Z), frontal plane (Y-Z) for one subject. X-axis directed anteriorly, Y-axix directed laterally, Z-axis
directed upward.
Journal of NeuroEngineering and Rehabilitation 2006, 3:18 />Page 8 of 11
(page number not for citation purposes)
within arm's length, healthy subjects use minimal trunk
displacement in contrast to hemiparetic subjects who use
a compensatory strategy involving trunk recruitment [24-
26]. In the present study the object was placed within an
arm's length and the subject could reach the glass while
sitting against the chair back during the whole task. Any
unintentional trunk displacement was also measured
using a marker on the thorax. The intention was to keep
the drinking movement as natural as possible but allow
some trunk displacement during the task.
Interjoint coordination for the elbow and shoulder joint
excursions during a reaching movement is shown to be
highly coupled in normal subjects, but has a significant
decrease in stroke subjects with hemiparetic arm [11,12].
Levin et al suggested that a measure of interjoint coordi-
nation can give us clinically beneficial information about
the subject's motor function. In the present study we
found a high correlation between the shoulder and elbow
joint excursions in reaching phase indicating a good inter-
joint coordination. Several studies have suggested using
angle/angle graphs for qualitative analysis of interjoint
coordination [11-13]. We have constructed the angle/
angle graphs for the reaching movement and found a
smooth and almost linear curve between elbow and
shoulder joint excursions.
All measurements systems including the kinematic sys-
tems, suffer from measurement error. A typical average
value for measurement error is estimated to be 2–3 mm in
all dimensions in gait analysis [8]. Turner-Stokes et al
found the absolute mean difference (differences between
two measurements in either direction are treated as posi-
tive) in joint range to be 2.3° for shoulder and 2.7° for the
elbow in repeated measures in the bowing arm of string-
playing musicians when the whole measurement system
was dismantled and re-set-up [21]. Replacing the markers
produced slightly greater differences than repositioning
and recalibration of the whole system [21]. In this study
we tested the consistency regarding the replacing the
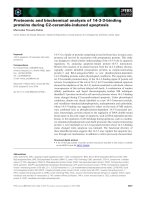
Hand marker velocity profile during the drinking task for one subjectFigure 3
Hand marker velocity profile during the drinking task for one subject.
Journal of NeuroEngineering and Rehabilitation 2006, 3:18 />Page 9 of 11
(page number not for citation purposes)
markers and the repositioning the subject. The absolute
mean difference in test-retest for shoulder abduction was
2.7°, for shoulder flexion 1.1°, for elbow extension 2.0°
and for elbow flexion 1.2°. These values are comparable
with results in study of Turner-Stokes et al.
The analysis of upper extremity tasks requires a measure-
ment set-up and camera system which can track all the
necessary markers throughout the whole movement. This
has been a challenge in the present study. From total 112
recordings we had to exclude 8 recordings (7%), because
of the high segmentation and gaps in data. This data lost
is acceptable considering the biomechanical complexity
in the upper extremity movement analysis [10]. The prob-
lem with segmentation and gaps in data have also been
reported in other studies, especially when few (two to
four) cameras are used and when the movement is com-
plex in degrees of freedom [17,20,21]. As reported in
other studies, the set-up of camera systems and data anal-
ysis in special software programs required a good collabo-
ration between clinicians and engineers in the present
study [10,21]. Results of this study corroborate that that
the use of the existing motion capture system, as used in
the presented protocol, still has some limitations and
requires further refinement to be feasible for clinical use
with persons with neurological disorders. The main clini-
cal benefit of this study is the establishment of the phases
of an important activity of daily living (ADL). The estab-
lishment of the phases can simplify the camera measure-
ment system and allow for increased clinical use. In
addition, the phases provide a descriptive methodology to
classify strategies of drinking task of healthy persons.
Conclusion
Kinematic analysis has great possibilities to be used as an
outcome measure in clinical research especially when
optoelectronic camera systems become more readily
available in clinical settings. Our approach to investigate
Joint angles for elbow (extension-downward, flexion-upward) and for shoulder in sagittal plane (flexion-up, extension-down) and in frontal plane (abduction-up, adduction-down)Figure 4
Joint angles for elbow (extension-downward, flexion-upward) and for shoulder in sagittal plane (flexion-up, extension-down)
and in frontal plane (abduction-up, adduction-down).
Journal of NeuroEngineering and Rehabilitation 2006, 3:18 />Page 10 of 11
(page number not for citation purposes)
and analyze a goal-oriented daily task has a great clinical
potential. However a certain degree of standardization is
indispensable in order to obtain repeatable and reliable
results. Further development of objective and reliable
evaluation methods for upper extremity tasks is required,
particularly for natural and goal-oriented movements.
Consequently the next step is to use and test this protocol
on persons with impairments and disabilities from upper
extremities e.g. persons with neurological and muscu-
loskeletal diseases.
Authors' contributions
MAM contributed to the concept and design, acquisition,
analysis and interpretation of data, drafting and comple-
tion of the manuscript. KSS contributed to conception
and design, subsequent planning of study, analysis and
Table 3: Test-retest consistency for kinematic variables. The mean difference, 95% confidence intervals of mean difference and 95%
limits of agreement in test and retest for total movement time, peak velocity and joint angles (n = 6).
Kinematic variables Mean difference (95%CI) 95% CI of mean difference 95% LOA
Total movement time (s) 0.00 -0.22, 0.23 -0.43, 0.44
Peak velocity in reaching (mm/s) -17.1 -52.2, 18.0 -84.0, 49.7
Shoulder abduction in drinking (°) 1.5 -2.4, 5.5 -5.98, 9.01
Shoulder flexion in drinking (°) 0.12 -1.4, 1.6 -2.79, 3.02
Elbow extension in grasping (°) -0.16 -2.7, 2.4 -5.0, 4.7
Elbow flexion in drinking (°) 0.02 -1.7, 1.7 -3.3, 3.3
Interjoint coordination for the shoulder and elbow joint movements in reaching phase for one subjectFigure 5
Interjoint coordination for the shoulder and elbow joint movements in reaching phase for one subject. Reaching movement
starts from the right lower corner of the graph.
Publish with BioMed Central and every
scientist can read your work free of charge
"BioMed Central will be the most significant development for
disseminating the results of biomedical research in our lifetime."
Sir Paul Nurse, Cancer Research UK
Your research papers will be:
available free of charge to the entire biomedical community
peer reviewed and published immediately upon acceptance
cited in PubMed and archived on PubMed Central
yours — you keep the copyright
Submit your manuscript here:
/>BioMedcentral
Journal of NeuroEngineering and Rehabilitation 2006, 3:18 />Page 11 of 11
(page number not for citation purposes)
interpretation of data, and revised the manuscript criti-
cally. BJ contributed to conception and design, subse-
quent planning of study, and revised the manuscript. CW
contributed to conception and design, subsequent plan-
ning of study, analysis and interpretation of data, and
revised the manuscript critically. All authors read and
approved the manuscript to be published.
Acknowledgements
Thanks to all staff at the Rehabilitation Medicine, Sahlgrenska University
Hospital and particularly all the subjects who volunteered to participate in
this study, Ulla-Britt Bergström, OT for help in the start. This study
required a close collaboration between physical therapy and engineering
and I would like to thank Nasser Hosseini, PhD for assistance in motion
capture sessions and data analysis as well Steve Murphy, PhD for contrib-
uting with his excellent technical knowledge. This study was supported by
a grant from FoU-rådet for Göteborg and Södra Bohuslän and VR project
(VR K2002-27-VX-14318-01A).
References
1. Carr JH, Shepherd RB: Neurological rehabilitation : optimizing
motor performance. Oxford , Butterworth-Heinemann;
1998:350.
2. Parker VM, Wade DT, Langton Hewer R: Loss of arm function
after stroke: measurement, frequency, and recovery. Int
Rehabil Med 1986, 8(2):69-73.
3. Nakayama H, Jorgensen HS, Raaschou HO, Olsen TS: Compensa-
tion in recovery of upper extremity function after stroke: the
Copenhagen Stroke Study. Arch Phys Med Rehabil 1994,
75(8):852-857.
4. Broeks JG, Lankhorst GJ, Rumping K, Prevo AJ: The long-term out-
come of arm function after stroke: results of a follow-up
study. Disabil Rehabil 1999, 21(8):357-364.
5. Wade DT: Measurement in neurological rehabilitation. In
Oxford medical publications, Oxford , Oxford Univ. Press; 1992:388.
6. Finch E: Physical rehabilitation outcome measures : a guide to
enhanced clinical decision making. 2.th edition. Hamilton,
Ontario , Decker; 2002:ix, 292.
7. McCrea PH, Eng JJ, Hodgson AJ: Biomechanics of reaching: clini-
cal implications for individuals with acquired brain injury.
Disabil Rehabil 2002, 24(10):534-541.
8. Whittle MW: Gait analysis : an introduction. 3.th edition.
Oxford , Butterworth-Heinemann; 2002:x, 220.
9. Shumway-Cook A, Woollacott MH: Motor control : theory and
practical applications. 2. ed edition. Baltimore, MD , Lippincott
Williams & Wilkins; 2001:x, 614.
10. Rau G, Disselhorst-Klug C, Schmidt R: Movement biomechanics
goes upwards: from the leg to the arm. J Biomech 2000,
33(10):1207-1216.
11. Levin MF: Interjoint coordination during pointing movements
is disrupted in spastic hemiparesis. Brain 1996, 119 ( Pt
1):281-293.
12. Cirstea MC, Levin MF: Compensatory strategies for reaching in
stroke. Brain 2000, 123 ( Pt 5):940-953.
13. Michaelsen SM, Luta A, Roby-Brami A, Levin MF: Effect of trunk
restraint on the recovery of reaching movements in hemi-
paretic patients. Stroke 2001, 32(8):1875-1883.
14. Roby-Brami A, Feydy A, Combeaud M, Biryukova EV, Bussel B, Levin
MF:
Motor compensation and recovery for reaching in stroke
patients. Acta Neurol Scand 2003, 107(5):369-381.
15. Roby-Brami A, Jacobs S, Bennis N, Levin MF: Hand orientation for
grasping and arm joint rotation patterns in healthy subjects
and hemiparetic stroke patients. Brain Res 2003, 969(1-
2):217-229.
16. Safaee-Rad R, Shwedyk E, Quanbury AO, Cooper JE: Normal func-
tional range of motion of upper limb joints during perform-
ance of three feeding activities. Arch Phys Med Rehabil 1990,
71(7):505-509.
17. Murray IA, Johnson GR: A study of the external forces and
moments at the shoulder and elbow while performing every
day tasks. Clin Biomech (Bristol, Avon) 2004, 19(6):586-594.
18. Murgia A, Kyberd PJ, Chappell PH, Light CM: Marker placement to
describe the wrist movements during activities of daily living
in cyclical tasks. Clin Biomech (Bristol, Avon) 2004, 19(3):248-254.
19. Maitra KK, Junkins MD: Upper extremity movement pattern of
a common drinking task in well elderly women: A pilot
study. Occup Ther Int 2004, 11(2):67-81.
20. Trombly CA, Wu CY: Effect of rehabilitation tasks on organi-
zation of movement after stroke. Am J Occup Ther 1999,
53(4):333-344.
21. Turner-Stokes L, Reid K: Three-dimensional motion analysis of
upper limb movement in the bowing arm of string-playing
musicians. Clin Biomech (Bristol, Avon) 1999, 14(6):426-433.
22. Bland JM, Altman DG: Statistical methods for assessing agree-
ment between two methods of clinical measurement. Lancet
1986, 1(8476):307-310.
23. Bland JM, Altman DG: Applying the right statistics: analyses of
measurement studies. Ultrasound Obstet Gynecol 2003,
22(1):85-93.
24. Kaminski TR, Bock C, Gentile AM: The coordination between
trunk and arm motion during pointing movements. Exp Brain
Res 1995,
106(3):457-466.
25. Levin MF, Michaelsen SM, Cirstea CM, Roby-Brami A: Use of the
trunk for reaching targets placed within and beyond the
reach in adult hemiparesis. Exp Brain Res 2002, 143(2):171-180.
26. Michaelsen SM, Levin MF: Short-term effects of practice with
trunk restraint on reaching movements in patients with
chronic stroke: a controlled trial. Stroke 2004, 35(8):1914-1919.