báo cáo khoa học: " The implications of trade liberalization for diet and health: a case study from Central America" ppt
Bạn đang xem bản rút gọn của tài liệu. Xem và tải ngay bản đầy đủ của tài liệu tại đây (779.3 KB, 15 trang )
BioMed Central
Page 1 of 15
(page number not for citation purposes)
Globalization and Health
Open Access
Research
The implications of trade liberalization for diet and health: a case
study from Central America
Anne Marie Thow*
1
and Corinna Hawkes
2
Address:
1
Menzies Centre for Health Policy, Victor Coppleson Bldg (D02), University of Sydney, Sydney, NSW 2006, Australia and
2
Research
Fellow, International Food Policy Research Institute, current affiliation: Research Fellow, School of Public Health, University of Sao Paolo, Sao
Paulo, Brazil
Email: Anne Marie Thow* - ; Corinna Hawkes -
* Corresponding author
Abstract
Background: Central America has undergone extensive trade liberalization over the past two
decades, and has recently signed a Free Trade Agreement with the United States. The region is also
experiencing a dual burden of malnutrition with the growth of dietary patterns associated with the
global 'nutrition transition'. This study describes the relationship between trade liberalization
policies and food imports and availability, and draws implications for diet and health, using Central
America as a case study region.
Methods: Changes in tariff and non-tariff barriers for each country were documented, and
compared with time-series graphs of import, production and availability data to show the outcome
of changes in trade policy in relation to food imports and food availability.
Results: Changes in trade policy in Central America have directly affected food imports and
availability via three avenues. First, the lowering of trade barriers has promoted availability by
facilitating higher imports of a wide range of foods. Second, trade liberalization has affected food
availability through promoting domestic meat production. Third, reductions in barriers to
investment appear to be critical in expansion of processed food markets. This suggests that changes
in trade policies have facilitated rising availability and consumption of meat, dairy products,
processed foods and temperate (imported fruits) in Central America.
Conclusion: This study indicates that the policies of trade liberalization in Central American
countries over the past two decades, particularly in relation to the United States, have implications
for health in the region. Specifically, they have been a factor in facilitating the "nutrition transition",
which is associated with rising rates of obesity and chronic diseases such as cardiovascular disease
and cancer. Given the significant cost of chronic disease for the health care system, individuals and
the wider community, it is critical that preventive health measures address such upstream
determinants of poor nutrition.
Background
In what has been termed the 'nutrition transition', the
developing world is currently experiencing rapid shifts in
food availability and consumption. Diets based on local
staples are giving way to rising consumption of fats, ani-
mal products and sweeteners, at the same time as physical
Published: 28 July 2009
Globalization and Health 2009, 5:5 doi:10.1186/1744-8603-5-5
Received: 12 March 2009
Accepted: 28 July 2009
This article is available from: />© 2009 Thow and Hawkes; licensee BioMed Central Ltd.
This is an Open Access article distributed under the terms of the Creative Commons Attribution License ( />),
which permits unrestricted use, distribution, and reproduction in any medium, provided the original work is properly cited.
Globalization and Health 2009, 5:5 />Page 2 of 15
(page number not for citation purposes)
activity levels are declining. The consequences of this die-
tary and lifestyle change are being seen throughout the
developing world in rapidly increasing rates of obesity,
diabetes and other non-communicable disease [1,2]. The
causes of this dietary transition are diverse, and while
individual lifestyle choices play a role, macro factors are
critical in shaping the food environment through their
influence on food availability and price [3].
A core upstream driver of the nutrition transition is glo-
balization [4-6]. Reductions in barriers to trade, the
growth of transnational food companies, foreign direct
investment and liberalization of media advertising have
all been highlighted as inter-related avenues through
which globalization is driving the nutrition transition [7].
In particular, reductions in barrier to trade -trade liberali-
zation – is one of the processes of globalization com-
monly cited as contributing to dietary change [8]. In the
literature on globalization, diet, obesity and chronic dis-
eases, it is often assumed that trade liberalization encour-
ages greater imports of "western" foods, thus changing
food consumption patterns and, therefore, diets and
health. However, there are few studies that actually
attempt to identify if there is a direct link between trade
policy and the food environment from a public health
perspective [9].
This paper investigates the impact of trade policy change
on food imports and availability in Central America, in
the context of regional changes in diet and health and a
progressive liberalization agenda.
The region provides a particularly useful case study for
several reasons. First, since the early 1990s, Central Amer-
ica has undergone a period of trade liberalization with its
leading trading partner, the United States, for a range of
foodstuffs. This liberalization entered a new phase in
2004 with the signing of the US-Central American Free
Trade Agreement (CAFTA), which has been implemented
progressively – albeit following different timeframes in
different countries – since 2005 [10,15]. Second, health
and dietary data from the region suggest that Central
American countries are at varying stages of the nutrition
transition and are experiencing rising rates of diet-related
chronic disease, with associated health and economic
implications [11-13]. Third, information and data are
available about trade policies and trade between Central
America and the United States. And fourth, the countries
have similarities and differences that provide the opportu-
nity for some cross-country analysis.
This article focuses on one key aspect of trade liberaliza-
tion, the reduction of barriers to food imports, with par-
ticular reference to the impacts of trade policy on food
imports from the regions' key trading partner, the United
States.
Methods
Data sources
Food availability and production data were sourced from
the FAOSTAT database [14,15]. FAO food balance sheet
and supply utilization account data were used to provide
information on food availability (for human consump-
tion), and the ProdSTAT database provided information
on domestic production. While FAO data have some lim-
itations associated with necessary estimates made to com-
pensate for limited data, it is generally accepted that they
provide a useful indication of the food supply – particu-
larly in relation to trends over time (see [16] for further
detail).
Food export data from the United States Department of
Agriculture Foreign Agricultural Service [17] were
extracted for US exports into Central American countries
at the internationally consistent "6-digit" level of the Har-
monized Tariff Schedule, which can be matched exactly
with information on changes in tariff and non-tariff barri-
ers. FAS trade data are collected and published online by
the US Government. FAO TradeStat Detailed Trade Data
[18] were used to obtain information on all imports into
Central America (i.e. not just from the USA), although
direct comparison with the FAS data (and with tariff
changes) is not possible.
Information on tariff and non-tariff barriers, and changes
in trade policies, was primarily sourced from USDA FAS
Attaché Reports. These reports are prepared by in-country
FAS officials, and are designed to assist US exporters in
their assessment of overseas markets. Additional sources
of information were the National Trade Estimate of the
United States Trade Representative, the World Trade
Organization's Trade Policy Review, trade policy analyses
conducted by the USDA's Economic Research Service, the
UNCTADs TRAINS database and academic articles.
Analysis
Changes in tariff and non-tariff barriers for each country
were documented, and were compared with time-series
graphs of the import, production and availability data to
identify the outcome of changes in trade policy in relation
to food imports and food availability. Findings are pre-
sented for the five core food categories imported from the
United States – staple grains and animal feed, meat, dairy,
fruits and vegetables, and snacks – for the liberalizing
period: 1990–2006.
Results
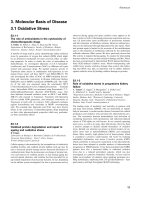
Overall changes in food imports, production and
availability
Average tariffs in Central America declined from 45% in
1985 to around 6% in 2000. In line with this, total food
imports into the Central American countries more than
doubled between 1990/92–2003/05 from 4.5 to 9.6 mil-
Globalization and Health 2009, 5:5 />Page 3 of 15
(page number not for citation purposes)
lion tonnes [19]. Honduras and Costa Rica registered the
highest rates of growth, followed by Guatemala and El
Salvador (Figure 1, Table 1). Food imports into Central
America from the United States alone almost tripled since
1990 [17].
Between 1990 and 2005, the increase in the amount of
food imported was relatively greater than the increase in
production, indicating that imports became a more
important source of foods consumed in the region (Table
1). Food available for consumption increased by less than
the combined increase of production and imports, reflect-
ing the fact that a greater proportion of the food supply is
exported (90% increase between 1990 and 2005) or used
as animal feed (75% increase). While these trends reflect
the overall situation in Central America, there is a great
deal of variation between the different food groups and
countries, which are discussed below in relation to chang-
ing trade policies in the region.
Staple grains
The United States is the leading source of imports of the
three major grains, corn, rice, and wheat, into Central
America. By volume, these grains comprise over 80% of
all food imported from the United States [17], and
imports have grown significantly since 1990, particularly
of rice (Table 2).
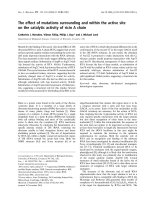
As rice imports have increased, domestic production has
declined. However, the rise in imports has been greater
than the decline of production, resulting in a greater over-
all level of supply, with rice availability increasing in all
countries (Figure 2). In 1990, 39% of rice available for
consumption in Central America was imported; the figure
now stands at 69%. Over 90% of these imports are of
rough rice (which needs to be milled before consump-
tion).
Since rice is an important crop for domestic producers, it
has historically been subject to high levels of protection
and high tariffs remain in place (30–60%). Nevertheless
trade policies for rough rice have been liberalized through
alternate means: the removal of import licensing systems,
the elimination of price banding mechanisms, the intro-
duction of tariff-rate quotas, and the relaxation of phy-
tosanitary requirements.
These new trade policies have had a clear impact on
imports. In Honduras, for example, the replacement of
the system of import licensing and administrative permits
by a quota system in 1994 and relaxation of phytosanitary
restrictions in 1997 were followed by a steady increase of
rice imports [20-22]. In 1999, the government lowered
the import tariff to 1%, further stimulating imports. In
contrast, Nicaragua has had the smallest increase of rice
Table 1: Food imports, production and availability for consumption in the Central American countries, 1990/92–2003/05*, million
metric tonnes
Average 1990/02 Average 2003/05 % increase 1990/92–2003/05
IMPORTS Million metric tonnes
Costa Rica 0.7 1.9 173
El Salvador 1.3 2.7 112
Guatemala 1.1 2.7 144
Honduras 0.5 1.4 167
Nicaragua 0.9 1.1 15
Central America 4.5 9.6 115
PRODUCTION
Costa Rica 7.4 11.0 49
El Salvador 6.0 7.0 16
Guatemala 15.2 24.4 61
Honduras 6.3 11.6 86
Nicaragua 3.9 6.6 67
Central America 38.8 60.6 56
AVAILABILITY FOR CONSUMPTION
Costa Rica 3.4 4.8 40
El Salvador 4.0 5.0 24
Guatemala 6.1 8.2 35
Honduras 3.6 6.4 78
Nicaragua 2.6 3.5 37
Central America 19.6 27.9 42
Source: [19] * three-year average
Note: Changes in imports and production do not directly relate to changes in availability because of increases in food export and consumption by
animals.
Globalization and Health 2009, 5:5 />Page 4 of 15
(page number not for citation purposes)
imports in the region. Again, this reflects trade policies. In
1992, the government implemented a price band mecha-
nism for rice, which directly restricted rice imports from
the US and since then policies have remained restrictive.
Notably, as a means of protecting the local rice milling
industry – and in response to extensive lobbying by this
industry – the market for milled rice has hardly been lib-
eralized at all and imports have remained extremely low.
Trade policies have, then, facilitated greater availability of
rice in the region, but with variation between countries
due to policy differences. The situation for corn is a little
more complex because there are two types of corn: yellow
(animal feed) and white (human consumption). While
corn imports into Central America have increased, this is
Total food imports into the Central American countries, 1990–2005Figure 1
Total food imports into the Central American countries, 1990–2005. Note: "Food" includes animal meat (bovine,
swine, sheep, poultry); fish; animal products (e.g. dairy products, eggs); vegetables; fruit; cereal grains; flours; raw nuts & seeds;
fats & oils (some appear to be for industrial use, but are not split out for this spreadsheet); processed meats; sugar; cocoa
beans & derivatives; cereal foods (processed); preserved foods (esp. vegetables); food preparations; non-alcoholic beverages. It
excludes: live animals; inedible animal products (e.g. hair); plants, cut flowers etc; coffee, tea, spices; seeds definitely for planting
etc; gums & saps; vegetable material (inedible); vegetable waxes & residues; alcohol & alcoholic drinks. Source [15].
0
500
1000
1500
2000
2500
3000
3500
1990 1991 1992 1993 1994 1995 1996 1997 1998 1999 2000 2001 2002 2003 2004 2005
Year
Food imports 1000 MT
Costa Rica
El Salvador
Guatemala
Honduras
Nicaragua
Table 2: Imports of the three major grains into Central America
from the United States, 1990/91 and 2005/06
1990/91*, MT
(% of total)
2005/06*, MT
(% of total)
% change
1990–2006
Yellow corn 562,071 (43%) 2,152,995 (51%) 283
White corn 0 204,733 (5%) NA
Wheat 694,627(53%) 1,175,954 (28%) 69
Rice 64,623 (5%) 664,123 (16%) 928
Total 1,321,321 4,197,806 318
* 2-year averages because of zeros in data for 1989 and 2004;
percentages do not add exactly due to rounding.
NA: Not Applicable
Source: [17]
Globalization and Health 2009, 5:5 />Page 5 of 15
(page number not for citation purposes)
overwhelmingly the result of increasing imports of yellow
corn for animal feed (discussed in the next section) (Table
2). Imports of staple grain used for human consumption,
white corn, remain limited due to high import barriers in
place designed to protect domestic producers. These barri-
ers continue under CAFTA implementation.
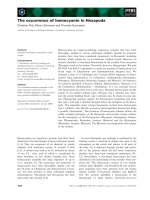
Meat and animal feed
The United States is the leading exporter of meat into Cen-
tral America, and since 1990, meat exports have grown
significantly (Figure 3). This largely reflects increasing
exports of poultry and pork: poultry imports into Central
America increased from 22% to 71% of total meat
imports between 1990 and 2006, and pork imports from
6–18% (previously, imports were dominated by offal and
preserved meat) (Figure 3). The steep increase of poultry
imports is largely due to frozen poultry cuts, which now
form 30% of all meat imports from the United States.
Eighty-eight percent of these cuts are frozen chicken leg
quarters, a by-product of chicken breast production in the
United States [23].
Guatemala receives 90% of all poultry imported from the
United States [17], and 58% of all chicken imports into
the region [19]. In 2005, imported poultry from the
United States represented approximately 30% of local
consumption in Guatemala [24].
Imports of frozen chicken leg quarters into Guatemala
grew particularly fast after 1997, a change that reflects the
liberalization of trade policy, which progressed after the
signing of the Peace Accords in 1996 [25]. Up until to
1997 (from at least 1995), there was a 3600 MT/year
quota with a 20% in-quota tariff and 50% out-of-quota
tariff, which created a strong disincentive to exporters
[26]. However, in October 1996, the government
announced a new poultry import policy that doubled the
annual TRQ, and reduced the in-quota tariff to 15% [27].
Imports started to rise immediately (Figure 4). Reinforc-
ing this policy, the TRQ was increased to 39,452 MT in
2005 with an in-quota applied tariff of 5%. According to
analysis by the USDA "This greatly stimulated U.S.
exports, and by 2005 poultry exports reached the highest
Production, imports and consumption of rice in Central America, 1990–2005Figure 2
Production, imports and consumption of rice in Central America, 1990–2005. Source [15].
0.00
500.00
1,000.00
1,500.00
2,000.00
2,500.00
1990 1991 1992 1993 1994 1995 1996 1997 1998 1999 2000 2001 2002 2003 2004 2005
Year
1000 MT
Production quantity (1000 tonnes)
Im port of Raw&Processed in Primary Eq. + Food Aid (1000
tonnes)
Food consumption quantity (1000 tonnes)
Globalization and Health 2009, 5:5 />Page 6 of 15
(page number not for citation purposes)
value ever reported ($ 44.8 million)" [28]. As a result of
the policy changes, "the growth in consumption is likely
to have been picked up by US imports, leaving insignifi-
cant production growth" [29].
Rising chicken imports into Guatemala have had a dis-
cernible impact on total chicken availability in the region
(Figure 5). Reflecting much more restrictive import poli-
cies, imports into other countries have increased by a
smaller amount. However, the limited import liberaliza-
tion that did occur in the other Central American coun-
tries also boosted imports. For example, for most of the
1990s, Honduras implemented a 100% tariff on poultry
meat and phytosanitary requirements restricted imports.
In 1999, Honduras' tariff binding for poultry meat
declined to 50%, and the country loosened its zoosanitary
import requirements for poultry in an effort to comply
with its WTO commitments [30,31]. Subsequently, poul-
try imports have increased by 20% per year and Honduras
has emerged as the second largest chicken importer in the
region [32].
Trade liberalization policies in Central America have
clearly had an impact on chicken availability. However,
the vast majority of increasing availability has been a
result of increased domestic production (Figure 5). Yet
this, too, partly reflects the impact of trade liberalization,
since trade policies have stimulated the import of one of
the major inputs into chicken production: yellow corn.
Imports of yellow corn into Central America from the
United States increased by 283% between 1990 and 2006.
During the same time period, most countries imple-
mented limited but consistent measures to open up their
market for yellow corn. In 1997, Guatemala, the leading
corn importer in the region, opened up the TRQ for yel-
low corn imports, at a 5% in-tariff quota and a 55% out-
of-quota tariff [33]. The quota was subsequently
Meat imports from the United States into Central America, 1989–2006Figure 3
Meat imports from the United States into Central America, 1989–2006. Source [16].
0
10000
20000
30000
40000
50000
60000
70000
80000
1989
1990
1991
1992
1993
1994
1995
1996
1997
1998
1999
2000
2001
2002
2003
2004
2005
2006
Year
Meat imports into Central America, MT
MEAT, POULTRY
MEAT SALT/DRY/SMOKE
EDIBLE OFFAL
MEAT OF SWINE
MEAT BOVINE FROZEN
MEAT BOVINE FR/CH
PIG/POULTRY FAT
MEAT, OFFAL, OTHER
MEAT OF SHEEP/GOATS
HORSE,ASS,MULE MEAT
Globalization and Health 2009, 5:5 />Page 7 of 15
(page number not for citation purposes)
increased, reaching 100,000 MT by 2000 [34] and
501,820 MT in 2001 (5% in-tariff quota and out-of-quota
tariff of 35%) [35].
The result has been increased availability of yellow corn
for animal feed in the region (Figure 6). The increase can-
not be explained by rising domestic production, since this
is almost exclusively of white corn for human consump-
tion. It is worth pointing out that the main user of yellow
corn, the poultry sector, lobbied strongly for declines on
import barriers for yellow corn. The reduction in the tariff
on yellow corn implemented in El Salvador in 1995 was,
for example, "mostly a result of pressure brought to bear
on the government by poultry producers" [36].
Dairy
In contrast to other commodities, the United States is not
the leading dairy exporter into Central America: Europe
and Australasia are important exporters, and there is con-
siderable intra-regional trade. But between 1990/91 and
2004/06, imports of dairy products from the United States
into Central America increased by 949%, and the United
States became the leading exporter of two products: proc-
essed cheese and whey. Between 1990/91 and 2004/06,
imports of processed cheese – such as cheese slices, sold in
supermarkets and used by fast food outlets [37] – rose
3215% to comprise 37% of all cheese imports from the
US [17]. It is notable that the two leading importers of
processed cheese, Guatemala and Honduras, had signifi-
cantly lower tariffs than the other countries: less than 20%
compared with 35–66% in 2003 [38]. That these rela-
tively high tariffs have clearly not been completely pro-
hibitive, is likely to be because processed cheeses are
predominantly sold to the fast food industry, or wealthier
consumers able to afford higher prices in supermarkets.
The second product in which the United States dominates
is whey – the liquid byproduct of cheese production –
which formed 24.4% of all dairy product imports in
2004/06, an increase of 719% since 1989/91. The United
States is the leading producer and exporter of whey in the
world [39]. Whey and its derivatives are used in animal
feed, pet foods, and as an ingredient in many processed
foods [40]. The increase in imports is unlikely to have
been directly affected by changing trade policies, since tar-
iffs on whey in Central America have been consistently
low; in 2003, tariffs were 0–1% for all countries [38].
Rather, increased imports reflect increased demand from
Imports of chicken meat from the US into Guatemala, 1990–2005Figure 4
Imports of chicken meat from the US into Guatemala, 1990–2005. Source [16].
0
10,000
20,000
30,000
40,000
50,000
60,000
70,000
1989 1990 1991 1992 1993 1994 1995 1996 1997 1998 1999 2000 2001 2002 2003 2004 2005
Year
Quantity (tonnes)
Total poultry imports (4 digit HS code: 0207)
Imports of chicken leg quarters (10 digit HS code: 0207140010)
Globalization and Health 2009, 5:5 />Page 8 of 15
(page number not for citation purposes)
the growing food processing industry in the region and
extensive marketing by US whey exporters, with imports
responding in the absence of trade barriers.
Fresh and processed fruits and vegetables (including
potatoes)
Imports of fresh fruits and processed fruits and vegetables
from all countries into Central America have risen signifi-
cantly since 1990, while imports of fresh vegetables have
declined. Fresh fruit imports are largely (77%) of apples
and grapes, of which the United States, alongside Chile, is
the leading source of imports [18]. Although apples and
grapes make up just 5% of total fruit consumption in the
region, that they are consumed at all is a direct result of
imports, since domestic production is low (Figure 7). In
turn, increased imports have been associated with reduced
trade barriers. Imports of apples into the regions' largest
importing country, Guatemala, began to rise steeply in
1996, coinciding directly with the liberalization of the
import market for apples through implementation of a
TRQ and reduced in-quota tariff (12%). The new policy
also eliminated the import licensing requirement for
apples and allowed apple imports all year round [41].
Imports in 1996 filled the set quota; subsequent increases
in imports reflect the higher TRQ of 10,000–15,000 MT
set the following year [42].
With regard to processed products, the most significant
trend is the rise of imports of French fries, particularly
post-2000 (Figure 8). French fries formed 23% of all
imports of fruits and vegetables in 2004/06. The amount
imported varies between countries: Guatemala led with
35% in 2006, compared to Costa Rica at 5%. The United
States and Canada are the leading exporters of frozen
potatoes to the region [18].
There are no data on availability of French fries in Central
America, but if information from Costa Rica is illustrative,
Production, imports, and availability for consumption of chicken meat into Central America, 1990–2005*Figure 5
Production, imports, and availability for consumption of chicken meat into Central America, 1990–2005*.
Source [15]. *The graph includes all chicken imports into the region, but the change since 1997 reflects imports from the
United States.
0
100
200
300
400
500
600
700
1990 1991 1992 1993 1994 1995 1996 1997 1998 1999 2000 2001 2002 2003 2004 2005
Production quantity (1000 tonnes) | Chicken meat +
Food consumption quantity (1000 tonnes) | Chicken meat +
Im port of Raw&Processed in Primary Eq. + Food Aid (1000 tonnes) | Chicken meat +
Globalization and Health 2009, 5:5 />Page 9 of 15
(page number not for citation purposes)
it is likely that all frozen French fries are imported, since
domestic producers do not grow the specific type of
potato required by the industry [43]. Thus imports are
100% responsible for availability. Sales of frozen French
fries are largely to fast food outlets, restaurants and hotels.
In Costa Rica, 75% of all frozen French fries enter this
market, with the remaining 25% being sold by supermar-
kets [43]. In Guatemala, sales from supermarkets are
apparently negligible, so it is likely that all imports are
sold by the food service industry [37,44].
Tariffs on frozen French fries are not particularly high for
four of the countries -15% – but it is notable that the
country with the lowest amount of imports, Costa Rica,
has a tariff of 41%. While imports into Costa Rica rose
during the 1990s, fuelled by demand from fast food res-
taurants and the tourism industry, in the 2000s, imports
from Canada grew rapidly to the detriment of other
importers (Table 3). This was the direct result of policies
arising from the Canadian-Costa Rica trade agreement,
implemented in 2003. In the agreement, Costa Rica
implemented a TRQ with a zero in-quota tariff for imports
of Canadian French fries, with the 41% out-of-quota tariff
phased out over eight years.
No information could be obtained about trade policies
specific to frozen French fries for the other countries. It is
likely that increased imports stems from increased
demand from the spread of the fast food industry in the
region and the lack of a punitive tariff [45].
Snacks
Snacks are defined by the USDA FAS data system as choc-
olate confectionary, sugar confectionary, chewing gum,
cookies and pastries (sweet snacks) and popcorn, potato
chips and other chips (savoury snacks). Imports of all
snacks into Central America – as well as intra-regional
trade – increased during the 1990s (Figure 9).
Specifically, imports of chocolate, candy, cookies and pas-
tries and popcorn from the United States into Central
America grew in the early 1990s, and of potato and other
chips in the late 1990s (Figure 10). As of 2006, the largest
snack categories imported by weight were confectionary
(chewing gum, sugar-based candy and chocolate) and
popcorn.
There are no data on total availability of snacks in the
countries, but expenditure data in two of the largest
Production, imports, consumption of corn (yellow and white) in Central America, 1990–2005Figure 6
Production, imports, consumption of corn (yellow and white) in Central America, 1990–2005. Source [15].
0,00
5 000,00
10 000,00
15 000,00
20 000,00
25 000,00
30 000,00
1990 1991 1992 1993 1994 1995 1996 1997 1998 1999 2000 2001 2002 2003 2004 2005
Year
Maize production, imports and consumption, 1000 tonnes
Production quantity (1000 tonnes)
Import of Raw&Processed in Primary Eq. + Food Aid
(1000 tonnes)
Food consumption quantity (1000 tonnes)
Feed and seed Quantity (1000 tonnes)
Globalization and Health 2009, 5:5 />Page 10 of 15
(page number not for citation purposes)
importing countries, Costa Rica and Guatemala, suggests
that consumption is rising. In these two countries, sales of
chips, popcorn, chocolate, confectionary and cookies all
show a markedly increasing trend [37,44].
Tariffs on snacks into Central America are not notably
high – all are under 20% with the exception of potato
chips into Costa Rica, which faced a 41% tariff in 2003
[38]. Specific trade policy changes affecting snacks could
not be identified from the available literature but trade
barriers were reduced across the board in many Central
American countries during the 1990s [46]. In addition,
the growth of large supermarkets in the region – itself
encouraged through the liberalization of investment pol-
icies – is likely to have increased the incentives for manu-
facturers to export into the region, particularly for
commodities with low trade barriers [47-49]. Many of
these supermarkets have established relationships with
American processed food suppliers, and because of their
size, capital base, economies of scale in storage and distri-
bution and technological advancements in supply logis-
tics, are able to make available a far wider range of snack
foods relative to small stores [4].
It is also noteworthy that during the 1990s, the growth in
processed food sales by US affiliates in Guatemala and
Costa Rica significantly outstripped growth in sales of US
exports [50]. Indeed, much of the market for chips in Gua-
temala is dominated by U.S. companies which have
invested in the region. In 2005, PepsiCo had a 60% share
of the market for sweet and savoury snacks [44]. US com-
panies (Kraft, Mars, Hershey) also dominate the market
for chocolate confectionary in both Costa Rica and Guate-
mala [37,44] This suggests that much of the market for
snack foods from the United States is the result of foreign
direct investment (FDI) into Central America by the food
industry, rather than direct exports. American companies
do, however, face significant domestic competition from
leading snack food companies like Diana in El Salvador
and Señorial in Guatemala. In cookies, for example, local
Imports of apples and grapes into Central America, 1990–2005*Figure 7
Imports of apples and grapes into Central America, 1990–2005*. Source [15]. * This graph shows imports into Cen-
tral America from all countries, but imports are overwhelming dominated by the United States and Chile.
0
20
40
60
80
100
120
140
160
180
1990 1991 1992 1993 1994 1995 1996 1997 1998 1999 2000 2001 2002 2003 2004 2005
Year
Production, import, consumption, 1000 tonnes
Production quantity (1000 tonnes)
Im port of Raw&Processed in Primary Eq. +
Food Aid (1000 tonnes)
Food consumption quantity (1000 tonnes)
Globalization and Health 2009, 5:5 />Page 11 of 15
(page number not for citation purposes)
companies have a greater market share than the U.S
based Nabisco [44].
Discussion
Relationship between trade policy and food availability
Trade policy in Central American in the 1990s–2000s
affected food availability through three key avenues.
Firstly, the lowering of trade barriers is directly associated
with increased imports which then, in most cases, leads to
greater availability. Importers responded very quickly to
changes in trade policy – for example, the sharp rise in
imports of chicken cuts with reductions in tariffs, or the
response of Canadian French fry manufacturers to the
Costa Rican Free Trade Agreement – and are also able to
take advantage of import opportunities in commodities
with low barriers as market opportunities arise (e.g. whey
imports with increased domestic food processing). These
increased imports then, in most cases, are associated with
Imports of french fries (frozen) into the Central American countries from the United StatesFigure 8
Imports of french fries (frozen) into the Central American countries from the United States. Source [16].
0
1000
2000
3000
4000
5000
6000
1989 1990 1991 1992 1993 1994 1995 1996 1997 1998 1999 2000 2001 2002 2003 2004 2005 2006
Year
Imports (MT)
Costa Rica
El Salvador
Guatemala
Honduras
Nicaragua
Table 3: Export Volume of Frozen French Fries to Costa Rica
(2001–2005) (Metric Tons)
Country 2001 2002 2003 2004 2005
Canada 1,798 1,365 4,612 7,903 6,762
United States 2,156 2,039 456 324 866
Belgium 465 680 448 21 24
Netherlands 2.024 2,536 1,965 268 22
Others 28 211 60 0 159
Total 6,470 6,831 7,540 8,516 7,833
HS Code: 2041000
Source: [43]
Globalization and Health 2009, 5:5 />Page 12 of 15
(page number not for citation purposes)
increased availability of the food product. This is the case
for both foods produced in large or small amounts in the
importing region. For example, liberalization of trade pol-
icies in Central America contributed to the increased avail-
ability of rice, animal feed and fresh apples. Secondly, in
the case of meat, trade liberalization affected food availa-
bility through its effects on domestic production. Lower
barriers for yellow corn imports stimulated domestic
chicken production, and may also have had implications
for local corn farmers, given that US corn production is
subsidized [51]. Thirdly, reductions in barriers to invest-
ment appear to be critical in expansion of processed food
markets. Rising FDI has been a major driver of changes in
availability of highly-processed foods and their ingredi-
ents (processed cheese, whey, French fries, snacks), so the
relationship between availability and specific changes in
tariff and nontariff barriers is less clear than that for agri-
cultural commodities. This suggests the need for further
work investigating changes in FDI in conjunction with
trade liberalization.
Another key attribute of the impact of trade policy change
on food availability highlighted by the analysis in this
paper is that this is a two way relationship. While the food
industry responds (often rapidly) to policy changes, it also
shapes policy. In Central America, lobbying by producers
and manufacturers affected the specifics of trade policy
liberalization in relation to food. For example, lobbying
by rice millers for reductions to import barriers for rough
rather than milled rice, or chicken producers in relation to
yellow corn.
This descriptive analysis has shown that the foods most
affected by trade liberalization are those traditionally sub-
ject to high levels of protection. As the World Bank
[10,15] has observed, these are both high value foods –
such as poultry meat (both imports and domestic produc-
tion), dairy, temperate fruits (apples and grapes), French
fries and processed snack foods – and culturally signifi-
cant foods, such as corn and rice. Many of these foods are
also associated with the nutrition transition. As availabil-
ity of animal products and processed foods has increased,
this has been reflected in nutrition surveys indicating ris-
ing consumption of such 'transitional' foods [11,52,34].
Thus, the analysis suggests that food availability change
associated with trade liberalization, in conjunction with
social and demographic changes, has helped to facilitate
dietary change in Central American countries towards
increased consumption of meat, dairy products, processed
foods and temperate (imported) fruits. It is also highly
probably that there have also been decreases in the pur-
chase price of these foods due to increased competition
Pastry, biscuit and confectionary imports into Central America, 1990–2004Figure 9
Pastry, biscuit and confectionary imports into Central America, 1990–2004. Source [14].
0
10,000
20,000
30,000
40,000
50,000
60,000
70,000
80,000
90,000
100,000
1990 1991 1992 1993 1994 1995 1996 1997 1998 1999 2000 2001 2002 2003 2004
Year
Quantity (MT)
Pastry, cake & biscuit imports into CAFTA countries
Sugar confectionary imports into CAFTA countries
Chocolate and other cocoa products imports into CAFTA countries
Globalization and Health 2009, 5:5 />Page 13 of 15
(page number not for citation purposes)
and economies of scale for producers and importers. Such
dietary patterns have been associated with the nutrition
transition and the growing burden of obesity and non-
communicable disease reported in the region [53,54]. As
such, addressing upstream drivers such as trade policy
could form an essential part of strategies to improve pop-
ulation nutrition. Understanding the pathways through
which trade policy has facilitated changes in food availa-
bility can help policy makers identify points of impact for
potential interventions.
Methods
This study has utilized a descriptive methodology for ana-
lyzing the relationship between trade policy and food
availability. The strength of this method is the analysis of
the relationship over time, using descriptive time series
analysis of a variety of complimentary data sources, to
identify responses to policy change. The weakness of the
method is the inability to infer causality due to the
descriptive nature of the analysis, or to estimate the rela-
tive importance of trade liberalization policies in driving
change relative to other supply side drivers, such as tech-
nology, or demand side drivers, such as rising incomes.
However, given the complexity of the interaction, the
study was able to provide an initial level of evidence for
the effect of trade policy on basic indicators of change in
the food environment, and also to develop understanding
of the pathways through which this impact occurs.
Through this, possible policy levers can be identified that
can be utilized in creating healthy trade policy.
Finally, while there are arguments for and against trade
liberalization, it is essential to consider differential effects
on the poor. Factors affecting income and distribution are
important in determining diet and health, and these fac-
tors are likely to be more significant for the poor in the
process of uneven dietary development [4,5].
Conclusion
This analysis suggests that trade liberalization is one factor
facilitating the nutrition transition, and indicates some of
the processes and pathways through which this can occur.
Snack imports from the United States into Central America, 1989–2006Figure 10
Snack imports from the United States into Central America, 1989–2006. Source [14].
0
1000
2000
3000
4000
5000
6000
7000
1989 1990 1991 1992 1993 1994 1995 1996 1997 1998 1999 2000 2001 2002 2003 2004 2005
Year
MT, imports
Chocolate
Confectionary
Cookies and pastries
Popcorn
Potato and other chips
Globalization and Health 2009, 5:5 />Page 14 of 15
(page number not for citation purposes)
In Central America, it appears to have directly influenced
the availability and price of meat and processed foods,
many of which are energy-dense and high in fats, sugars
and salt. Consumption of foods high in fat, salt and sugar,
as well as consumption of animal products, are associated
with increased rates of obesity and diet-related chronic
diseases – in particular, cardiovascular disease, cancer and
diabetes [1]. Trade liberalization therefore has direct
implications for these health concerns. Indeed, evidence
from Latin America already shows that the shift from tra-
ditional diets largely comprised of plant foods towards
diets high in animal products and processed foods is asso-
ciated with obesity and the shift of the burden of disease
towards cardiovascular disease and cancer [55-57]. Com-
pounding this health transition, in many developing
countries under and over-nutrition co-exist (sometimes
even within the same household) [58]. The costs of such
chronic diseases have been well documented, not only for
the healthcare system but also for individuals, families
and communities, as has the need for intervention at a
macro level [59].
As these foods become more readily available and increas-
ingly affordable – and social trends continue to favour
convenience and 'transitional' foods – the burden of diet-
related chronic disease will continue to grow. An analysis
of the implications of full implementation of CAFTA-DR
in Central America has shown that the trade agreement is
likely to further the nutrition transition by exacerbating
the trends in food availability observed in this study of
previous trade liberalization measures [60]. In particular,
iberalization of trade, investment and communications
associated with CAFTA-DR is likely to increase availability
and lower relative prices of meat and processed foods, and
through this may continue to facilitate the rising preva-
lence of obesity and chronic disease.
Efforts to mitigate the negative impacts of trade policy on
diets – including engagement and negotiation with trade
policy makers – must begin with an understanding of how
the processes of globalization have facilitated the nutri-
tion transition. This paper provides evidence for the path-
ways and processes through which trade liberalization
affects food availability and price, and thus equips public
health advocates to effect policy change.
Competing interests
The authors declare that they have no competing interests.
Authors' contributions
AMT participated in the study design, conducted the data
analysis and drafted the manuscript. CH conceived of the
study, and participated in its design and coordination and
helped to draft the manuscript. Both authors read and
approved the final manuscript.
Authors' informations
At the time of the study, CH was a research fellow and
AMT an intern at the International Food Policy Research
Institute. AMT is presently at the Menzies Centre for
Health Policy, University of Sydney School of Public
Health. CH is a Research Fellow at the School of Public
Health, University of Sao Paolo, Brazil.
Acknowledgements
The authors would like to acknowledge the advice provided by Hans
Jansen, Samuel Morely and Maximo Torrero during the research conducted
for this paper.
References
1. Popkin B: Global nutrition dynamics: the world is shifting rap-
idly toward a diet linked with noncommunicable diseases.
Am J Clin Nutr 2006, 84:289-298.
2. Popkin BM: The nutrition transition and its health implica-
tions in lower income countries. Public Health Nutr 1998,
1(1):5-21.
3. Nugent R: Food and agriculture policy: issues related to pre-
vention of noncommunicable diseases. Food Nutr Bull 2004,
25(2):200-207.
4. Hawkes C: Uneven dietary development: linking the policies
and processes of globalization with the nutrition transition,
obesity and diet-related chronic diseases. Global Health 2006,
2(1):.
5. Schmidhuber J, Shetty P: Nutrition transition, obesity and non-
communicable diseases: drivers, outlook and concerns. SCN
News 2005, 29:13-19.
6. Popkin BM: Technology, transport, globalization and the
nutrition transition. Food Policy 2006, 31(554):569.
7. Thow AM: Trade liberalisation and the nutrition transition:
mapping the pathways for public health nutritionists. Public
Health Nutr 2009 in press.
8. Hawkes C, Chopra M, Friel S, Lang T, Thow AM: Globalization, food
and nutrition transitions University of Ottawa: Institute of Population
Health, Globalization and Health Equity; 2007.
9. Blouin C, Chopra M, Hoeven R van der: Trade and health 3: trade
and the social determinants of health. Lancet 2009,
373(9662):502-507.
10. Jaramillo CF, Lederman D: DR-CAFTA: challenges and opportunities for
Central America World Bank: Washington DC; 2005.
11. Stein AD, Gregory CO, Hoddinott J, Martorell R, Ramakrishnan U,
Ramirez-Zea M: Physical activity level, dietary habits, and alco-
hol and tobacco use among young Guatemalan adults. Food
Nutr Bull 2005, 26(2 Supp 1):S78-S87.
12. Bermudez OI, Tucker KL: Trends in dietary patterns of Latin
American populations. Cad Saude Publica 2003, 19(Supp
1):S87-S99.
13. Torun B, Stein AD, Schroeder D, Grajeda R, Conlisk A, Rodriguez M,
Mendez H, Martorell R: Rural-to-urban migration and cardio-
vascular disease risk factors in young Guatemalan adults. Int
J Epidemiol 2002, 31:218-226.
14. FAO: FAOSTAT Core Production Data 2007 [ />569/default.aspx].
15. FAO: Food Balance Sheets (archive) 2007 [ />368/default.aspx#ancor].
16. FAO: Supply Utilization Accounts and Food Balance Sheets in the context
of a national statistical system .
17. US Department of Agriculture: Foreign Trade Statistics 2007.
18. FAO: FAOSTAT Detailed Trade Matrix 2007 [ />406/default.aspx].
19. FAO: FAOSTAT SUA Data 2007 [ />default.aspx].
20. USDA FAS (United States Department of Agriculture Foreign Agri-
cultural Service): Rice import policy update: AGR Number: HO5009
USDA FAS: Washington DC; 1995.
21. USDA FAS (United States Department of Agriculture Foreign Agri-
cultural Service): Rice export possibilities are enhanced USDA FAS:
Washington DC; 1995.
Publish with BioMed Central and every
scientist can read your work free of charge
"BioMed Central will be the most significant development for
disseminating the results of biomedical research in our lifetime."
Sir Paul Nurse, Cancer Research UK
Your research papers will be:
available free of charge to the entire biomedical community
peer reviewed and published immediately upon acceptance
cited in PubMed and archived on PubMed Central
yours — you keep the copyright
Submit your manuscript here:
/>BioMedcentral
Globalization and Health 2009, 5:5 />Page 15 of 15
(page number not for citation purposes)
22. USDA FAS (United States Department of Agriculture Foreign Agri-
cultural Service): Rice update USDA FAS: Washington DC; 1997.
23. Dyck J, Nelson K: World Meat Trade Shaped by Regional Pref-
erences & Reduced Barriers. Ag Outlook (USDA) 2000:7-10.
24. Tay K, Huete SM: Guatemala: poultry and products, production and con-
sumption United States Department of Agriculture Foreign Agricul-
tural Service: Washington DC; 2005.
25. WTO: Guatemala Trade Policy Review 2002.
26. Aguilar V, Drennan RT: Poultry, Annual Report United States Depart-
ment of Agriculture Foreign Agricultural Service; 1996.
27. Aguilar V, Gonzalez A, Heinen SE: Agricultural situation: Guatemala
United States Department of Agriculture Foreign Agricultural Service;
1997.
28. Tay K, Huete SM: Guatemala poultry and products, production and con-
sumption 2006 United States Department of Agriculture Foreign Agri-
cultural Service: Washington DC; 2006.
29. USDA FAS (United States Department of Agriculture Foreign Agri-
cultural Service): Guatemala Poultry and Products Tariff Reduction 2001
USDA FAS: Washington DC; 2001.
30. Gonzalez O, Heinen SE: Poultry annual report United States Depart-
ment of Agriculture Foreign Agricultural Service: Washington DC;
1998.
31. USDA FAS (United States Department of Agriculture Foreign Agri-
cultural Service): Honduras Poultry Annual Report 1999 USDA FAS:
Washington DC; 1999.
32. Ovalle D, Coolidge F: Honduras: poultry and products annual 2001
United States Department of Agriculture; 2006.
33. USDA FAS (United States Department of Agriculture Foreign Agri-
cultural Service): Yellow corn tariff lowered USDA FAS: Washington
DC; 1996.
34. Ovalle D, Coolidge F: Guatemala food and agricultural import regulations
and standards: tariff and quota changes in yellow corn, wheat and rice
imports United States Department of Agriculture Foreign Agricultural
Service: Washington DC; 2001.
35. USDA FAS (United States Department of Agriculture Foreign Agri-
cultural Service): Guatemala Poultry and Products Annual 2001: GAIN
Report #GT1020 2001.
36. Pettrie GA: Grain and feed: corn tariff reduction and no return to price
band United States Department of Agriculture Foreign Agricultural
Service; 1995.
37. Euromonitor: Costa Rica – Packaged Foods. Euromonitor 2007 [http://
www.euromonitor.com].
38. CAFTA Agreement: Annex 3.3 – Tariff Schedules 2004.
39. Coggin B: The Best Whey To Expand Exports. AgExporter 1998.
40. USDA FAS (United States Department of Agriculture Foreign Agri-
cultural Service): US Whey Exports 1999.
41. USDA FAS (United States Department of Agriculture Foreign Agri-
cultural Service): Fresh Deciduous Fruit USDA FAS: Washington DC;
1996.
42. USDA FAS (United States Department of Agriculture Foreign Agri-
cultural Service): Fresh Deciduous Fruit USDA FAS: Washington DC;
1997.
43. USDA FAS (United States Department of Agriculture Foreign Agri-
cultural Service): Costa Rica Market Development Reports: frozen foods
report USDA: Washington DC; 2007.
44. Euromonitor: Guatemala – Packaged Foods. Euromonitor 2007 [http://
www.euromonitor.com].
45. Montel JE: Frozen foods gain warm welcome in Guatemala
and El Salvador. AgExporter 1996.
46. Pettrie GA: CA tariff reductions should boost US agricultural exports
United States Department of Agriculture Foreign Agricultural Service;
1995.
47. Herrera M, Orellana D, Suazo H: Three Central American mar-
kets add up to opportunities for US food exporters. AgEx-
porter 2001.
48. Reardon T, Berdegué JA: The rapid rise of supermarkets in
Latin America: challenges and opportunities for develop-
ment. Dev Policy Rev 2002, 20(4):371-388.
49. Orellana D, Huete SM: Guatemala exporter guide, annual 2004 United
States Department of Agriculture Foreign Agricultural Service: Wash-
ington DC; 2004.
50. Mattson JW, Koo WW: U.S. processed food exports and foreign direct
investment in the Western hemisphere Center for Agricultural Policy
and Trade Studies: North Dakota; 2002.
51. Morley S: Trade liberalization under CAFTA: an analysis of the agreement
with special reference to agriculture and smallholders in Central America.
DSGD Discussion Paper No.33/MTID Discussion Paper No.95 Washing-
ton DC: International Food Policy Research Institute; 2006.
52. Marini A, Gragnolati M: Malnutrition and Poverty in Guatemala: World
Bank Policy Research Working Paper 2967 Washington DC: World
Bank; 2003.
53. Martorell R, Kettel Khan L, Hughes ML, Grummer-Strawn LM: Obes-
ity in Latin American women and children. J Nutr 1998,
128:1464-1473.
54. Lanas F, Avezum A, Bautista LE, Diaz R, Luna M, Islam S, Yusuf S,
INTERHEART Investigators in Latin America: Risk factors for
acute myocardial infarction in Latin America: the INTER-
HEART Latin American study. Circulation 2007, 115:1067-1074.
55. Albala C, Vio F, Kain J, Uauy R: The nutrition transition in Latin
America: the case of Chile. Nutr Rev 2001, 59(6):170-176.
56. Rivera JA, Barquera S, Campirano F, Campos I, Safdie M, Tovar V:
Epidemiological and nutritional transition in Mexico: rapid
increase of non-communicable chronic diseases and obesity.
Public Health Nutr 2002, 5(1A):113-122.
57. Kain J, Vio F, Albala C: Obesity trends and determinant forces
in Latin America. Cad Saúde Pública 2003, 19(Sup. 1):S77-S86.
58. Garrett JL, Ruel MT: Stunted child-overweight mother pairs:
Prevalence and association with economic development and
urbanization.
Food Nutr Bull 2005, 26(2):209-221.
59. WHO (World Health Organization): Preventing chronic disease: a vital
investment World Health Organization: Geneva; 2005.
60. Hawkes C, Thow AM: Implications of the Central America-
Dominican Republic-Free Trade Agreement for the nutri-
tion transition in Central America. Rev Panam Salud Publica
2008, 24(5):345-360.


![Tài liệu Báo cáo khoa học: The stereochemistry of benzo[a]pyrene-2¢-deoxyguanosine adducts affects DNA methylation by SssI and HhaI DNA methyltransferases pptx](https://media.store123doc.com/images/document/14/br/gc/medium_Y97X8XlBli.jpg)