báo cáo khoa học: " Intervening in global markets to improve access to HIV/AIDS treatment: an analysis of international policies and the dynamics of global antiretroviral medicines markets" potx
Bạn đang xem bản rút gọn của tài liệu. Xem và tải ngay bản đầy đủ của tài liệu tại đây (724.79 KB, 19 trang )
Waning et al. Globalization and Health 2010, 6:9
/>Open Access
RESEARCH
BioMed Central
© 2010 Waning et al; licensee BioMed Central Ltd. This is an Open Access article distributed under the terms of the Creative Commons
Attribution License ( which permits unrestricted use, distribution, and reproduction in
any medium, provided the original work is properly cited.
Research
Intervening in global markets to improve access to
HIV/AIDS treatment: an analysis of international
policies and the dynamics of global antiretroviral
medicines markets
Brenda Waning*
1,2
, Margaret Kyle
3,4,5
, Ellen Diedrichsen
1
, Lyne Soucy
6
, Jenny Hochstadt
7
, Till Bärnighausen
8,9
and
Suerie Moon
10
Abstract
Background: Universal access to antiretroviral therapy (ART) in low- and middle-income countries faces numerous
challenges: increasing numbers of people needing ART, new guidelines recommending more expensive antiretroviral
(ARV) medicines, limited financing, and few fixed-dose combination (FDC) products. Global initiatives aim to promote
efficient global ARV markets, yet little is known about market dynamics and the impact of global policy interventions.
Methods: We utilize several data sources, including 12,958 donor-funded, adult first-line ARV purchase transactions, to
describe the market from 2002-2008. We examine relationships between market trends and: World Health
Organization (WHO) HIV/AIDS treatment guidelines; WHO Prequalification Programme (WHO Prequal) and United
States (US) Food and Drug Administration (FDA) approvals; and procurement policies of the Global Fund to Fight AIDS,
Tuberculosis, and Malaria (GFATM), US President's Emergency Plan for AIDS Relief (PEPFAR) and UNITAID.
Results: WHO recommended 7, 4, 24, and 6 first-line regimens in 2002, 2003, 2006 and 2009 guidelines, respectively.
2009 guidelines replaced a stavudine-based regimen ($88/person/year) with more expensive zidovudine- ($154-260/
person/year) or tenofovir-based ($244-465/person/year) regimens. Purchase volumes for ARVs newly-recommended in
2006 (emtricitabine, tenofovir) increased >15-fold from 2006 to 2008. Twenty-four generic FDCs were quality-approved
for older regimens but only four for newer regimens. Generic FDCs were available to GFATM recipients in 2004 but to
PEPFAR recipients only after FDA approval in 2006. Price trends for single-component generic medicines mirrored
generic FDC prices. Two large-scale purchasers, PEPFAR and UNITAID, together accounted for 53%, 84%, and 77% of
market volume for abacavir, emtricitabine, and tenofovir, respectively, in 2008. PEPFAR and UNITAID purchases were
often split across two manufacturers.
Conclusions: Global initiatives facilitated the creation of fairly efficient markets for older ARVs, but markets for newer
ARVs are less competitive and slower to evolve. WHO guidelines shape demand, and their complexity may help or
hinder achievement of economies of scale in pharmaceutical manufacturing. Certification programs assure ARV quality
but can delay uptake of new formulations. Large-scale procurement policies may decrease the numbers of buyers and
sellers, rendering the market less competitive in the longer-term. Global policies must be developed with
consideration for their short- and long-term impact on market dynamics.
Background
Although much progress has been achieved in scaling-up
access to HIV/AIDS treatment in low and middle-income
countries, the 4 million people who had received antiret-
roviral therapy (ART) by the end of 2008 still represent
only a small fraction of the 22 million estimated to need
treatment by 2015 [1]. Donors provided $10 billion in
2007, but an estimated $50 billion will be required to
cover all HIV/AIDS program costs in 2015 [1]. At the
* Correspondence:
1
Department of Family Medicine, Boston University School of Medicine, One
Boston Medical Center Place, Dowling 5 South, Boston, MA 02118, USA
Full list of author information is available at the end of the article
Waning et al. Globalization and Health 2010, 6:9
/>Page 2 of 19
same time, new World Health Organization (WHO)
guidelines recommend not only using better, more
expensive medicine, but also starting ART earlier, imply-
ing immediate increases in the numbers of people eligible
for treatment [2]. As costs and needs escalate, however,
international organizations are facing serious financing
shortfalls. For example, in late 2008 the Global Fund to
Fight AIDS, Tuberculosis, and Malaria (GFATM) asked
principal recipients to decrease eighth-round budgets by
10% [3]. The fallout from the current world economic cri-
sis, meanwhile, is still uncertain. With this "perfect storm"
of converging dynamics, policy makers urgently need to
understand all factors affecting our ability to meet uni-
versal access goals. Market factors, in particular, add even
more complexities to the situation.
By intervening in global antiretroviral (ARV) markets
serving low- and middle-income countries, the GFATM
[4], the Clinton Health Access Initiative (CHAI) [5], the
US President's Emergency Plan for AIDS Relief (PEPFAR)
[6] and UNITAID [7], among other international organi-
zations, are working to narrow the gap between the fund-
ing available and the amounts necessary to achieve
universal access. Their interventions aim to provide safe,
acceptable and good quality diagnostics and medicines
for HIV/AIDS treatment and care, and to promote com-
petition among suppliers. The organizations, however,
currently confront daunting challenges and a very differ-
ent marketplace compared to ART scale-up conditions of
the past. Recently available data enable us to describe and
assess these changing conditions.
Of pressing concern is the shifting demand for antiret-
rovirals as countries adopt the newer, more expensive
first-line regimens recommended by WHO [2,8]. Some
key ARVs in newer regimens are widely patented, while
patents for older ARVs were largely absent in the coun-
tries that produced and exported them, namely India,
Brazil, and Thailand [9]. These and other developing
countries now must provide patent protection for more
recently-developed medicines as they implement the
World Trade Organization (WTO) Agreement on Trade
Related Aspects of Intellectual Property Rights [10]. Pat-
ent-related barriers for newer regimens result in a less
competitive and more fragmented generic market; they
also hamper development of improved formulations such
as fixed-dose combination (FDC) products, in which two
or more medicines are combined into a single tablet.
WHO strongly recommends the use of FDCs [8] because
of their numerous advantages over single component
medicines, most notably simplified prescribing,
improved patient adherence, reduced risk of resistance
and easier supply chain management [11-15]. Yet far
fewer FDCs are available for newer than for older first-
line regimens.
Quality assurance and procurement issues also factor
into the complex market equation. Initiatives such as the
WHO Prequalification Programme (WHO Prequal) [16]
and the tentative approval system of the United States
(US) Food and Drug Administration (FDA) [17,18] not
only ensure that ARVs procured with donor funds meet
international quality standards, but also influence the rate
and extent of ARV dispersion across low- and middle-
income countries. The establishment of large-scale pur-
chasers such as PEPFAR, UNITAID, and the Voluntary
Pooled Procurement program of the GFATM, which
relieves individual countries of their procurement
responsibilities, is rapidly consolidating the number of
buyers in the market.
Research to date on ARV markets has focused largely
on the evolution of ARV prices [19-23]. Other elements
of the "perfect storm" in particular the interconnected-
ness of decisions made by international organizations and
their relationships to ARV market dynamics have not
been well described. Yet understanding these relation-
ships is critical to support future policy making.
To further such understanding, this paper describes the
most salient supply- and demand-side characteristics of
the market for first-line, adult ARVs in low- and middle-
income countries and illustrates relationships between
market evolution and the policies of international organi-
zations. We examine ARV market trends in relation to
three areas of intervention: WHO HIV/AIDS treatment
guidelines; certification decisions of WHO Prequal and
FDA; and pooled procurement policies of GFATM, PEP-
FAR and UNITAID. Since these three factors play out in
markets simultaneously, we believe that examining them
in relation to one another will provide policy makers and
academicians with a more useful analysis than focusing
on any one of them in isolation.
Methods
Using several data sources, we created a dataset of market
intelligence information for ARVs that includes purchases
made with donor funds in low- and middle-income coun-
tries. Information on approvals of quality-assured FDC
ARVs was obtained from WHO Prequal [16] and the US
FDA [17,18] and added to an analytic dataset that con-
tains ARV product information (manufacturer, strength,
dosage form, and price when available) obtained from
MSF Untangling the Web of Price Reductions [24], CHAI
consortium ARV price lists [25], and various manufac-
turer and national drug regulatory authority websites.
All of this information was used to systematically vali-
date ARV products and prices for ARV purchase transac-
tions obtained from the WHO Global Price Reporting
Mechanism [26] and the GFATM Price Quality Report
[27] from 2002-2008, after merging and removal of dupli-
cates.
Waning et al. Globalization and Health 2010, 6:9
/>Page 3 of 19
In addition, we included information from the World
Bank on country income classifications [28], the Interna-
tional Monetary Fund on annual inflation [29], and WHO
on recommended first-line regimens in all editions of
WHO adult treatment guidelines for HIV/AIDS
[2,8,30,31]. We restricted our analytic dataset to solid
dosage forms (tablets, capsules) of adult ARVs used for
first-line treatment of HIV/AIDS, namely abacavir
(ABC), efavirenz (EFV), emtricitabine (FTC), lamivudine
(3TC), nevirapine (NVP), stavudine (d4T), tenofovir
(TDF), and zidovudine (ZDV). A detailed process of the
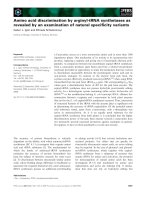
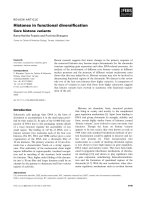
creation of the analytic data set is provided in Figure 1.
We adjusted all prices, provided by GFATM and WHO
in US Dollars, to the January-December 2008 time period
using the annual US Consumer Price Index [29]. We then
conducted a descriptive and comprehensive case study on
the global market for adult first-line ARVs in low- and
middle-income countries.
We present trends from 2002-2009 in the number of
first-line regimens recommended by WHO by showing
the main regimens that appear in key tables and figures of
WHO HIV/AIDS treatment guidelines [2,8,30-32]. We
do not include regimens recommended in specific situa-
tions as noted throughout the text and footnotes of
guidelines. For the purpose of this paper, "older" regimens
are defined as those recommended in 2003 WHO Guide-
lines and "newer" regimens are those in 2006 WHO
Guidelines.
Antiretroviral demand is estimated by volumes pur-
chased and presented in person-years whereby:
When estimating volume of ARVs purchased, we
include all products (FDCs, co-packaged products, and
individual medicines) that contain the ARV of interest in
calculating volumes purchased. For example, the total
volume purchased for tenofovir would include TDF, 3TC/
TDF, F TC/TDF, and EF V/F TC/TDF.
Antiretroviral prices are calculated using adult dosages
for persons weighing greater than sixty kilograms [8],
whereby:
Median prices plus 25
th
and 75
th
percentile prices are
provided for the most commonly used first-line ARV reg-
Annual volume in person-years total number of tablets p()(= uurchased per year daily dose days)/( ).× 365
ARV regimen price in US Dollars price tablet defined ()(/)(=×ddaily dose days)( ).× 365
Figure 1 Description of analytic data set.
Create
ARV Product
Intelligence
WHO
Prequal.
Manufacturers;
Procurement agencies;
Drug Regulatory
Authorities
FDA
MSF
WHO
GPRM
n=24,238
Merge ARV Product Intelligence, IMF, World Bank, WHO Treatment Guidelines
and ARV Transactional Data
Final analytic dataset of
ARV market intelligence
with 12,958 ARV transactions
823 invalid transactions removed (invalid product)
204 invalid transactions removed (invalid price)
5,661 2
nd
line ARV transactions removed
Combine PQR & GPRM
ARV Transactional Data
n=25,459
GFATM
PQR
n=1,221
CHAI
IMF and World BankWHO Treatment Guidelines
1,559 duplicate transactions removed
4,254 liquid transactions removed
Waning et al. Globalization and Health 2010, 6:9
/>Page 4 of 19
imens [33] and calculated using the least expensive ARVs
to create each regimen. For example, the stavudine (d4T)
30, lamivudine (3TC) 150, nevirapine (NVP) 200 regimen
price is based upon the price of the generic fixed-dose
combination product, whereas the tenofovir (TDF) 300,
emtricitabine (FTC) 200, NVP200 regimen is based upon
generic prices of TDF300/FTC200 fixed-dose product
and NVP200 tablet.
For three-in-one FDCs, we plot timelines of products
and manufacturers approved by the FDA approval, FDA
tentative approval, and WHO Prequalification systems
from 2000-2009 [16-18].
In depicting FDC market dynamics, for each year we
present the number of manufacturers reported in trans-
actional purchase data, the total number of manufactur-
ers who have been approved by either WHO Prequal or
US FDA to date, and the number of countries who pur-
chased the FDC.
We describe FDC products using a "/" between ARVs
included in a given FDC. We use a "+" to depict regimens
comprised of two or three distinct tablets. For example,
for the regimen of 3TC150, NVP200, and ZDV300, the
format 3TC150/NVP200/ZDV300 reflects the FDC ver-
sion, whereas 3TC150+NVP200+ZDV300 reflects three
individual tablets, and 3TC150/ZDV300 + NVP200
reflects a FDC plus an individual NVP200 tablet.
We present trends in market share by volume for the
most commonly used three-in-one FDCs by plotting the
annual volume (in person-years) bought by each pur-
chaser. The purchaser is defined as the organization pro-
viding funds to buy ARVs and includes four categories:
GFATM, PEPFAR, UNITAID and miscellaneous. The
PEPFAR purchases are actually purchases made by the
Supply Chain Management System (SCMS), a consor-
tium organization that purchases ARVs on behalf of PEP-
FAR. In our data sources, no PEPFAR purchases were
recorded outside of SCMS. The manufacturer split across
each purchaser is also depicted.
2008 market share is calculated across purchasers
according to both the value (in US Dollars) and the vol-
ume (in person-years) of ARVs purchased. Analyses of
2008 market share include all products (FDCs, co-pack-
aged medicines, and individual medicines) that contain
the ARV of interest.
Results
Relationships between WHO treatment guidelines and
demand
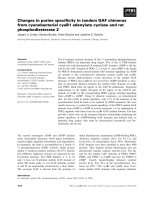
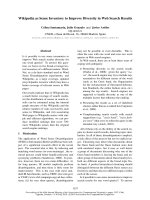
Figure 2 shows the composition of WHO treatment
guidelines from 2002-2009. The number of first-line regi-
mens and their components varied significantly, with cor-
responding swings in purchase volumes, as described
below in more detail.
The first WHO HIV/AIDS treatment guidelines for
adults and adolescents were released in 2002. They rec-
2008 percent market share for purchasers by value value i= (nn USD value in USD
purchaser total×
/ )*100
2008 percent market share for volume in person-years
purch
= (
aaser total
volume in person-years
purchasers by
×
/ )*100
volume
Figure 2 Trends in numbers of 1
st
line ARV regimens in WHO treatment guidelines.
24
25
e
s
Standard (16)
3TC+NVP+ZDV
EFV+3TC+ZDV
3TC+NVP+d4T
15
20
HO Guidelin
e
EFV+3TC+ZDV
3TC+NVP+ZDV
EFV+3TC+d4T
F T C +N V P +Z D V
EFV+FTC+ZDV
FTC+NVP+d4T
EFV+FTC+d4T
3TC+NVP+TDF
EFV+3TC+TDF
10
15
e
gimens in W
3TC+NVP+ZDV
A
BC+3TC+ZDV
IDV/r+3TC+ZDV
3TC+LPV/r+ZDV
3TC+SQV/r+ZDV
3TC+NFV+ZDV
3TC+NVP+d4T
EFV+3TC+d4T
EFV+3TC+TDF
F T C +N V P +T D F
EFV+FTC+TDF
A
B C +3 T C +N V P
A
B C +E F V +3 T C
A
B C +F T C +N V P
A
B C +E F V +F T C
7
4
6
5
#
First-line R
e
EFV+3TC+d4T
3TC+NVP+ZDV
EFV+3TC+ZDV
Alternative (8)
3TC+TDF+ZDV
A
B C +3 T C +Z D V
F T C +T D F +Z D V
A
B C +F T C +Z D V
3TC+d4T+TDF
ABC
+
3TC
+
d4T
EFV+3TC+ZDV
3TC+NVP+ZDV
EFV+3TC+TDF
EFV+FTC+TDF
3TC+NVP+TDF
0
2002 2003 2006 2009
#
AB C 3TC d4T
FTC+d4T+TDF
A
B C +F T C +d 4 T
F T C +N V P +T D F
Waning et al. Globalization and Health 2010, 6:9
/>Page 5 of 19
ommended seven regimens comprised of ten ARVs,
including the relatively costly protease inhibitors (Figure
2) [30]. One year later, WHO issued revised guidelines
that included only four key first-line regimens [31] com-
prised of five different ARVs, namely EFV, 3TC, NVP,
d4T and ZDV; these guidelines excluded protease inhibi-
tors altogether [31].
In 2006, WHO released a second revision of HIV/AIDS
treatment guidelines [8] with an increase to 24 recom-
mended first-line regimens (16 regimens characterized as
"standard" and eight characterized as "alternative") [8].
The revision offered much more flexibility in terms of
clinical options for prescribers. To the five ARVs in the
2003 guidelines, the 2006 revision added three more,
namely ABC, FTC, and TDF. The 2006 guidelines also
suggested that practitioners start planning to move away
from d4T-based regimens due to related toxicities [8]. In
May 2007, WHO issued an addendum recommendation
to dose d4T at 30 mg twice daily for all adults regardless
of weight, replacing the previous dosing of 40 mg twice
daily for patients weighing more than 60 kilograms [32].
The latest WHO revisions, announced in November
2009 and to be officially released in 2010 [2], recommend
only six key first-line regimens comprised of six ARVs for
treatment-naïve individuals [2]. Each of these regimens
contains ZDV or TDF plus 3TC or FTC plus EFV or NVP
[2]. The 2009 regimens do not introduce new ARVs or
regimens, but prioritize regimens listed in the 2006
guidelines. The newest guidelines no longer recommend
the use of d4T because of its side effects and toxicities.
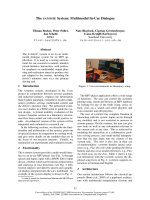
Examination of purchase trends for first-line ARVs
strongly suggests that the WHO guideline recommenda-
tions play an important role in driving ARV demand. The
five ARVs listed in the 2003 WHO treatment guidelines
accounted for more than 98% of ARVs purchased in 2004-
2006 (Figure 3). Shortly after the addition of TDF and
FTC to WHO first-line treatment guidelines in 2006,
TDF purchase volumes increased more than 15-fold,
from 16,000 person-years in 2006 to 240,000 person-
years in 2008, while FTC purchase volumes increased
more than 20-fold over the same period, with 162,000
person-years of purchase volume noted in 2008.
Similarly, purchase patterns appear to reflect 2006
WHO guidance away from d4T-containing regimens [8].
From 2006 to 2008, demand for d4T increased less than
two-fold from 515,000 person-years to 895,000 person-
years, while demand for ZDV (the lowest-cost substitute
for d4T) grew more than five-fold, from 139,000 person-
years to more 733,000 person-years over the same time
period.
Price implications of new WHO Guidelines
Prices for newer first-line regimens (those more recently
recommended by WHO) are considerably higher than
prices for older regimens. In 2008, the most commonly
used older regimen (3TC+NVP+d4T) was $88/person/
year in low-income countries. As countries adopt new
2009 WHO recommendations to phase out d4T use, they
are likely to instead use ZDV-based regimens priced 1.8-3
times higher at $154 (3TC/NVP/ZDV) and $260
(EFV+3TC/ZDV) or a TDF-based regimen
(TDF+3TC+NVP), priced 2.8 times higher at $244/per-
son/year in low income countries (Table 1).
Relationships between regulatory bodies and availability
of ARV FDCs across donor programs
WHO established WHO Prequal in 2001 to ensure that
medicines purchased with funds from United Nations
organizations met international quality standards [16]. In
most cases, principal recipients of GFATM funds are
required to purchase medicines pre-qualified by WHO
Prequal or strict regulatory authorities such as the US
FDA, the European Medicines Agency, or Health Canada.
The US FDA established the tentative approval system
in May 2004 to enable PEPFAR recipients to access
generic versions of products still under patent protection
or other forms of market exclusivity in the US and to
expedite approval of ARVs [17]. Antiretroviral medicines
purchased with PEPFAR funds must be approved by
either the standard or the tentative FDA approval process
[17].
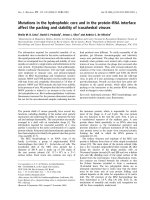
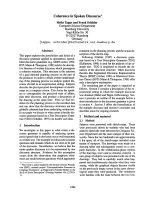
Figure 4 illustrates the timing of regulatory approval for
different WHO-recommended FDCs. By the end of 2009,
19 three-in-one FDCs had been approved through WHO
Prequal and 15 FDCs through the FDA tentative process.
The first generic FDC (3TC/NVP/d4t40) was prequali-
fied by WHO in 2003 (Figure 4), the same year WHO
released guidelines recommending use of the FDC as one
of four regimens. By 2006, six d4T-based FDCs and two
ZDV-based FDCs were WHO-prequalified. In contrast,
the FDA first approved a generic FDC (3TC/NVP/ZDV)
in mid-2006 (thereby allowing PEPFAR programs to pur-
chase them), approximately three years after the release
of 2003 WHO Guidelines. The FDA first approved d4T-
based FDCs in November 2006, approximately three
years after the first approval by WHO (Figure 4). In short,
the FDA approved FDCs for older regimens several years
after WHO, which was reflected in delayed market
demand from PEPFAR recipients for these products.
Quality-assured generic FDC ARVs used in newer regi-
mens are appearing at a much slower rate than that
observed with older regimens. While 24 generic FDCs
have been approved by either FDA or WHO to support
older regimens recommended in 2003, only four generic
FDCs have been approved to support new regimens rec-
ommended by WHO in 2006: two ABC-based FDCs no
longer prioritized on 2009 WHO guidelines, and two
TDF-based FDCs. Three of these were approved through
Waning et al. Globalization and Health 2010, 6:9
/>Page 6 of 19
the tentative FDA process and only one through WHO
Prequal.
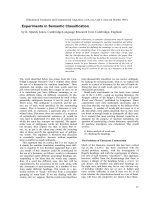
Relationships between prices of three-in-one FDC ARVs
and their component medicines
Prices for older ARV regimens have decreased dramati-
cally over the past seven years. For the 3TC, NVP, and
d4T30 regimen, the median price when purchasing three
generic, single-ingredient ARVs was $484/person/year in
2002 and decreased 82% by 2008 to $88/person/year
when purchasing the generic FDC (Figure 5a). The ZDV-
based regimen of 3TC, NVP, and ZDV exhibited the same
trends with the median price for three generic, single-
ingredient ARVs decreasing 71% from $564/person/year
for the three generic, single-ingredient ARVs in 2003 to
$161/person/year in 2008 for the generic FDC (Figure
5b).
All regimens, including those provided through single
ingredient medicines, copackaged medicines, and FDCs,
exhibit steep price reductions upon market entry of the
generic FDC. Price reductions of 60%, 66% and, 39% are
noted when the FDC version first appear compared to
prices for three single-ingredient ARVs in the previous
year for d4T-30, d4T-40, and ZDV-based regimens,
respectively (Figure 5a and Table 2).
Generic prices for the three single ingredients mirror
prices of FDCs after their launch. Whereas d4T-based
FDCs offer consistent price discounts compared to their
components, the ZDV-based FDC entered at a slightly
higher price than its components but by 2008 offered sav-
ings. Prices for single-ingredient, branded ARVs consis-
tently ranged from 2.4-9.5 times higher than prices for
generic FDCs for both d4T- and ZDV-based regimens.
For newer regimens recommended by WHO in 2006,
only two FDCs were purchased: ABC/3TC/ZDV and
EFV/FTC/TDF. No generic version of the ABC-based
FDC was purchased and prices for the branded FDC were
consistently higher compared to prices for the three
generic ARVs (Table 2). Similarly, the branded TDF-
based FDC with EFV offers no price savings over pur-
chasing three generic ARVs (Table 2). A generic EFV-
based FDC was first reported in 2008 and its price is sim-
ilar to the price of three generic ingredients.
Market dynamics for three-in-one FDC ARVs
The market dynamics of FDC versions of ARVs are indic-
ative of market efficiency over the past several years, at
least using typical measures of competition. First, there
has been a large increase in the number of manufacturers.
In addition, the number of purchasers and total volume
Figure 3 Consumption trends of WHO-recommended first-line ARVs (2002-2008).
New ARVs recommended by WHO in 2006: ABC, FTC, TDF
1,600,000
1,800,000
Y
ears)
1,200,000
1,400,000
1,600,000
e
d (Person-
Y
600 000
800,000
1,000,000
V
s Purchas
e
200,000
400,000
600
,
000
u
me of AR
V
0
2002 2003 2004 2005 2006 2007 2008
Vol
u
EFV
3TC
NVP
d4T
ZDV
ABC
FTC
TDF
EFV
3TC
NVP
d4T
ZDV
ABC
FTC
TDF
Waning et al. Globalization and Health 2010, 6:9
/>Page 7 of 19
purchased increased. A reduction in the market power of
suppliers has likely contributed to the reduction in price,
while at the same time the increases in demand have
attracted new entry by generics producers.
For the 3TC/NVP/d4T30 FDC, the number of manu-
facturers approved by WHO or FDA increased from one
to six from 2004 to 2008, while the number of manufac-
turers who sold this FDC to recipient countries increased
from four to seven over the same time period (Figure 6a).
By 2008, 55 countries were purchasing this FDC. An
increase in purchase volume makes entry more attractive
to new suppliers and may also facilitate economies of
scale in production. Purchase volume rose dramatically
from 2004 to 2008, from 89,221 to 623,336 person-years.
Notable increases in purchase volume occurred for this
FDC following the first FDA approval in December 2006.
More striking, though, is the immediate reaction to the
WHO recommendation to reduce d4T dosing from 40
mg to 30 mg in May 2007. Purchase volumes for the 40
mg d4T-based FDC immediately dropped off (Table 3),
while purchase volumes for the 30 mg d4T-based FDC
sharply increased (Figure 6a). As purchase volumes
increased for 3TC/NVP/d4T30 FDC, the global median
price decreased from $166/person/year in 2004 to $88/
person/year in 2008.
Market dynamics around the 3TC/NVP/ZDV FDC are
similar. From 2004 to 2008, the number of manufacturers
approved by WHO or FDA increased from zero to six,
while the number of manufacturers who sold the medi-
cine to recipient countries increased from two to six (Fig-
ure 6b). Similar purchase volume increases were noted
for the ZDV-based FDC which is often used in place of
d4T (Figure 6b) immediately after the 2007 WHO guid-
ance to reduce d4T dosing.
Market dynamics for 3TC/NVP/d4T40 were similar to
those already described except for dramatic decreases in
purchase volume noted after WHO issued guidance rec-
ommending lower doses of d4t. While purchase volumes
had grown to more than 100,000 person-years in 2007,
they decreased to fewer than 15,000 person-years in 2008
(Table 3).
Analysis of FDC market dynamics for newer regimens
reveals relatively low purchase volumes and higher prices
as compared to FDCs used in older regimens. While the
Table 1: 2008 Prices for most-commonly used first-line ARV regimens
Median (25th, 75th percentile) Regimen Prices* in USD
Low
Income
Lower-Middle
Income
Upper-Middle
Income
Old First-Line Regimens
from 2003 WHO Guidelines:
3TC/NVP/d4T30 88 (83, 90) 87 (80, 151) 110 (84, 222)
EFV+3TC/d4T30 198 (183, 223) 147 (52, 253) 211 (172, 235)
3TC/NVP/ZDV** 154 (144, 162) 172 (154, 259) 161 (161, 189)
EFV+3TC/ZDV** 260 (246, 286) 216 (118, 298) 326 (260, 370)
New First-Line Regimens
from 2006, 2009 WHO
Guidelines:
3TC+NVP+TDF** 244 (226, 278) 256 (244, 288) 387 (311, 591)
EFV+3TC+TDF** 349 (321, 399) 301 (207, 392) 477 (404, 527)
FTC/TDF+NVP** 361 (325, 366) 399 (292, 427) 525 (368, 726)
EFV+FTC/TDF** 465 (419, 487) 443 (256, 531) 616 (461, 663)
ABC+3TC+NVP 398 (361, 450) 418 (392, 457) 491 (443, 705)
ABC+EFV+3TC 503 (455, 571) 463 (355, 561) 581 (536, 641)
ABC+FTC+NVP n/a
§
n/a
§
n/a
§
ABC+EFV+FTC n/a
§
n/a
§
n/a
§
*price/person/year calculated using the least expensive ARVs to create each regimen (see methods section)
**first-line regimens recommended in 2009 WHO guidelines
§
price data unavailable; less than 5 purchases for at least one ARV in regimen
Waning et al. Globalization and Health 2010, 6:9
/>Page 8 of 19
branded ABC/3TC/ZDV FDC was FDA-approved in
2000 (Figure 4), demand for this product has been low,
peaking at fewer than 500 person-years of volume in 2007
but dropping dramatically thereafter (Table 3). The
branded EFV/FTC/TDF was FDA-approved in 2006 (Fig-
ure 4), but demand for the FDC has only just started to
grow, reaching 3,720 person-years of volume in 2008.
Trends in FDC market share across purchasers and
manufacturers
Analysis of market share by both purchasers and the
manufacturers that supply them reflects the dominant
role large-scale buyers are beginning to play in the global
market. PEPFAR was the first large-scale purchaser and it
changed the market structure for first-line FDCs. The
first FDC version of 3TC/NVP/d4T30 was only approved
by the FDA tentative approval system in November 2006
(Figure 4), allowing PEPFAR to begin purchasing in 2007.
For 2004-2006, therefore, GFATM was the major pur-
chaser and the market was split across the various manu-
facturers chosen by the principal recipients of GFATM
funds. By 2008, however, PEPFAR, represented 40% of
the total market for this FDC, with purchases split across
only two manufacturers (Figure 7a).
The same general trends are observed with the FDC
version of 3TC/NVP/ZDV. By 2008, PEPFAR accounted
for 28% of market volume for this product, with pur-
chases split across three manufacturers, one of which
accounted for 94% of PEPFAR purchases (Figure 7b). In
contrast, the GFATM's disaggregated purchases for both
these FDCs are split across 4-5 different manufacturers.
Cross-section of 2008 market share by purchaser for all
ARVs containing first-line medicines
The impact of large-scale purchasing organizations on
market dynamics - both market value and market volume
is even more pronounced in analyses on all ARVs (sin-
gle-ingredient, co-packaged medicines, and FDCs) con-
taining first-line medicines.
For newer first line ARVs recommended by WHO
(ABC, FTC and TDF), PEPFAR accounts for 9%, 42%, and
33% of market value, respectively, while UNITAID
accounts for 35%, 38%, and 42%, respectively (Figure 8a).
Indeed, PEPFAR and UNITAID together account for 44%,
80% and 75% of the global market for ABC, FTC and
TDF, respectively, while the GFATM accounts for 41%,
8%, and 13% (Figure 8a).
Examination of purchaser market share by volume
reveals similar results. For older first- line ARVs (EFV,
3TC, NVP, d4T, and ZDV), PEPFAR accounts for 27-34%
of market by volume, while the GFATM accounts for 47-
57% (Figure 8b).
For the newer first line ARVs (ABC, FTC, and TDF),
PEPFAR accounts for 11%, 39%, and 28% of market vol-
Figure 4 Timeline of WHO Prequalification Programme and US FDA approvals of first-line fixed-dose combination ARVs.
FDA
GSK
®
Pharmacare
Gilead
®
Pharmacare
Matrix
FDA
Approved
Matrix
Matrix
Aurobindo
Emcure
Cipla
Cipla
Strides
Cipla
Strides
Strides
Matrix
Emcure
Matrix
FDA
Tentatively
Approved
WHO
Prequalified
Ranbaxy
Ranbaxy
Ranbaxy Matrix
Mti
Ranbaxy
Mti
0
0
0
1
0
2
0
3
0
4
0
5
0
6
0
7
0
8
0
9
Cipla
Actavis
Ranbaxy
Hetero
Cipla
Merck
®
Hetero
Hete ro
Apotex
Cipla
AurobindoActavisGSK
®
M
a
t
r
i
x
M
a
t
r
i
x
20
0
20
0
20
0
20
0
20
0
20
0
20
0
20
0
20
0
20
0
3TC/NVP/d4T30 3TC/NVP/d4T40 3TC/NVP/ZDV ABC/3 TC/ZDV EFV/FTC/TDF EFV/3TC/TDF
New regimens recommended by WHO in 2006
Waning et al. Globalization and Health 2010, 6:9
/>Page 9 of 19
Figure 5 Price trends for three-in-one FDCs and their component medicines. 5a. Price trends for 3TC, NVP, and d4T30. 5b. Price trends for 3TC,
NVP, and ZDV.
0
100
200
300
400
500
600
700
800
900
2002 2003 2004 2005 2006 2007 2008
Median Annual Price/Person (USD)
Generic 3TC+NVP+d4T30 Generic FDC 3TC/NVP/d4T30 Brand 3TC+NVP+d4T30
60% price
decrease
82% price decrease
5b
5a
0
100
200
300
400
500
600
700
800
900
2003 2004 2005 2006 2007 2008
Median Annual Price/ Person (USD)
Generic 3TC+NVP+ZDV Gener ic FDC 3TC/NVP/ZDV Brand 3TC+NVP+ZDV
71% price decrease
39% price
decrease
Waning et al. Globalization and Health 2010, 6:9
/>Page 10 of 19
Table 2: Price trends for first-line, three-in-one FDCs and their component ARVs
Median (25th, 75th percentile) Regimen Prices* in USD
2002 2003 2004 2005 2006 2007 2008
3TC, NVP,
d4T40
Generic
NVP+3TC+
d4T40
490
(486, 496)
418
(245, 489)
212
(184, 249)
209
(183, 255)
169
(150, 172)
114
(108, 130)
107
(97, 149)
Brand
NVP+3TC+
d4T40
640
(640, 648)
619
(619, 707)
618
(597, 746)
637
(370, 954)
897
(601, 1,219)
Generic
FDC
165* 180
(143, 193)
180
(163, 214)
112
(112, 129)
83
(83, 102)
104
(80, 151)
ABC, 3TC,
ZDV
Generic
ABC+3TC+
ZDV
1,083
(510, 1591)
1,101
(1,039,
1,212)
794
(744, 813)
568
(525, 626)
475
(436, 587)
Brand
ABC+3TC+
ZDV
1,669* 1,329
(1,329,
1,363)
1,286
(1,285,
1,387)
1,282
(978, 1,354)
984
(938, 991)
702
(681, 1,064)
Brand FDC 1,652* 1,483* 1,366
(1,366,
1,489)
1,363* 883
(883, 989)
EFV, FTC,
TDF
Generic EFV
+ FTC/TDF
516
(417, 536)
464
(441, 487)
Brand EFV +
FTC/TDF
781* 678
(636, 769)
593
(579, 624)
619
(573, 834)
Generic
FDC
485*
Brand FDC 712* 613*
*25
th
and 75
th
percentiles not calculated because n < 5 purchases
Waning et al. Globalization and Health 2010, 6:9
/>Page 11 of 19
Figure 6 Market dynamics for three-in-one FDCs*. * # of manufacturers refers to the number of manufacturers who sold ARVs to donor recipients
in a given year, as reported to either GFATM or WHO; this is NOT the total # of manufacturers in the market. 6a. Market dynamics for lamivudine/nev-
irapine/stavudine 30 FDC. 6b. Market dynamics for lamivudine/nevirapine/zidovudine 30 FDC.
7(6)
6(3)
4(3)
5(3)
4(1)
55
45
37
39
18
88
95
106
191
166
623,336
492,506
257,343
192,208
89,221
0
20
40
60
80
100
120
140
160
180
200
2004 2005 2006 2007 2008
Median Annual Price/Person (USD)
0
100,000
200,000
300,000
400,000
500,000
600,000
700,000
Volume in Person-Years
# Manufacturers (# WHO/FDA approved) # Countries
Median Annual Price/Person Volume in person-years
1
st
FDA Approval
WHO reduces d4T dose to 30mg
2(0)
1(0) 2(3)
3(4)
6(6)5
5
8
21
45
344
327
279
203
161
7,945
1,549
5,148
54,634
297,048
0
50
100
150
200
250
300
350
2004 2005 2006 2007 2008
Median Annual Price/Person (USD)
0
50,000
100,000
150,000
200,000
250,000
300,000
350,000
Volume in Person-Years
# Manufacturers (# WHO/FDA approved) # Countries
Median Annual Price/Person Volume in person-years
WHO reduces d4T dose to 30mg
6b
6a
Waning et al. Globalization and Health 2010, 6:9
/>Page 12 of 19
Table 3: Market dynamics for FDC versions of 3TC/NVP/d4T40, ABC/3TC/ZDV and EFV/FTC/TDF
2004 2005 2006 2007 2008
3TC/NVP/d4T40:
# Manufacturers *25343
# Approved
Manufacturers
(WHO & FDA)
13336
# Countries 21383221 7
Volume in person-years 55,758 126,005 114,178 103,690 14,810
Median annual price/
person, USD (generic)
180 180 112 83 104
ABC/3TC/ZDV:
# Manufacturers*32113
# Approved
Manufacturers
(WHO & FDA)
11112
# Countries 36232
Volume in person-years 61 250 106 479 129
Median annual price/
person, USD (brand)
1,483 1,366 1,363 883 3,257
EFV/FTC/TDF:
# Manufacturers* 13
# Approved
Manufacturers
(WHO & FDA)
122
# Countries 17
Volume in person-years 335 3,720
Median annual price/
person, USD (brand)
712 613
* # of manufacturers refers to the number of manufacturers who sold ARVs to donor recipients in a given year, as reported to either GFATM
or WHO; this is NOT the total # of manufacturers in the market
Waning et al. Globalization and Health 2010, 6:9
/>Page 13 of 19
ume, respectively, while UNITAID accounts for 42%,
45%, and 49%, respectively (Figure 8b). Again, PEPFAR
and UNITAID together account for 53%, 84% and 77% of
the global market for ABC, FTC, and TDF, respectively,
while the GFATM accounts for only 30%, 6%, and 12%,
respectively (Figure 8b). It is worth noting that many of
these ARVs can be used in both first- and second line reg-
imens and that the majority of UNITAID purchases are
likely used in second line treatment. Regardless of
whether these ARVs are used for first- or second line
treatment, PEPFAR and UNITAID clearly dominate the
market for these products.
Discussion
Relationships between interventions and markets
The data presented here strongly suggest that the policies
of donors and international organizations bear directly
on the evolution of antiretroviral medicines markets in
low- and middle-income countries. A number of high-
lights emerge in our analyses.
1. Remarkably efficient ARV markets evolved shortly after the
2002 establishment of the GFATM for the most commonly
used first-line ARVs
The entry of many manufacturers producing quality-
assured generic ARVs, dramatic price reductions, and the
development of innovative FDCs all indicate a largely
decentralized and efficient market by conventional mea-
sures. Purchase arrangements likely contributed to fierce
competition among producers of older ARVs, as GFATM
funding was distributed to more than 100 countries that
each made independent purchase decisions. Disaggre-
gated purchasing promoted competition for products and
geographic market niches among producers. The absence
of blocking patents in India, where most of the generic
ARVs are produced, and efforts by importing govern-
ments to overcome patent barriers also contributed to a
competitive, efficient global market for older ARVs.
2. The roles of WHO and the FDA have had mixed effects on
development and uptake of new ARV formulations
Quality Certification: WHO Prequal and the FDA main-
tained a level playing field by assuring that producers
were competing on ARVs of similar quality, and corrected
information asymmetries around quality for purchasers.
However, delays in quality certification can also create
delays in country uptake of products, as demonstrated by
the three-year wait to use PEPFAR funds for the most
commonly-used FDC (3TC/NVP/d4T). These programs
must perform at optimal efficiency to support the timely
maturation of global ARV markets.
Treatment Guidelines: WHO also exerted substantial
leverage in dictating demand for certain ARVs through its
HIV/AIDS treatment guidelines. The 2003 guidelines
consolidated demand around four first-line regimens,
which covered 94% of people on ART as of 2006; 80%
were on regimens available as generic FDCs [33]. Such
consolidation of demand created incentives for manufac-
turers to enter the generic ARV market and develop inno-
vative FDC products to support these regimens. In
contrast, WHO's 2006 guidelines listed more than 20
first-line regimens. This increase in treatment options,
among other factors, may have created disincentives for
manufacturers to develop FDCs of the newer regimens.
The 2009 WHO Guidelines have now come full circle,
reducing the number of recommended first-line regimens
to six, which may again facilitate the consolidation of
demand around a few ARVs and encourage manufactur-
ers to produce and develop FDCs of the newly recom-
mended regimens.
3. Newly recommended WHO ARVs are much more expensive
due to patent status and/or immature generic markets,
creating concern for countries' abilities to adopt new
guidelines
Generics markets for newer ARV regimens have not yet
matured, as demonstrated by high prices, low demand,
small numbers of manufacturers, and only a few three-in-
one FDCs. Of particular concern are regimens that
include newer ARVs such as tenofovir, which are priced at
least 3 times more than older regimens. In the absence of
measures to decrease drug prices and/or increase fund-
ing, countries may be forced to choose between treating
fewer people with newer and "better" regimens or treat-
ing more people with older and "less desirable" regimens.
To date, generic competition has been the only proven
method to promote sustained and substantial price
reduction. However, increasing implementation of the
TRIPS Agreement in developing countries means that
medicines patents are becoming more widespread and
severely restricting or eliminating generic competition
for newer ARVs.
Such patents could severely restrict or eliminate
generic competition. Least developed countries, however,
have a waiver from TRIPS obligations on pharmaceutical
patents and data protection until 2016.
Gilead has offered voluntary licenses to multiple firms
to produce tenofovir, which has enabled competition in
production. Many of these licenses include restrictions -
for example, regarding API sources and eligible export
markets [34]. It is too soon to evaluate any impacts of the-
ses restrictions.
For those ARVs which are widely patented, additional
interventions beyond voluntary licensing will be needed
to address intellectual property barriers in both import-
ing and exporting countries. TRIPS flexibilities such as
compulsory licensing, non-observation of pharmaceuti-
cal patents (allowed for least-developed country WTO
members until at least 2016), application of high stan-
dards of patentability in national law, and patent pools
will be needed to promote market efficiency, reduce
Figure 7 FDC Annal market trends by purchaser and manufacturer. 7a. Market trends for 3TC/NVP/d4T30 by purchaser and manufacturer. 7b.
Market trends for 3TC/NVP/ZDV by purchaser and manufacturer.
7a
7b
0
0.5
1
1. 5
2
2.5
Act avi s Phar ma, Ltd. Ajant a P harma, Lt d.
Ajanta Pharma, Ltd.
Aurobindo, Ltd.
Cipla, Ltd.
Emcure
Governmental
Pharmaceutical Org
Hetero Drugs, Ltd.
Matrix Laboratories
Ranbaxy, Ltd.
Strides Arcolab, Ltd.
0
100,000
200,000
300,000
400,000
500,000
600,000
700,000
2004 2005 2006 2007 2008
Market Share (in Person-Years)
MISC
PEPFAR
GFATM
12345
Apotex Inc.
Aurobindo, Ltd.
Cipla, Ltd.
Hetero Drugs, Ltd.
Matrix Laboratories
Ranbaxy, Ltd.
0
50,000
100,000
150,000
200,000
250,000
300,000
2004 2005 2006 2007 2008
Market Share (in Person-Years)
MISC
PEPFAR
GFATM
Waning et al. Globalization and Health 2010, 6:9
/>Page 15 of 19
Figure 8 2008 Market share across purchasers. 8a. 2008 Market share by value across purchasers. 8b. 2008 Market share by volume across purchas-
ers.
8a
8b
0% 20% 40% 60% 80% 100%
TDF
FTC
ABC
ZDV
d4T
NVP
3TC
EFV
2008 Market Share by Value
PEPFAR UNITAID Global Fund Misc.
New ARVs
recommended
by WHO in 2006
0% 20% 40% 60% 80% 100%
TDF
FTC
ABC
ZDV
d4T
NVP
3TC
EFV
2008 Market Share by Volume
PEPFAR UNITAID Global Fund Misc.
New ARVs
recommended
by WHO in 2006
Waning et al. Globalization and Health 2010, 6:9
/>Page 16 of 19
prices, and facilitate the use of new FDCs. Such measures
have been employed with success in a growing number of
countries, but still remain under-utilized relative to need
[9,34]. Particularly for essential medicines such as those
included in the WHO guidelines, governments, interna-
tional organizations and other relevant actors should
ensure that patent barriers do not stand in the way of
widespread, equitable access.
4. Fixed-dose combinations may have been determinants of
market prices for their component ARVs
Generic three-in-one FDCs strongly recommended by
WHO were introduced in 2003 at prices much lower
than the sum of their generic ARV component prices the
previous year. It is possible that manufacturers priced
some FDCs aggressively to gain market share and, there-
fore, created new benchmarks for pricing the component
medicines (in addition to other factors such as volume,
economies of scale, and robust competition). If so, FDCs
may exert a positive influence on ARV markets, above
and beyond their public health or logistical advantages.
5. Large-scale purchasing initiatives, including pooled
procurement, have transformed some disaggregated markets
into consolidated markets comprised of a few key purchasers
and the manufacturers they choose to supply their ARVs
PEPFAR and UNITAID have increasingly used pooled
procurement, whereby Western third-party organiza-
tions purchase medicines on behalf of funding recipients,
pooling ARV volumes of several countries into larger,
fewer transactions. In 2008, UNITAID and PEPFAR
together accounted for 84% of the global market for FTC
and 77% for TDF (Figure 7). Meanwhile, both PEPFAR
and UNITAID have usually contracted with two or three
manufacturers and awarded the majority of their pur-
chases to one or two. The chosen manufacturers then
typically dominate the market. These procurement poli-
cies may discourage other producers from incurring the
costs to develop and produce quality-assured ARVs,
thereby decreasing the number of competitors in the
market.
The GFATM's Voluntary Pooled Procurement (VPP)
program will introduce yet another large-scale purchaser
that will further consolidate the number of buyers.
Whereas the original design of the GFATM placed medi-
cine procurement in the hands of national principal
recipients, VPP will encourage them to pool ARV vol-
umes through third-party procurement. To date, third-
party operators involved in VPP include the Supply Chain
Management System (SCMS), which conducts pooled
procurement for PEPFAR, and CHAI, which handles
pooled procurement for UNITAID. If these arrangements
persist, SCMS and CHAI will be purchasing on behalf of
all the major donors. In this case, the market will no lon-
ger be a disaggregated and heterogeneous "open" market
of more than one hundred national-level buyers, but
instead will be concentrated around a few large-scale pur-
chasers.
Pooled procurement is attractive to donor organiza-
tions and governments for a number of reasons. Some
organizations may have superior information about sup-
plier costs, the benefits of which (e.g. lower prices), can
be shared with others through pooling. Pooled procure-
ment may also reduce overall transaction costs, since
fewer transactions occur. If economies of scale are very
important at the transaction level, these are more likely to
be realized through a few very large transactions rather
than many small ones. Pooled procurement might be
especially attractive to governments of smaller countries
with minimal procurement capacity and limited powers
to negotiate with suppliers; it might also be viewed as a
solution in countries with documented corruption in
procurement.
In practice, however, these benefits may not be realized.
Pooled procurement requires the harmonization of regis-
tration, intellectual property policies, ARV selection, and
demand forecasting across countries and organizations,
which can entail substantial coordination costs. Other
transaction costs are associated with financial transfers
and currency fluctuations. In addition, because pooled
procurement is usually handled by staff in developed
countries, with higher salaries and overhead, administra-
tive costs may not be lower. Pooled procurement may also
lead to dependence by low- and middle-income countries
on outside parties, detracting from efforts to strengthen
country health systems and build capacity.
The ultimate goal of all these programs is to improve
public health. While impossible to determine from this
analysis, it is likely that the market approach that best
serves public health is a mixture of several different pro-
curement strategies as observed with earlier WHO-rec-
ommended 1
st
line ARVs. In this scenario, the large
purchasers such as PEPFAR could drive global prices
lower but there was still sufficient purchase power
remaining in Global Fund countries to facilitate competi-
tion among manufacturers who did not win the larger
PEPFAR contracts. A completely disaggregated market
may not yield the lowest possible prices while a com-
pletely pooled market will likely reduce the number of
producers in the long term.
6. For efficient ARV markets, short-term gains must be
balanced with long term goals
Global health initiatives are under considerable pressure
to document their impact and success. However, for orga-
nizations charged with intervening in markets, the indi-
cators for success are not necessarily clear. Examples of
short-term goals for market-based initiatives might
include ARV price reduction and the development of
improved formulations; however, reaching these goals is
Waning et al. Globalization and Health 2010, 6:9
/>Page 17 of 19
not necessarily synonymous with building efficient global
ARV markets.
In addition, a focus on short-term gains may prove det-
rimental to market evolution in the long run. The global
market is evolving towards greater concentration on the
demand side, with the emergence of a few large-scale
purchasers, who in turn are encouraging greater concen-
tration on the supply side, by granting tenders to only a
few dominant manufacturers. While the immediate effect
of lower ARV prices obtained through initiatives such as
pooled procurement is attractive, the long-term impact
on market efficiency remains a concern. Generally speak-
ing, markets with only a few buyers and suppliers are
characterized by both monopoly and monopsony power,
and generally function less efficiently. For example, man-
ufacturers may try to offset the discounts they offer large-
scale purchasers by increasing prices charged to countries
not included in these large-purchase schemes. Demand
outside of the large-purchase schemes may be too low to
sustain the existing manufacturers and may discourage
new ones. Markets dominated by a few manufacturers are
more vulnerable to price-fixing and collusion.
7. Conventional market analysis tools may be inadequate for
assessing markets and the effects of interventions on ARV
markets because these markets are complex and changing
rapidly
Systematically identifying market failures and assessing
market competition are themselves complex tasks. In
theory, perfectly competitive markets exhibit a sufficient
number of suppliers and purchasers with perfect infor-
mation on products; comparable product quality across
suppliers; and, freedom from barriers to market entry or
exit. In this theoretical scenario, resources are allocated
efficiently and competition between suppliers results in
lower costs [35]. In practice, however, there is no consen-
sus on definitions or characteristics of a well-functioning
market, even by the international community now com-
mitted to improving global markets as a means of
increasing access to treatment. As noted by the National
Academies' Committee on the Economics of Antimalarial
Drugs in 2004, "[t]here are no firm rules for judging 'good'
prices, or 'healthy' competition." [36].
In addition, standard tools to assess competitive mar-
kets are inappropriate in contexts where it is crucial to
have dynamic efficiency - i.e., to maintain incentives for
continued innovation, quality improvements and devel-
opment of new treatments. In the short run, perfect com-
petition between suppliers that results in prices close to
marginal cost creates static, not dynamic, efficiency; in
this case, no supplier expects to profit from additional
investment in research and development for new medi-
cines or formulations. Sustainable prices, on the other
hand, are those that exceed the marginal cost of produc-
tion, allowing suppliers to earn a return on research and
development investments and creating incentives for
additional innovation.
A truly efficient ARV market might, therefore, offer not
the lowest prices per se, but the lowest prices possible
while at the same time ensuring continued innovation of
quality products in optimum formulations. Price is unde-
niably an important factor in access, and lower prices
enable greater access for the same level of funding. How-
ever, a narrow focus on price alone may drive prices to
lowest acceptable levels for manufacturers and leave no
additional funds to invest in the development of pediatric
formulations, FDCs, heat-stable ARVs, and other formu-
lation improvements. Driving prices too low could also
create disincentives for manufacturers to enter or remain
in the market, especially smaller manufacturers who are
unable to shift costs across multiple product lines. Lastly,
a focus on price without consideration for supplier per-
formance (e.g., ability to provide the desired amount of
medicines in a timely manner, may result in lower prices
but increased stock-outs due to sub-par distribution ser-
vices. Similarly, effective quality assurance systems must
be in place in order for ARV markets to deliver the
desired health outcomes.
Limitations and areas for further research
This study provides a comprehensive overview of global
policies and ARV market trends suggesting certain causal
relationships, but our descriptive methods cannot ascer-
tain causality or pinpoint the impact of a given interven-
tion on the market.
We limit this paper to relationships between a few
global initiatives and market trends and do not incorpo-
rate the potential market impact of many other key play-
ers, including HIV/AIDS activists, civil society
organizations, national governments, foundations, and
other international organizations. In addition, our data
does not capture 100% of the market but rather include
only ARV procurements reported to GFATM and WHO,
the majority of which are funded by GFATM, PEPFAR,
and UNITAID. A few larger, middle-income countries -
notably Brazil, South Africa, and Thailand (accounting
for 26% of people on ART in the developing world [1]) -
purchase large amounts of ARVs with a mix of national
and international funds, and do not report their national
purchases to the GFATM or WHO. Based on publicly-
available information, we estimate that our data capture
27% of purchases from Brazil, South Africa, and Thailand
and therefore represent the vast majority of ARV pur-
chases in developing countries. Ideally we would incorpo-
rate national ARV purchase data to better understand the
important roles these countries play in shaping the global
ARV market. For example, some have suggested that Bra-
zil's purchase of active principle ingredients (APIs) and
domestic production of ARVs facilitated competition and
Waning et al. Globalization and Health 2010, 6:9
/>Page 18 of 19
price reduction for both APIs and ARVs in donor-funded
markets [9]. To understand these impacts more clearly,
we would need additional purchase data for both APIs
and ARVs in these key countries; we encourage national
governments to provide their purchase data to the WHO
Global Price Reporting Mechanism in order to enable
improved understanding of and policy interventions in
global ARV markets.
We furthermore recognize certain limitations with
regards to the quality and reliability of source data. The
ARV transactional data, in particular, required substan-
tive cleaning. While we believe we have done due dili-
gence by scrutinizing, systematically cleaning, and
validating every transaction, some reporting errors may
still exist.
In addition, we note the disappearance of historical
transactional data that had previously been posted by
WHO and GFATM. For this paper, we used 2002-2008
purchases downloaded from the WHO and GFATM on 1
June, 2009 and 1 September, 2009, respectively; but
observed that some historical transactions we were able
to download on earlier dates were not present in the
downloaded data we used for this paper. Similarly, we
noted differences in dates and ARVs listed on various
updates of FDA approval and WHO Prequal lists and use
information downloaded from these two organizations
on 3 January, 2010.
Due to the absence of comprehensive, reliable, publicly-
available data on patents and other intellectual property
barriers in many low- and middle-income countries, we
were unable to include this information in our analyses.
We recognize the importance of national policies and
registrations in market evolution, but had no access to
this information. We lacked access to market intelligence
for active principle ingredients, intermediates, and pro-
duction costs; we also have no information on the use of
wholesale procurement agencies. In the discussion sec-
tion we hypothesize about aggressive pricing and incen-
tives/disincentives for development of FDCs by
manufacturers, but we did not conduct interviews with
manufacturers to confirm our speculations.
Despite these limitations, our research provides valu-
able insight for those working to promote market effi-
ciency in order to increase access to ARVs. This paper
lays out the first logical steps toward better understand-
ing the many ways that initiatives of international organi-
zations affect ARV markets, and can be used to inform
basic monitoring and evaluation systems of those organi-
zations involved with market dynamics. Many organiza-
tions now routinely compile market intelligence data, but
it needs to be made publicly available in reliable, synchro-
nized and ready-to-use formats to support day-to-day
procurement, decision making, and evaluation of inter-
ventions.
Lastly, we note the need to follow this work with
research using predictive and econometric methods to
build a more solid evidence base for policy making. That
said, isolating the impact of a single intervention amidst
the ever-changing and crowded landscape of a global
market may not be possible and/or may require adapta-
tion or development of new research methods.
Finally, any gains in market efficiency and access to
ARVs must ultimately be linked to health outcomes to
ensure that the overarching public health goals are
achieved. This paper examines relationships between
global policies and market dynamics but additional
research is needed to better understand relationships
between these types of policies and health outcomes (e.g.,
resistance, treatment failure, progression to 2
nd
and 3
rd
line regimens).
Conclusion
Rapid scale-up in access to ART from 2003-2008 was
facilitated by global policies and initiatives that resulted
in a fairly efficient global marketplace for older ARVs.
However, due to a range of factors, markets for the newly
recommended ARVs have been slower to deliver the price
reductions and improved formulations seen in the past.
WHO Guidelines heavily shape demand, and their rela-
tive complexity may help or hinder the achievement of
economies of scale in pharmaceutical manufacturing.
Certification programs assure ARV quality but can also
delay uptake of new formulations. Donor procurement
policies, including pooled procurement, may alter ARV
market structure by reducing the number of buyers and
sellers, rendering the market less competitive in the lon-
ger-term and requiring careful monitoring. Improved
understanding of ARV markets is required in order to
ensure that interventions have their intended impact, i.e.
to provide quality-assured ARVs in acceptable formula-
tions at sustainable prices. Global consensus is needed on
the ultimate goals of market-based interventions to
ensure that short-term gains do not result in detrimental
long-term market effects. This will involve clarifying and
agreeing on definitions of market efficiency, indicators to
monitor market evolution, and methodologies to identify
market failures and assess market impacts of policy inter-
ventions.
Competing interests
BW, MK, TB, and SM serve as consultants for UNITAID.
Authors' contributions
BW designed and coordinated the study, participated in data cleaning and
data analysis, and was the lead author on this paper. ED, LS and SM contributed
to data analysis and writing of the manuscript. MK and TB contributed to the
writing of the manuscript and edited it for important content. JH conducted
data analysis and contributed to the writing of the manuscript. All authors read
and approved the final manuscript.
Waning et al. Globalization and Health 2010, 6:9
/>Page 19 of 19
Acknowledgements
This research was financed by the United Kingdom Department for Interna-
tional Development and UNITAID. Till Bärnighausen was supported by grant
1R01-HD058482-01 from the National Institute of Child Health and Human
Development. The authors thank Michael Borowitz, Philippe Duneton, Carlton
Evans, Lucy Honig, Richard Laing, Hubert GM Leufkens, Silke Seco-Grutz, Kate
Strong, and Saul Walker.
Author Details
1
Department of Family Medicine, Boston University School of Medicine, One
Boston Medical Center Place, Dowling 5 South, Boston, MA 02118, USA,
2
Utrecht University, Utrecht, Netherlands,
3
Toulouse School of Economics,
Toulouse, France,
4
National Bureau of Economics, Cambridge, MA, USA,
5
Centre for Economic Policy Research, London, UK,
6
Partners In Health, Boston,
MA USA,
7
Boston University School of Public Health, Data Coordinating Center,
Boston, MA, USA,
8
Harvard School of Public Health, Department of Global
Health and Population, Boston, MA 02115, USA,
9
University of KwaZulu-Natal,
Africa Centre for Health and Population Studies, Mtubatuba 3935, South Africa
and
10
Sustainability Science Program, Center for International Development,
Harvard Kennedy School of Government, Cambridge, MA 02138, USA
References
1. World Health Organization, UNAIDS, UNICEF: Towards universal access:
Scaling up priority HIV/AIDS interventions in the health sector.
Progress report 2009. Geneva: World Health Organization; 2009.
2. World Health Organization: Rapid advice: antiretroviral therapy for HIV
infection in adults and adolescents. Geneva: World Health Organization;
2009.
3. Paton W: Communication to all CCMs and PRs on 10% savings on round
8. Geneva: Global Fund to Fight AIDS, Tuberculosis and Malaria; 2008.
4. The Global Fund to Fight AIDS T, and Malaria: Ad Hoc Committees Terms
of Reference. Geneva 2009.
5. Clinton Foundation [ />6. Supply Chain Management System [ />7. UNITAID [ />8. World Health Organization: Antiretroviral therapy for HIV infection in
adults and adolescents in resource-limited settings: towards universal
access. Geneva 2006.
9. 't Hoen E: The Global Politics of Pharmaceutical Monopoly Power: Drug
Patents, Access, Innovation and the Application of the WTO Doha
Declaration on TRIPS and Public Health. Diemen: AMB Publishers; 2009.
10. World Trade Organization: The agreement on Trade Related Aspects of
Intellectual Property Rights (TRIPS). Annex 1C of the 1994 Marrakesh
Agreement Establishing the World Trade Organization. Geneva 1994.
11. Calmy A, Pinoges L, Szumilin E, Zachariah R, Ford N, Ferradini L: Generic
fixed-dose combination antiretroviral treatment in resource-poor
settings: multicentric observational cohort. AIDS 2006, 20:1163-1169.
1110.1097/1101.aids.0000226957.0000279847.d0000226956
12. Pinheiro EdS, Antunes OAC, Fortunak JMD: A survey of the syntheses of
active pharmaceutical ingredients for antiretroviral drug combinations
critical to access in emerging nations. Antiviral Research 2008,
79:143-165.
13. Connor J, Rafter N, Rodgers A: Do fixed-dose combination pills or unit-
use packaging improve adherence? A systematic review. Bull World
Health Organ 2004, 82:935-939.
14. Moulding T, Dutt AK, Reichman LB: Fixed-dose combinations of
antituberculous medications to prevent drug resistance. Annals of
Internal Medicine 1995, 122:951-954.
15. Laurent C, Kouanfack C, Koulla-Shiro S, Nkoué N, Bourgeois A, Calmy A,
Lactuock B, Nzeusseu V, Mougnutou R, Peytavin G: Effectiveness and
safety of a generic fixed-dose combination of nevirapine, stavudine,
and lamivudine in HIV-1-infected adults in Cameroon: open-label
multicentre trial. The Lancet 2004, 364:29-34.
16. WHO list of prequalified medicinal products [ />prequal/]
17. President's Emergency Plan for AIDS Relief: Approved and tentatively
approved antiretrovirals in association with the President's Emergency
Plan [ />FDABeyondOurBordersForeignOffices/AsiaandAfrica/ucm119231.htm]
18. Drugs @ FDA: FDA Approved drug products [http://
www.accessdata.fda.gov/scripts/cder/drugsatfda/index.cfm]
19. Chien CV: HIV/AIDS drugs for Sub-Saharan Africa: how do brand and
generic supply compare? PLoS ONE 2007, 2:e278.
20. Nunn AS, Fonseca EM, Bastos FI, Gruskin S, Salomon JA: Evolution of
antiretroviral drug costs in Brazil in the context of free and universal
access to AIDS treatment. PLoS Med 2007, 4:e305.
21. Waning B, Kaplan W, King A, Lawrence D, Leufkens H, Fox M: Global
strategies to reduce the price of antiretroviral medicines: evidence
from transactional databases. Bull World Health Organ 2009, 87:520-528.
22. Wirtz V, Forsythe S, Valencia-Mendoza A, Bautista-Arredondo S: Factors
influencing global antiretroviral procurement prices. BMC Public Health
2009, 9:S6.
23. Vasan A, Hoos D, Mukherjee J, Farmer P, Rosenfield A, Perriens J: The
pricing and procurement of antiretroviral drugs: an observational
study of data from the Global Fund. Bull World Health Organ 2006,
84:393-398.
24. Médecins sans Frontières: Untangling the web of antiretroviral price
reductions. 1-12 edition. Geneva: Médecins sans Frontières; 2001.
25. Clinton Foundation HIV/AIDS Initiative ARV price list [http://
www.clintonfoundation.org/files/chaiarvpricelistaugust2009english.pdf]
26. Global Price Reporting Mechanism [ />gprm/en/]
27. Price & Quality Reporting [ />Screens/PQRLogin.aspx?Lang=en-GB]
28. World Bank country classification [ />EXTERNAL/DATASTATISTICS/
0,,contentMDK:20420458~menuPK:64133156~pagePK:64133150~piPK:6
4133175~theSitePK:239419,00.html]
29. International Monetary Fund: World Economic Outlook Database.
Washington DC 2009.
30. World Health Organization: Scaling up antiretroviral therapy in
resource-limited settings: guidelines for a public health approach.
Geneva 2002.
31. World Health Organization: Scaling up antiretroviral therapy in
resource-limited settings: treatment guidelines for a public health
approach, 2003 revision. Geneva 2004.
32. World Health Organization: Addendum to 2006 WHO Guidelines on
Antiretroviral therapy for HIV infection in adults and adolescents.
Geneva 2007.
33. Renaud-Thery F, Nguimfack BD, Vitoria M, Lee E, Graaff P, Samb B, Perriens
J: Use of antiretroviral therapy in resource-limited countries in 2006:
distribution and uptake of first- and second-line regimens. AIDS 2007,
21:S89-S95. 10.1097/1001.aids.0000279711.0000254922.f0000279710
34. Ford N, Wilson D, Chaves GC, Lotrowska M, Kijtiwatchakul K: Sustaining
access to antiretroviral therapy in the less-developed world: lessons
from Brazil and Thailand. AIDS 2007, 21:S21-S29. 10.1097/
1001.aids.0000279703.0000278685.a0000279706
35. Samuelson P, Nordhaus W: Economics 19th edition. New York: McGraw-
Hill; 2009.
36. Saving Lives, Buying Time: Economics of Malaria Drugs in an Age of
Resistance. Edited by: Arrow KJ, B PC, Gelband H. Washington DC: The
National Academies Press; 2004.
doi: 10.1186/1744-8603-6-9
Cite this article as: Waning et al., Intervening in global markets to improve
access to HIV/AIDS treatment: an analysis of international policies and the
dynamics of global antiretroviral medicines markets Globalization and Health
2010, 6:9
Received: 21 February 2010 Accepted: 25 May 2010
Published: 25 May 2010
This article is available from: 2010 Waning et al; licensee BioMed Central Ltd. This is an Open Access article distributed under the terms of the Creative Commons Attribution License ( ), which permits unrestricted use, distribution, and reproduction in any medium, provided the original work is properly cited.Globalization and Health 2010, 6:9