báo cáo khoa học: "Healthy lifestyle behaviour among Ghanaian adults in the phase of a health policy change" pdf
Bạn đang xem bản rút gọn của tài liệu. Xem và tải ngay bản đầy đủ của tài liệu tại đây (240.33 KB, 9 trang )
RESEARCH Open Access
Healthy lifestyle behaviour among Ghanaian
adults in the phase of a health policy change
Henry A Tagoe and Fidelia AA Dake
*
Abstract
Background: Many countries have adopted health policies that are targeted at reducing the risk factors for
chronic non-communicable diseases. These policies promote a healthy population by encouraging peop le to
adopt healthy lifestyle behaviours. This paper examines healthy lifestyl e behaviour among Ghanaian adults by
comparing behaviours before and after the introduction of a national health policy. The paper also explores the
socio-economic and demographic factors associated with healthy lifestyle behaviour.
Method: Descriptive, bivariate and multivariate regression techniques were employed on two nationally
representative surveys (2003 World Health Survey (Ghana) and 2008 Ghana Demographic and Health Survey) to
arrive at the results.
Results: While the prevalence of some negative lifestyle behaviours like smoking has reduced others like alcohol
consumption has increased. Relatively fewer people adhered to consuming the recommended amount of fruit and
vegetable servings per day in 2008 compared to 2003. While more females (7.0%) exhibited healthier lifestyles,
more males (9.0%) exhibited risky lifestyle behaviours after the introduction of the policy.
Conclusion: The improvement in healthy lifestyle behaviours among female adult Ghanaians will help promote
healthy living and potentially lead to a reduction in the prevalence of obesity among Ghanaian women. The
increase in risky lifestyle behaviour among adult male Ghanaians even after the introduction of the health policy
could lead to an increase in the risk of non-communicab le diseases among men and the resultant burden of
disease on them and their families will push more people into poverty.
Background
The overall health of i ndividuals is impacted by lifestyle
behaviours including healthy diets, physical activity,
smoking and alcohol consumption. Unhealthy lifestyle
behaviours particularly poor dietary practices, physical
inactivity and smoking are major risk factors for condi-
tions like overweight, obesity and chronic non-commu-
nicable diseases [1-3]. Research in Ghana indicates that
the prevalence of obesity is increasing especially among
women [4]. The rising prevalence of obesity in Ghana is
worrying because epidemiological studies have consis-
tently shown an increased risk of morbidity, disability
and mortality with obesity [5]. Findings from a study
using data from a nationally representative sample sur-
vey (World Health Surve y 2003) c onducted in G hana
revealed that about 18% of the respondents had been
diagnosed with one or more chro nic non-communicable
disease(s) with 45% of them currently receiving treat-
ment (Tagoe, Household burden of chronic disease in
Ghana, Unpublished). Health reports show th at the pre-
valence of lifestyle diseases (chronic non-communicable
diseases) such as stroke, hypertension, type 2 diabetes,
and other cardiovascular diseases are on the increase
and are now among the top ten in-patient cause of
death in Ghana [6].
Urbanisation, globalisation and nutritional transition
are major drivers of unhealt hy lifestyle behaviours in
developing countries [7-9]. Rapid urbanisation and glo-
balisation is accompanied by behavioural change which
exposes many individuals to the risk of chronic non-
communicable diseases and mortality. Fast paced eco-
nomic transition has also resulted in reduced physical
activity levels, decreased hours of rest and increasing
levels of stress [8,9].
* Correspondence:
Regional Institute for Population Studies, University of Ghana, P.O. Box LG 96,
Legon, Accra, Ghana
Tagoe and Dake Globalization and Health 2011, 7:7
/>© 2011 Tagoe and Dake; li censee BioMed Central Ltd. This is an Open Access article distributed under the terms of the Creative
Commons Attribution License (http://creativecomm ons.org/licenses/by/2.0), which permits unrestricted use, distribution, and
reproduction in any medium, provided the original work is properly cited.
The progressive increase in the burden of chronic non-
communicable diseases has been attributed to several fac-
tors including longer average lifespan and r isky lifestyle
behaviours [10]. Tobacco use, physical inactivity and diets
high in saturated fat and salts constitute risk for conditions
such as cardiovascular diseases, high blood pressure and
elevated serum cholesterol levels [11-13]. While factors
such age, sex and genetic susceptibility are non-modifiable
many of the risks associated with chronic diseases are
modifiable. Such modifiable risks include behavioural fac-
tors (e.g. diet, physical inactivity, tobacco use, alcohol con-
sumption), medical conditions (e.g. dyslipidemia,
hypertension, overweight, hyperinsulinaemia) and societal
factors including include a complex mixture of interacting
socioeconomic, cultural and environmental factors [14,15].
Estimates by the World He alth Organisation suggest that
up to 80% of premature deaths from heart disease, stroke
and diabetes can be averted with known behavioural and
pharmaceutical interventions [16]. According to the
Archives of Internal Medicine (1997) [17], the prevention
of hypertension by means of dietary salt reduction and
weight loss over a short term has been successfully accom-
plished in clinical trials. It has also been identified that
diets high in fruits, vegetables and low-fat dairy products
are extremely effective in lowering blood pressure [18].
From the foregoing, it is evident that the increase in
the incidence and prevalence of non-communicable dis-
eases are linked to risky healthy lifestyle behaviours [19].
Thus populations that exhibit risky l ifestyle behaviours
are also at risk of having a double burden of disease and
poverty as is currently seen in developing also referred
to as the Global South. In an effort to curb this pattern
ofdiseaseandpovertymanycountriesintheGlobal
South have initiated and implemented health policies
and intervention programs to help improve the health
of their populations. Most of these interventions have,
however, not yielded the expected results due to imple-
mentation problems and non-adherence to recom-
mended healthy lifestyle behaviours.
The Ministry of Health (MOH) in Ghana as part of its
effort to reduce the incidence of preventable diseases
and to promote regenerative health in the country
adopted the concept of “Regenerative Healt h and Nutri-
tion (RHN)”. The main objective of the program is to
promote healthy lifestyles, dietary practices and mother
and child care practices that would help eliminate the
many diseases that impact on the health and well-being
of Ghanaians. The concept of regenerative health and
nutrition was adopted by the MOH from Dimona,
Israel, where a community of more than 3,000 African
Hebrews have lived for over 40 years without any
recorded deaths among the people during this peri od
[20]. Due to healthy lifestyle behaviours (including th e
adoption of vegan diets), the African Hebrews have been
able to eliminate hypertension, diabetes, cancer and
other chronic non-communicable diseases from their
community [21].
The program covers three main modules; (a) mother
and child care (b) healthy lifestyle and (c) regene rative
nutrition [22]. Key interventions under the program are
geared towards; healthy diet (increasing consumptio n of
fruits and vegetables, drinking more water, reducing the
intake of meat, salt and saturated oils/fats, reducing or
eliminating smoking and alcohol intake); exercise
(increasing daily physical activity including cardiovascu-
lar exercise); rest (adopting regular relaxation p ractices
to minimise physical and emotional stress) and environ-
mental sanitation (maintaining personal and environ-
mental cleanliness and advo cating for portable water
use). Under these interventions it is recommended that
individuals consume five servings each of fruits and
vegetables and also drink eight glasses of water a day.
Living in a clean environment is encouraged and smok-
ing and alcohol consumption are to be avoided.
The Ghana Regenerative Health and Nutrition Pro-
gram was adopted in 2005 and piloted in 200 6. The
initial pilot involved ten districts across seven adminis-
trative r egions. As part of the pilot program about 700
change agents and 5000 advocates were trained [23].
Change agents and advocates of the program are mem-
bers of the community who are trained in the principles
and practices of RHN and they in turn educate their
community members [22]. The program has trained
over 50,000 change agents and advocates throughout
the country over the four year period (2006 to 2010)
[24]. Mass communication through the use of both
print and electronic media serves as a means of reaching
the population with the messages of the program.
In this paper the authors compare the prevalence o f
unhealthy lifestyle behaviours among G hanaian adults
before and after the adoption of the regenerative health
and nutrition program with a focus on behaviours
including fruit and vegetable consumption, physical
activity, smoking and alcohol consumption. This paper
also assesses the trend and the s ocio-economic and
demographic determinants of healthy lifestyle beha-
viours among Ghanaian adults prior to and a fter the
introduction of this policy. The paper also highlights the
implication of unhealthy lifestyle behaviour on morbidity
and mortality in the country. The authors hope this
paper will generate a new research agenda and also
bring to bear the health challenges risky lifestyle beha-
viours pose to developing countries.
Methodology
Data
This paper combines data from two nationally represen-
tative population surveys conducted in Ghana - the
Tagoe and Dake Globalization and Health 2011, 7:7
/>Page 2 of 9
World Health Survey (WHS) conducted under the
WHO in 2003 and the Ghana Demographic and Health
Survey (GDHS ) conducted in 2008. The 2003 WHS tar-
geted the de facto population aged 18 years and older.
Households were selected using a random stratified
sampling procedure. One individual per household was
selected through a random selection procedure using
the Kish table method. There was a kno wn non-zero
selection probability for any individual included in the
study for the purpo ses of e xtra polatin g the da ta to the
whole population and the sampling strategy was without
replacement. A total of 5,662 households were sampled
out of which 4,121 were interviewed while in the case of
individuals, 4,005 were sampled and 3,873 were inter-
viewed. The 2008 GDHS, which is the fif th round in the
series collected demographic, socio-economic and health
information on men and women in their reproductive
ages (females; 15-49 years and males; 15-59 years) and
also on children under the age of five years. The sam-
pling technique for the 2008 GDHS involved a two-
stage stratified probability design. The first s tage
involved selecting clusters from an updated master sam-
pling frame constructed from the 2000 Ghana Popula-
tion and Housing Census. A total of 412 clusters were
selected using systematic sampling with probability pro-
portional to size. The second stage of selection involved
a systematic sampling of 30 of the ho useh olds listed i n
each cluster. Adult respondents in the 2008 GDHS
included 4,916 females and 4,568 males in their repro-
ductive ages. Both surveys collected information on
healthy lifestyle behaviours including physical activity,
fruit and vegetable consumption and also on smoking
and alcohol consumption.
Variables
Dependent variable
An index of healthy lifestyle behaviour computed based
on the health related behaviours was used as the depen-
dent variable. The components of the index were (i) phy-
sical activity, i.e. whether respondents engaged in any
vigorous physical activity that lasted more than 10 min-
utes and the number of days respondents engaged in
such activity in the last seven days preceding the survey.
(ii) Smoking - this was a multiple response variable
which was co mputed based on whether responden ts
engaged in at least one of the following: smoked or used
any other nicotine containing substance in the last seven
days preceding the survey. (iii) Alcohol consumption -
whether or not respondents consumed at least one stan-
dard measure (Standard measure of alcohol is a net alco-
hol content of between 8-13 g of ethanol [1 standard
bottle of regular beer(285 ml), 1 single measure of spirit
(30 ml), 1 medium size glass of wine (120 ml) and 1 mea-
sure of aperitif (60 ml)] (WHS 2002)) of alcoholic
beverage in the last seven days preceding the survey (iv)
Fruits and vegetabl es - the amount of fruit and vegetabl e
servings respondents consumed on average in a typical
day.
A factor anal ysis using t he principa l component
method was used to compute the index of healthy life-
style behaviour. For two of the healthy lifestyle beha-
viours considered (smoking and alcohol consumption), a
score of zero was assigned to a response indicating
negative behaviour. Example, if a respondent reported
smoking in the last seven days prece ding the survey,
zero wa s assigned if not one was assigned. In a similar
manner, zero was assigned if a respondent reported con-
suming alcohol in the last seven days and one was
assigned if no alcohol consumption was reported. The
amount of fruits and vegetables consumed was reported
as a count of the number of servings consumed while
vigorous physical activity was reported as the number of
days respondents engaged in vigorous physical activity
that lasted for at least 10 minutes in the last 7 days pre-
ceding the survey. In the multivariate model the index
was treated as a continuous linear variable. At the
bivariate stage of analysis, the dependent variable wa s
catego rized into three equal parts based on the distribu-
tion of the computed index. The lowest 33.33% was
categorised as “high risk” healthy lifestyle behaviour.
The second 33.33% was categorised as “moderate risk”
healthy lifestyle behaviour while the upper 33.33% was
categorised as “low ri sk” healthy l ifestyle behaviour. At
the univariate level, the individual healthy lifestyle beha-
viours were categorised based on the recommendations
for that behaviour. Amount of fruit and vegetable ser-
vings consumed per day on a typical day during the last
week preceding the survey were categorised into three;
none (0 servings), below the recommended amount (1-
4 s ervings) and recommended amount (5 or more ser-
vings ). Number of vigorous physical activity days during
the last 7 days preceding the survey was also categorised
into none (no vigorous physical activity in the last 7
days), 1-6 days and all 7 days of the week. With regards
to smoking and alcohol consumption the respondents
were grouped into the percentage that reported smoking
and the percentage that reported consuming alcohol.
Independent variables
The socio-economic and demographic characteristics of
the respondents were used as independent variables and
they included age, type of place of residence, marital sta-
tus, highest level of educational attainment, type of
occupation and household income quintile. There were
differences in the age brackets for the different surveys,
while the WHS focused on adults aged 18 years and
older, the DHS concentrated on adults in their repro-
ductive ages; females 15-49 years and males 15-59 years.
Tagoe and Dake Globalization and Health 2011, 7:7
/>Page 3 of 9
To address the differences in age brackets the intersec-
tion of age in both datasets w as used for the analysis,
thus limiting respondents to adults aged 18-49 years.
Also, all other measures of variables used were categor-
ized to allow for cross survey compar ison. Age had four
categories of 18-19, 20-29, 30-39 and 40-49 years.
Respondents were classified by sex; male or female and
by type of place of residence; rural or urban. With
regards to marital status respondents w ere classified as
never married, currently married/cohabiting or formerly
married. Based on thei r highest level of educational
attainment respondents were put into categories of
those with no formal education and those who had pri-
mary, secondary or higher than secondary level educa-
tion. Occupational categories included those not
working, professional workers including (technical, man-
agerial and clerical workers), those in the sales/service
and agriculture/fishery sec tors and those engaged in ele-
mentary work including plant/machine operators.
Methods of analysis
Statistical analysis carried out in this study employed
descriptive, bivariate and multivariate regression techni-
ques. Lifestyle behaviours, socio-economic and demo-
graphic characteristics of the respondents were explored
using descriptive statistics. Bivariate analysis was used to
assess the association between healthy lifestyle behaviour
and the socio-economic and demographic characteristics
of the respondents. To investigate the relationship
between the individual demographic and socio-economic
status variables (age, educational attainment, marital sta-
tus, occupation, type of place of residence, and house-
hold income quintile) and healthy lifestyl e behaviour we
used a multivariate linear regression technique.
Results
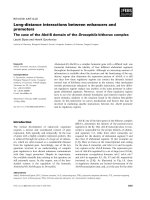
Prevalence of risky lifestyle behaviours
Fewer males and females reported smoking in 2008
compared to 2003. In contrast, more males and females
reported consuming alcohol in 2008 compared to 2003
(Table 1). The proportion of respondents who did not
consume a ny servings of fruits increased by at least 10
percentage points while the proportion that consumed 5
or more servings of fruits decreased substantially among
males and females alike. Similarly, the proportion of
respondents who reported consuming a minimum of
five servings of vegeta bles a day decreased by a t least 6
percentage points. About 9 in 10 of the respondents
reported consuming between 1 and 4 servings of vegeta-
bles before the introduction of the program and this
pattern remained the same after the introduction of the
program (Table 1). More than half of the female respon-
dents did not engage in any form of vigorous physical
activity before and after the introduction of the policy.
However, among males, the proportion that did not
engage in vigorous physical activity decreased by 8 per-
cent. There was a marginal increa se in the percentage of
respondents who engaged in vigorous physical activity
after the introduction of the program.
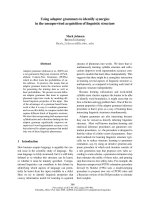
Healthy lifestyle behaviour
More females reported healthier lifestyles after the intro-
duction of the program whereas more males on the
other hand reported living riskier lifestyles after the
introduction of the program (Tables 2 and 3). More
females in rural areas reported living healthier lifestyles
after the program was introduced. Interestingly, there
was a 13 percentage point increase in the percentage of
rural m ale residents who exhibited risky lifestyle beha-
viours after the RHN program was introduced. Similarly,
while more urban females reported living low risk life-
styles in 2008 c ompared to 2003 more urban males
reported high risk lifestyles in 2008 compared to 2003.
The proporti on of females who reported living healthier
lifestyles after the introduction of the progr am increased
across all age groups. The situation was the reverse
among males, more males reported living riskier life-
styles now (2008) than before (2003) and this cut across
all age groups. More males with primary education
exhibited riskier lifestyles after the intro duction of the
program. The proportion of female professional workers
who exhibited low risk lifestyles after the introduction
of the program was about twice the proportion that
reported such lifestyles before the introduction of the
program (Tables 2 and 3). More females in all income
categories reported healthier lifestyles in 2008. However,
among males, the percentage that reported living heal-
thier lifesty les in 2008 decreased across all income cate-
gories except the richest (Table 3).
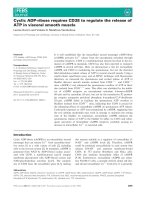
Socio-economic and demographic correlates of healthy
lifestyle behaviour
Controlling for the independent variables in a multivariate
regression model revealed that certain socio-economic
and demographic variables are associated with healthy life-
style behaviour (Table 4). Residing in an urban area was
generally associated with unhealthy lifestyle behaviour
though the relationship was observed to be non-significant
except among urban males in 2003. The results suggests
that education was associated with negative behaviours
before the introduction of RHN, however, in the era of the
health policy (i.e. in 2008), having formal education was
generally associate d with living healthy with the chances
of making healthy adjustments increasing with increasing
level of education. Among males the chances of living
healthy increased with increasing level of educational
attainment from primary through to higher level of educa-
tion whereas among females, secondary through higher
Tagoe and Dake Globalization and Health 2011, 7:7
/>Page 4 of 9
level educational attainment was associated with living a
healthier lifestyle. Females in all occupational categories
showed prospects of living healthy after the introduction
of RHN. Even though statistical significance was not
achieved, being a professional female worker was asso-
ciated with living unhealthy before the introduction of
RHN. However, after the introduction of RHN female pro-
fessional workers were significantlymorelikelytolive
healthier lifestyles. Being a male professional worker was
significantly associated with living unhealthy before the
introduction of RHN but after the introduction of the pro-
gram being a male professional worker was associated
with higher chances of living healthy even though this was
not statistically significant. Agricultural workers continued
to live healthy even though the chances of doing so
reduced after the introduction of RHN. Being a female in
the rich or richest income quintile was associated with a
higher chance of living less healthy before RHN was intro-
duced. Even t hough this relationship was not significant
before the introduction of RHN it persisted even after
RHN was introduced with the relationship showing statis-
tical significance. Being a female in the middle income
quintile was associated with living less healthy after RHN
but the opposite was the case before the introduction of
RHN. Being a male in the poor and middle quintiles was
associated with living healthy before and after the intro-
duction of RHN (Table 4).
Discussion
This paper examined the trend in healthy lifestyle beha-
viour among Ghanaian adults in the phase of the
“Regenerative Health and Nutrition” health policy. Our
findings reveal an increase in risky lifestyle behaviour
among males and a decrease in risky lifestyle behaviour
among females after the RHN program was introduced.
The results of this study also revealed that risky lifestyle
behaviours are more common in urban areas compared
to rural. This result buttresses the argument that urban
areas in developing countries are increasing becoming
unhealthy environments in terms of lifestyle behaviours
compared to rural a reas. This trend may be partly
responsibleforthehigherprevalenceofobesityand
non-communicable diseases in urban areas of develop-
ing countries as reported by the World Health Organi-
sation [25].
It was also found that prior to the intr oduction of the
program, in 2003, Ghanaian adults who had some level
of education were less likely to exhibit healthy lifestyle
behaviours. In 2008, after the introduction of the pro-
gram, a reversed trend between educational attainment
and healthy lifestyle behaviour was observed. Ghanaian
adults were more likely to live a healthier lifestyle with
increasing levels of educationa l attainment. The signifi-
cant decline in risky lifestyle behaviour among the
highly educated and among professional workers in
2008 after the introduction of the regenerative health
and nutrition health policy in Ghana brings to the fore
issues of access to regenerative health and nutrition
information and the financial ability to effect a lifestyle
behaviour change. The relatively high i ncome level of
professional workers give s them the opportunity to
access the appropriate nutrition in terms of fruits and
vegetables recommended under the program. Having
high education also means they are an audience who
Table 1 Prevalence of risky lifestyle behaviours among Ghanaian adults, 2003 and 2008
2003 2008
Lifestyle behaviour Females (%) Males (%) Females (%) Males (%)
Smoking
†
19 (1.3) 158 (12.4) 23 (0.5) 315 (9.0)
Alcohol
‡
205 (13.5) 338 (30.4) 661 (15.4) 1,147 (32.7)
Number of servings of fruit per day
None (0) 59 (3.9) 82 (6.4) 669 (15.5) 595 (17.0)
1-4 servings 1,052 (69.3) 810 (63.4) 3,516 (81.7) 2,875 (82.1)
5 or more servings 408 (26.9) 386 (30.2) 121 (2.8) 33 (0.9)
Number of serving of vegetable per day
None (0) 30 (2.0) 48 (3.8) 215 (5.0) 262 (7.5)
1-4 servings 1,373 (90.4) 1,122 (87.8) 4,028 (93.5) 3,211 (91.7)
5 or more servings 116 (7.6) 108 (8.5) 63 (1.5) 30 (0.9)
Vigorous physical activity (No. of days)
None 883 (58.2) 429 (33.6) 2,281 (53.0) 898 (25.6)
1-6 507 (33.4) 626 (49.0) 1,604 (37.3) 1,954 (55.8)
7 129 (8.5) 223 (17.4) 421 (9.8) 651 (18.6)
Total N 1,519 1,278 4,306 3,503
Source: Computed from the GWHS 2003 and GDHS 2008.
†
Respondents who reported smoking.
‡
Respondents who reported consuming alcohol.
Tagoe and Dake Globalization and Health 2011, 7:7
/>Page 5 of 9
can be reached with the messages o f the program and
thus they are more likely to change their behaviour.
Behaviour c hange among the highly educated and pro-
fessional workers does not end the re. It is also more
likely to be sustained since people of such calibre are
also able to integrate the changed behaviour into their
everyday lives and this is because they have the financial
means, the knowledge base and the autonomy to be
able to do so [26].
Improvement in the economic conditions of people is
an asset but can be a liability as well. As revealed by
this study, increasing i ncome levels is generally asso-
ciated with living risky lifestyles. This is especially so
because people tend to engage in luxurious lifestyles
including unhealthy snacking, consumption of high fat
diets and sedentary lifestyles as their economic condi-
tion improves. This is a common occurrence in develop-
ing countries because such luxurious lifestyles are
deemed prestigious and are also seen as a sign of wealth
[1]. Such li festyle behaviours, however, are unhealthy
and have implications for the incidence of non-commu-
nicable diseases and mortality in developing countries.
This study gives preliminary results and shows the
changes in lifestyle behaviours immediately before and
after the introduction of the regenerative health and
nutrition policy in Ghana. While this study makes impor-
tant contributions to this area of research the result s are
likely to be influenced by differences in survey design
Table 2 Percentage distribution of respondents by demographic and socio-economic characteristics and healthy
lifestyle behaviour (2003)
Socio-economic and demographic characteristics Healthy lifestyle behaviour
Females Males
High Moderate Low High Moderate Low
Type of place of residence *** ***
Urban 43.9 35.7 20.4 33.4 34.8 31.8
Rural 32.3 38.0 29.7 18.6 33.4 48.0
Age group
18-19 40.0 38.8 21.2 23.8 41.6 34.7
20-29 37.6 37.6 24.8 25.1 34.7 40.2
30-39 36.8 34.7 28.5 23.5 34.7 40.2
40-49 35.8 39.2 24.9 24.6 32.0 43.6
Marital status ** ***
Never married 46.2 32.1 21.7 30.0 35.4 34.6
Currently married/cohabiting 34.4 37.5 28.1 20.8 32.2 47.0
Formerly married 37.1 41.8 21.1 22.1 42.6 35.3
Highest level of educational attainment ***
No formal education 31.5 38.6 29.9 19.1 28.0 52.9
Primary 39.6 36.1 24.4 22.1 36.3 41.6
Secondary 41.5 36.8 21.7 38.5 33.6 28.0
Higher 34.8 43.5 21.7 44.8 27.6 27.6
Main occupation *** ***
Not working 44.0 37.7 18.3 29.2 38.6 32.2
Professional/managerial/clerical 53.0 31.6 15.4 46.3 32.9 20.8
Service and sales 41.0 37.0 22.0 30.7 39.2 30.2
Agricultural and fishery 25.7 39.2 35.1 13.6 31.1 55.3
Plant/machine operators and elementary work 47.1 31.8 21.0 30.4 30.4 39.1
Income quintile *** ***
Poorest 29.5 39.5 31.0 15.4 31.6 53.1
Poor 28.1 36.6 35.3 12.3 36.8 50.9
Middle 32.0 39.8 28.2 15.7 34.8 49.6
Rich 42.0 35.6 22.4 32.4 36.3 31.3
Richest 49.5 33.4 17.0 39.2 31.9 28.9
Total 37.0 37.1 25.9 24.3 34.0 41.7
High = Less healthy (more risky behaviours) Low = More healthy (less risky behaviours).
***P < 0.001 **P < 0.01 *P < 0.05 Total N (Females = 1519, Males = 1278).
Source: Generated from WHS-Ghana 2003.
Tagoe and Dake Globalization and Health 2011, 7:7
/>Page 6 of 9
since data from two comparable but different surveys
were used for the analysis. This notwithstanding, mea-
sures in both surveys are similar to each other and this
allows for cross survey comparison. To effectively eval u-
ate such a program it is important to continually monitor
the program. The authors thus recommend that future
rounds of the Ghana Demographic and Health Survey
continue to collect data on the program. This will allow
for continuous monitoring of the program while making
data available for tracking changes over time.
Conclusion
The findings of this study has implications for the health
and economic well being of Ghanaians and also for the
future of the regenerative health and nutrition program
in Ghana. The decreasing prevalence of risky lifestyle
behaviours among females will help promote healthy liv-
ing among females and potentially lead to a reduction in
the prevalence of obesity among females which would
counter the recent rise in obesity levels among Gha-
naian w omen. The increase in risky lifestyle behaviour
among males in spite of the regenerative health and
nutrition program could lead to an increased risk of
non-communicable diseases among males. This will not
only defeat th e objective of the program but also lead to
morbidity and mortality.
While efforts aimed at promoting healthy lifest yle
among females should be sustained more efforts need to
Table 3 Percentage distribution of respondents by demographic and socio-economic characteristics and healthy
lifestyle behaviour (2008)
Socio-demographic and economic characteristics Healthy lifestyle behaviour
Females Males
High Moderate Low High Moderate Low
Type of place of residence *** ***
Urban 38.4 34.1 27.6 35.7 36.0 28.3
Rural 30.1 32.7 37.2 31.5 30.6 37.9
Age group ** **
18-19 31.9 37.7 30.4 40.5 32.2 27.3
20-29 35.5 34.2 30.4 34.5 32.8 32.7
30-39 33.9 32.1 34.1 31.9 33.9 34.2
40-49 31.4 31.5 37.1 29.5 32.0 38.5
Marital status ** ***
Never married 33.8 37.5 28.7 37.1 32.1 30.9
Currently married/cohabiting 33.5 32.5 34.1 30.9 32.9 36.2
Formerly married 35.7 29.7 34.5 30.1 40.4 29.5
Highest level of educational attainment * *
No formal education 33.1 31.5 35.5 38.4 28.5 33.1
Primary 33.9 30.9 35.2 32.7 31.3 36.1
Secondary 34.1 35.0 30.9 31.9 33.9 34.2
Higher 33.7 37.6 28.7 33.0 37.9 29.1
Main occupation *** ***
Not working 40.7 37.6 21.7 40.7 31.3 28.0
Professional/managerial/clerical 29.3 40.4 30.2 33.4 38.1 28.5
Service and sales 35.0 34.3 30.8 32.1 42.7 25.2
Agricultural and fishery 27.4 29.3 43.2 30.4 28.5 41.1
Plant/machine operators and elementary work 38.3 30.2 31.4 34.2 22.9 31.9
Income quintile *** ***
Poorest 29.6 30.5 39.9 35.8 29.0 35.3
Poor 28.4 33.1 38.6 26.4 27.9 45.6
Middle 33.0 32.8 34.2 32.3 33.0 34.8
Rich 39.0 32.5 28.5 34.5 35.4 30.2
Richest 38.6 37.9 23.4 36.5 39.0 30.2
Total 33.8 33.3 32.9 33.3 32.9 33.8
High = Less healthy (more risky behaviours) Low = More healthy (less risky behaviours).
***P < 0.001 **P < 0.01 *P < 0.05 Total N (Females = 4,306, Males = 3,503).
Source: Generated from GDHS, 2008.
Tagoe and Dake Globalization and Health 2011, 7:7
/>Page 7 of 9
be channelled at men in getting them to live healthier
lifestyles. There is also the need to pay more attention
to urban areas. While is important to promote healthy
lifestyles in urban area s, there is also a need to target
barriers in the urban environment that does not support
the adoption of healthy lifestyles. These findings provide
the l everage for further assessment of the regenerative
health and nutrition health init iative on healthy lifestyle
behaviours and its influence on morbidity and mortality.
Additional research should attempt to explain the
changes in healthy lifestyle behaviour among men and
women in opposite directions. Exploring methods of tar-
geting messages o f healthy lifestyle behaviour choices
and ways of making such options financially possible
will foster the adoption of the regenerative health and
nutrition program in other countries in the Global
South.
Acknowledgements
This paper uses data collected by the World Health Organisation (World
Health Survey, 2003) and ICF Macro International and the Ghana Statistical
Service (Ghana Demographic and Health Survey, 2008). The authors wish to
thank the William and Flora Hewlett Foundation for grant support. We are
also grateful to Prof. Francis Dodoo and Prof. Melissa Hardy for their
mentorship.
Authors’ contributions
HAT developed the conceptual approach and performed the statistical
analysis. FAAD drafted and revised the manuscript. Both authors develope d
the study design and reviewed and approved the final manuscript.
Competing interests
The authors declare that they have no competing interests.
Table 4 Socio-economic and demographic correlates of healthy lifestyle behaviour among Ghanaian adults (2003 and
2008)
Socio-demographic variables 2003 B (Std. Error) 2008 B (Std. Error)
Females Males Females Males
Constant 1.489 (.374)*** 2.454 (.456)*** 1.827 (.076)*** 1.686 (.094)***
Type of place of residence
Rural
◙
Urban 136 (.178) 493 (.246)* 038 (.048) 025 (.056)
Age
18-19
◙
20-29 .251 (.363) .281 (.393) 052 (.067) .035 (.074)
30-39 .176 (.388) 112 (.448) .000 (.076) .023 (.090)
40-49 .206 (.404) 398 (.475) .043 (.080) .068 (.096)
Marital status
Never married
◙
Married/cohabiting 246 (.229) .784 (.275)** 069 (.053) .111 (.060)
Formerly married 489 (.295) .040 (.487) 059 (.075) 009 (.109)
Highest level of educational attainment
No formal education
◙
Primary education 088 (.167) 639 (.250)* .089 (.053) .318 (.074)***
Secondary education 063 (.322) 634 (.376) .188 (.049)*** .426 (.065)***
Higher education 331 (.605) 570 (.523) .252 (.112)* .521 (.101)***
Main occupation
Not working
◙
Professional 478 (.333) 864 (.409)* .338 (.097)*** .045 (.080)
Sales/services .116 (.242) .145 (.353) .281 (.054)*** .012 (.089)
Agriculture/fishery .848 (.248)** 1.110 (321)** .481 (.063)*** .216 (.076)**
Plant/machine operators and elementary work .273 (.297) .478 (.444) .170 (.071)* .049 (.076)
Income quintile
Poorest
◙
Poor .269 (.223) .736 (.298)* .003 (.056) .336 (.066)***
Middle .289 (.229) .603 (.303)* 129 (.063)* .176 (.077)*
Rich 165 (.242) 009 (.315) 207 (.070)** . 121 (.085)
Richest 077 (268) .352 (.366) 294 (.077)*** 044 (.094)
◙ = Reference category ***P < 0.001 **P < 0.01 *P < 0.05.
Total N 2003 (Females = 1,519, Males = 1,278) 2008 (Females = 4,306, Males = 3,503).
Source: Generated from WHS-Ghana 2003 and GDHS, 2008.
Tagoe and Dake Globalization and Health 2011, 7:7
/>Page 8 of 9
Received: 17 November 2010 Accepted: 7 April 2011
Published: 7 April 2011
References
1. Steyn K, Damasceno A: Lifestyle and related risk factors for chronic
diseases. In Disease and Mortality in Sub-Saharan Africa. Edited by: Jamison
DT, Feachem RG, Makogoba WM, Bos RE, Baingana KF, Hofman JK, Rogo
OK. Washington DC: The World Bank; 2006:247-264.
2. Kruger SH, Puoane T, Seneka M, van der Merwe TM: Obesity in South
Africa: challenge for government and health professionals. Public Health
Nutr 2005, 8(5):491-500.
3. Chitson P: Health care implications of non-communicable diseases.
Proceedings of the IGU Conference on Health Problems 1994.
4. Dake FAA, Tawiah EO, Badasu DM: Socio-demographic correlates of
obesity among Ghanaian women. Public Health Nutr 2010, 1-7.
5. Agyemang C, Owusu-Dabo E, de Jonge A, Martins D, Ogedegbe G,
Stronks K: Overweight and obesity among Ghanaian residents in the
Netherlands: how do they weigh against their rural and urban
counterparts in Ghana? Public Health Nutr 2008, 1-8.
6. Bosu WK: Ghana’s national NCD programme: history, prospects and
challenges. Proceedings of the First Annual Workshop British Academy UK-
Africa Academic Partnership on Chronic Disease in Africa, Noguchi
Memorial Institute for Medical Research; 2007.
7. Candib ML: Obesity and diabetes in vulnerable populations: reflection on
proximal and distal causes. Ann Fam Med 2007, 5(6):547-556.
8. Popkin BM, Gordon-Larsen P: The nutrition transition: worldwide obesity
dynamics and their determinants. Int J Obesity 2004, 28:S2-S9.
9. Popkin BM: The nutrition transition and its health implications in lower-
income countries. Public Health Nutr 1997, 1(1):5-21.
10. Daar AS, Singer PA, Persad DL, Pramming SK, Matthews DR, Beaglehole R,
Bernstein A, Borysiewicz LK, Colagiuri S, Ganguly N, Glass RI, Finegood DT,
Koplan J, Nabel EG, Sarna G, Sarrafzadegan N, Smith R, Yach D, Bell J:
Grand challenges in chronic non-communicable diseases. Nature 2007,
450(20):494-496.
11. Howson CP, Reddy KS, Ryan TJ, Bale JR, (Eds): Control of Cardiovascular
Diseases in Developing Countries: Research, Development, and
Institutional Strengthening. Washington, DC: National Academy Press;
1998.
12. Reddy KS, Yusuf S: Emerging epidemic of cardiovascular disease in
developing countries. Circulation 1998, 97:596-601.
13. Reddy KS: Cardiovascular diseases in the developing countries:
dimensions, determinants, dynamics and directions for public health
action. Public Health Nutr 2002, 5(1A):231-237.
14. World Health Organisation: The global strategy on diet, physical activity
and health. World Health Organisation Geneva; 2003.
15. Grundy SM, Cleeman JI, Daniels SR, Donato KA, Eckel RH, Franklin BA,
Gordon DJ: Diagnosis and Management of the Metabolic Syndrome: An
American Heart Association/National Heart, Lung, and Blood Institute
Scientific Statement. Circulation 2005, 112(17):2735-52.
16. World Health Organization: Preventing chronic diseases: a vital
investment. World Health Organisation, Geneva; 2005.
17. Archives of Internal Medicine: Effects of weight loss and sodium
reduction intervention on blood pressure and hypertension incidence in
overweight people with high-normal blood pressure: the trials of
hypertension prevention, phase II. Trials of Hypertension Prevention
Collaborative Research Group 1997, 157:657-667.
18. Appel LJ, Moore TJ, Obarzanek EO, Vollmer WM, Svetkey LP, Sacks FM,
Bray GA, Vogt TM, Cutler JA, Windhauser MM, Pao-Hwa L, Karanja N: A
clinical trial of the effects of dietary patterns on blood pressure. NEJM
1997, 336:1117-1124.
19. Wellness V: Healthy lifestyle interventions in general practice Part 1: An
introduction to lifestyle and diseases of lifestyle. Family Practice 2008,
50(4):19-22.
20. Health Foresight: Health and nutrition; renew your strength prevent
disease. Regenerative Foresight Media Network 2007.
21. Ministry of Health (MOH): Regenerative health; shifting the emphasis
from cure to prevention. 2007, Policy Briefing Paper 002.
22. Ministry of Health (MOH): Regenerative health and nutrition training of
trainers; facilitators guide. Ministry of Health, Ghana; 2008.
23. Ghana General News: Regenerative health and nutrition team from
Dimona helps cut medical cost in Ghana: Ghana loses $762 million
annually in malaria control.[ />2008_01_20_archive.html ], Accessed on 7th/September/2009.
24. Regenerative Health and Nutrition. [ />id=0006&], Accessed on 7th/September/2009.
25. World Health Organisation: Obesity and overweight. 2006 [http://www.
who.int/mediacentre/factsheets/fs311/en/], Accessed on 17/October/2008.
26. Mirowsky J, Ross CE: Education, personal control, lifestyle and health. Res
Aging 1998, 20:415-449.
doi:10.1186/1744-8603-7-7
Cite this article as: Tagoe and Dake: Healthy lifestyle behaviour among
Ghanaian adults in the phase of a health policy change. Globalization
and Health 2011 7:7.
Submit your next manuscript to BioMed Central
and take full advantage of:
• Convenient online submission
• Thorough peer review
• No space constraints or color figure charges
• Immediate publication on acceptance
• Inclusion in PubMed, CAS, Scopus and Google Scholar
• Research which is freely available for redistribution
Submit your manuscript at
www.biomedcentral.com/submit
Tagoe and Dake Globalization and Health 2011, 7:7
/>Page 9 of 9