Management of Benign Prostatic Hypertrophy - part 2 pdf
Bạn đang xem bản rút gọn của tài liệu. Xem và tải ngay bản đầy đủ của tài liệu tại đây (186.89 KB, 28 trang )
18 Stern et al.
30. Meigs JB, Mohr B, Barry MJ, Collins MM, McKinlay JB. Risk factors for
clinical benign prostatic hyperplasia in a community-based population of healthy
aging men. J Clin Epidemiol 2001;54(9):935–944.
31. Ohnishi K, Boyle P, Barry MJ, et al. Epidemiology and natural history of benign
prostatic hyperplasia. 4th International Consultation on BPH, Paris, July 2–5,
1997. Editors: Denis L, Griffiths K, Khoury S, et al., p. 16.
32. Derbes VDP, Leche SM, Hooker CC. The incidence of benign prostatic hyper-
trophy among the whites and negroes of New Orleans. J Urol 1937;38:383–388.
33. Rotkin ID. Origins, distribution and risk of benign prostatic hypertrophy. In:
Hinman F Jr, ed., Benign Prostatic Hypertrophy, New York: Springer-Verlag,
1983 pp. 10–21.
34. Meikle AW, Stephenson A, Lewis CM, et al. Age, genetic, and nongenetic
factors influencing variation in serum sex steroids and zonal volumes of the
prostate and benign prostatic hyperplasia in twins. Prostate 1997;33:105–111.
35. Partin AW, Sanda MG, Page WF, et al. Concordance rates for benign prostatic
disease among twins suggest hereditary influence. Urology 1994;44:646–650.
36. Sanda MG, Beaty TH, Stutzman RE, et al. Genetic susceptibility of benign
prostatic hyperplasia. J Urol 1994;152:115–119.
37. Meikle AW, Bansal A, Murray DK, et al. Heritability of the symptoms of benign
prostatic hyperplasia and the roles of age and zonal prostate volumes in twins.
Urology 1999;53:701–706.
38. Harbitz TB, Haugen OA. Histology of the prostate in elderly men: a study in an
autopsy series. Acta Pathol Microbiol Immunol Scand 1972;80:756–768.
39. Gray A, Feldman HA, McKinlay JB, et al. Age, disease, and changing sex
hormone levels in middle-aged men: results of the Massachusetts male aging
study. J Clin Endocrinol Metab 1991;73:1016–1025.
40. Grayhack JT, Sensibar JA, Ilio KY, et al. Synergistic action of steroids and
spermatocele fluid on in vitro proliferation of prostate stroma. J Urol 1998a;
159:2202–2209.
41. Lee C, Kozlowski JM, Grayhack JT. Intrinsic and extrinsic factors controlling
benign prostatic growth. Prostate 1997;31:131–138.
42. Partin AW. Etiology of benign prostatic hyperplasia in prostatic diseases. In:
Lepor H, ed., Philadelphia, PA: W. B. Saunders, 2000, pp. 95–105.
43. Nankin HR, Calkin JH. Decreased bioavailable testosterone in aging normal and
impotent men. J Clin Endocrinol Metab 1986;63:1418–1420.
44. Griffith K. Molecular control of prostate growth. In: Kirby R, McConnell J,
Fitzpatrick J, Roehrborn C, Boyle P, eds., Textbook of Benign Prostatic Hyper-
plasia, Oxford, UK: Isis Med Medico, 1996, pp. 22–55.
45. Mann T, Lutwak-Mann C. Male reproductive function and semen. New York:
Springer-Verlag, 1981.
46. Janulis L, Nemeth JA, Yang T, Lang S, Lee C. Prostatic luminal cell differen-
tiation and prostatic steroid-binding protein (PBP) gene expression are differ-
entially affected by neonatal castration. Prostate 2000;43:195–204.
47. Walsh PC, Wilson JD. The induction of prostatic hypertrophy in the dog with
androstanediol. J Clin Invest 1976;57:1093–1099.
48. Chang WY, Prins GS. Estrogen receptor-β: Implications for the prostate gland.
Prostate 1999;40:115–124.
49. Partin AW, Oesterling JE, Epstein JI, et al. Influence of age and endocrine factors
on the volume of benign prostatic hyperplasia. J Urol 1991;145:405–409.
50. Gann PH, Hennekens CH, Longcope C, et al. A prospective study of plasma
hormone levels, non hormonal factors and development of benign prostatic
hyperplasia. Prostate 1995;26:40–49.
Chapter 1 / Prostate Anatomy 19
51. Prins GS, Birch L. Neonatal estrogen exposure up-regulates estrogen receptor
expression in the developing and adult rat prostate lobes. Endocrinol 1997;
138:1801–1809.
52. Naslund MJ, Coffey DS. The differential effects of neonatal androgen, estrogen
and progesterone on adult rat prostate growth. J Urol 1986;136:1136–1140.
53. Grayhack JT, Kozlowski JM, Lee C. The pathogenesis of benign prostatic
hyperplasia: A proposed hypothesis and critical evaluation. J Urol 1998b;
160(suppl):2375–2380.
54. Ilio K, Kasjanski RZ, Sensibar JA, et al. Identification of a non-androgenic
prostate stimulating factor from the testis. J Urol 2000;163(suppl):204A.
55. Grayhack JT. Changes with aging in human seminal vesicle fluid fructose con-
centration and seminal vesicle weight. J Urol 1961;86:142–148.
56. Grayhack JT, Kropp KA. Changes with aging in prostatic fluid: citric acid,
acid phosphatase and lactic dehydrogenase concentration in man. J Urol
1965;93:258–262.
57. Grayhack JT, Lee C, Brand W. The effect of testicular irradiation in established
BPH in the dog: evidence of a non-steroidal testicular factor for BPH mainte-
nance. J Urol 1985;134:1276–1281.
58. Juniewicz PE, Berry SJ, Coffey DS, et al. The requirement of testes in establish-
ing the sensitivity of the canine prostate to develop benign prostatic hyperplasia.
J Urol 1994;152:996–1001.
59. Caine M, Pfau A, Perlberg S. The use of alpha-adrenergic blockers in benign
prostatic obstruction. Br J Urol 1976;48:255–263.
60. Lepor H. Adrenergic blockers for the treatment of benign prostatic hyperplasia. In:
Prostatic Diseases. Lepor H, ed., Philadelphia: WB Saunders, 2000, pp. 297–307.
61. Hutch JA, Rambo ON Jr. A study of the anatomy of the prostate, prostatic
urethra and the urinary sphincter system. J Urol 1970;104:443–452.
62. Ohnishi K. A study of the physical properties of the prostate (the second part).
The relationships between dysuria and the strength of the surgical capsule in
benign prostatic hypertrophy. J Jpn Urol Assoc 1986;77:1388–1399.
63. McConnell JD, Barry MS, Bruskewitz RC, et al. Benign Prostatic Hyperplasia:
Diagnosis and Treatment. Clinical practice guideline No. 8, US Dept. Health
and Human Services. Public Health Service Agency for Health Care Policy and
Research, Rockville, MD, 1994.
64. Mebust WK. Transurethral resection of the prostate and transurethral incision
of the prostate. In: Prostate Diseases. Lepor H, Lawson RK, eds., Philadelphia:
WB Saunders, 1993, pp. 150–163.
65. McConnell JD. Bladder responses to obstruction. In: Kirby R, McConnell J,
Fitzpatrick J, Roehrborn C, Boyle P, eds., Textbook of Benign Prostatic Hyper-
plasia, Oxford, UK: ISIS Medical Media, 1996, pp. 105–108.
66. Levin RM, Brading AF, Mills IW, et al. Experimental models of bladder outlet
obstruction in prostatic disease. In: Prostatic Diseases. Lepor H, ed., Philadelphia,
PA: WB Saunders, 2000, pp. 169–196.
67. Claridge M, Shuttleworth KE. The dynamics of obstructed micturition. Invest
Urol 1964;25:188–199.
68. Schoenberg HW, Gutrich JM, Cote R. Urodynamic studies in benign prostatic
hypertrophy. Urology 1979;14:634–637.
69. Pradhan BK, Chandra K. Morphogenesis of nodular hyperlasia—prostate. J
Urol 1975;113(2):210–213.
70. Moore RA. Benign hypertrophy of the prostate: a morphology study. J Urol
1943;50:680.
Chapter 2 / Definition of BPH 21
21
From: Management of Benign Prostatic Hypertrophy
Edited by: K. T. McVary © Humana Press Inc., Totowa, NJ
2
The Definition
of Benign Prostatic Hyperplasia
Epidemiology and Prevalence
Glenn S. Gerber, MD
CONTENTS
INTRODUCTION
BPH DEFINITIONS
PREVALENCE
EPIDEMIOLOGY OF BPH
E
CONOMICS OF BPH
S
UMMARY
REFERENCES
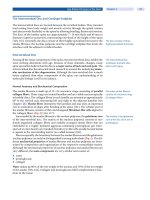
INTRODUCTION
Benign prostatic hyperplasia (BPH) is the most common neoplasm in
men and is a significant cause of urinary symptoms in the aging male (1).
Although much is unknown about the pathophysiology of BPH, the
condition results in a diminished quality of life for many patients.
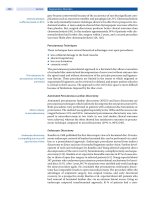
The symptoms of BPH can be broadly divided into obstructive and
irritative components. The former symptoms include a weakened uri-
nary stream, hesitancy, and the need to push or strain to initiate mictu-
rition. Irritative symptoms can be much more bothersome for many men
and include frequency, nocturia, and urgency (2). When assessing the
importance and magnitude of BPH, one must consider several factors.
First, the typical symptoms of BPH are nonspecific (3). There are many
other potential causes of urinary symptoms in aging men, including
diabetes mellitus, Parkinson’s disease, and stroke, which can lead to the
22 Gerber
same urinary problems seen in men with prostatic enlargement. Second,
unlike most other common, chronic medical disorders such as diabetes,
hypertension, or hypercholesterolemia, there is no standardized medi-
cal test or measurement that can be used to quantify the problem or
assess the response to treatment for men with BPH. Rather than lower-
ing blood pressure or maintaining blood glucose levels in the desired
range, the primary goal in the management of BPH for most patients is
a subjective improvement in urinary symptoms and quality of life.
Although objective measurements such as urinary flow rate and postvoid
residual urine volume can be used to evaluate BPH, the reproducibility
and correlation of these measures with urinary symptoms is often lim-
ited (4,5). Finally, much is unknown about the natural history of BPH,
and this may dramatically impact our understanding of the magnitude
and prevalence of the problem (6).
BPH DEFINITIONS
One of the most basic, yet most important, difficulties in the evalu-
ation and management of men with BPH concerns definitions. In a strict
sense, BPH is a histologic diagnosis that is established by the presence
of hyperplastic glands on pathologic inspection of prostatic tissue (1).
In common usage, however, the term BPH is used to indicate that a
patient has an enlarged prostate or that the patient has urinary symptoms
that are believed to be the result of bladder outlet obstruction by the
prostate. Peak urinary flow rate (Qmax) has also been used by many
investigators to help define the presence of BPH (3,4). A decrease in
Qmax is a nonspecific finding and may be attributable to detrusor dys-
function rather than bladder outlet obstruction (4,5). Nevertheless, BPH
has commonly been defined as Qmax less than 15 mL/s on a voided
volume of at least 125–150 mL and has been diagnosed based on this
finding.
Issues regarding the definition of BPH may be confusing for both
patients and primary care physicians, and it is important to keep this in
mind when counseling men regarding BPH. In addition, there is a poor
correlation between histologic changes within the gland, the size of the
prostate, and the severity of urinary symptoms (3). These confounding
relationships may be attributed in part to physiologic changes in the
aging bladder, alterations in the volume and pattern of urine produc-
tion, and/or other unspecified factors (7). To help clarify the terminol-
ogy associated with the diagnosis of BPH and to focus attention on the
lack of specificity of urinary symptoms, the alternative definition of
lower urinary tract symptoms (LUTS) has been recommended and
should be used when referring to such patients (8).
Chapter 2 / Definition of BPH 23
Although beyond the scope of this chapter, it is generally accepted
that the most important cause of LUTS in aging males is bladder outlet
obstruction resulting from prostatic enlargement (3). However, as dis-
cussed above, urinary symptoms commonly attributed to BPH are non-
specific and may result from a variety of other causes. An important but
largely unanswered issue concerns the relationship between LUTS and
bladder outlet obstruction. The gold standard in defining such obstruc-
tion is urodynamic study, in which the detrusor pressure is measured
during voiding (9). The single most important measure of obstruction is
detrusor pressure at Qmax (10). Using urodynamic evaluation, it has
been demonstrated that as many as one-third of men with urinary symp-
toms attributed to BPH do not have obstruction (9,11). Further evidence
supporting the disparity between LUTS and prostatic obstruction comes
from studies of age-matched women, who have been shown to have
urinary symptoms similar to those of men with BPH (12). Overall, the
nonspecific nature of LUTS and the lack of concordance between symp-
toms and obstruction make it very difficult to arrive at a generally
accepted definition of what constitutes BPH.
One of the most important developments in defining the extent and
magnitude of BPH has been the introduction of validated symptom
scores (13). Health measurement scales such as the American Urologi-
cal Association (AUA) symptom score must have demonstrated reli-
ability and validity to be clinically useful (14). Several factors must be
considered when determining the utility of such measures. First, inter-
nal-consistency reliability must be considered. This refers to the
relatedness of the different items in the scale and is evaluated by admin-
istering the questionnaire to a group of subjects (2). Second, the test-
retest reliability of the questionnaire must be established. This can be
accomplished by demonstrating that there is minimal change in the
results when the test is given to the same patients after a short interval
(2). Third, a questionnaire such as the AUA symptom score should have
the same degree of accuracy as any other diagnostic test used to assess
a disease process (2). To be valid, the symptom score results should
accurately quantify the severity of BPH in the same manner that serum
lipid levels reflect the disease status in patients with hypercholester-
olemia. Finally, health measurement scales must be responsive to be
useful in discriminating among patients who get better, get worse, or
remain the same with or without treatment over time (2,15).
Based on the criteria described above, the AUA symptom score has
been shown to be reliable and valid in the assessment of patients with
BPH (7,13). The seven questions that comprise the symptom score
address seven separate but related urinary symptoms that are typically
24 Gerber
associated with prostatic enlargement in the aging male. The results of
these questions are scored from 0 to 5 based on the frequency of occur-
rence of each symptom. The scores for the seven questions may then be
added to give a total score of 0–35. Based on this score, patients can be
categorized as having mild (0–7 points), moderate (8–19 points), or
severe (20–35 points) LUTS. In addition, an impact question designed
to assess the overall quality of life associated with urinary symptoms has
been added to the AUA symptom score (16). The initial seven questions
plus the quality of life question comprise the International Prostate
Symptom Score (I-PSS) (16). This questionnaire has been translated
into many languages and has been used worldwide to measure the inci-
dence and prevalence of BPH in many countries (17,18).
Because the I-PSS has been the benchmark evaluation used to estab-
lish the prevalence of BPH across the world, it is important to under-
stand the extent and reliability of testing that has been used to determine
its validity. Statistical measurements of internal consistency reliability
and 1-wk test–retest correlation have been shown to be 0.86 and 0.92,
respectively (13). Both of these measures highly support the reliability
of the I-PSS in these areas. Because there is no gold standard compari-
son for assessing the presence and severity of LUTS, it is also important
that the I-PSS be tested in other ways to determine its validity (2).
The I-PSS has been shown to correlate well with older questionnaires
used to assess voiding symptoms in men with BPH (19). Higher scores
in the I-PSS have also been demonstrated to correlate well with health
measurement scales designed to evaluate general health and well-being
(2,20). Additionally, the symptom score has been shown to be a reliable
predictor of whether men would choose to undergo prostatectomy for
BPH and in determining the response to surgical and medical therapy
(2,13,21,22). Overall, the I-PSS has been shown to be reliable and valid
through a variety of testing modalities. Therefore, its use in measuring
the prevalence of BPH and helping to understand the quality of life
changes, epidemiology, and health care costs associated with prostatic
enlargement is extremely valuable.
PREVALENCE
BPH is one of the most common conditions for which patients seek
medical attention. In recent years, a variety of factors have led to further
increases in the number of men evaluated and/or treated for LUTS.
These include increased attention to prostate diseases in the lay press,
the escalating use of the Internet as a source of information for
patients, advertising by pharmaceutical companies in mainstream pub-
Chapter 2 / Definition of BPH 25
lications, and the growing elderly population in the United States and
other developed countries. In addition to those patients diagnosed with
BPH, surveys of men over 40 yr of age have demonstrated a significant
incidence of urinary symptoms among unevaluated groups (17,18,23).
Using a histologic definition, the prevalence of BPH is greater than
50% by age 60 and almost 90% by age 85 (1). It is estimated that about
half of these men will have detectable prostatic enlargement and that
half of those will seek medical attention because of LUTS (1). The
Agency for Health Care Policy and Research Diagnostic and Treatment
Guidelines for BPH in 1994 estimated that approx 25% of white males
in the United States in 1990 had an AUA symptom score of 8 or greater
(moderate-to-severe symptoms) and Qmax less than 15 mL/s (1). Ad-
ditional information concerning the prevalence and demographics of
BPH has come from the Rochester Epidemiology Project, which has
studied the population of Olmstead County, Minnesota (24). Based on
symptom questionnaires administered to unselected men living in this
community, it was found that moderate-to-severe urinary symptoms
were present in 13% of men between 40 and 49 yr and in 28% of those
older than 70 yr (24). Longitudinal studies in this group have demon-
strated that the 10-yr cumulative risk acute urinary retention developing
in a man with moderate symptoms is almost 14% (2,24). In addition,
a consistent decline in Qmax was noted when this parameter was mea-
sured longitudinally in this community-based cohort (25). Although
most American studies of BPH prevalence have focused on white men,
there does not appear to be an increased risk of BPH in African Ameri-
cans (26).
Investigators in other countries have studied the prevalence of
BPH using symptom questionnaires and have found similar results
(17,18,23,27). Chicharro-Molero et al. evaluated 1106 men in a Spanish
community using the I-PSS (17). In addition, prostate size was mea-
sured by transrectal ultrasonography (TRUS), and Qmax was measured.
Overall, the prevalence of moderate or severe symptoms was approx
25% and, as expected, tended to increase with age. Using the impact
question (quality of life measure) from the I-PSS, it was concluded that
12.5% of men had a poor quality of life. Interestingly, among younger
men, moderate symptoms were perceived as resulting in poor quality of
life, whereas the same symptoms in older men led to a subjective
sense of a good quality of life. Qmax less than 15 mL/s was noted in
more than 55% of men. Using a definition of BPH that included an I-PSS
more than 7, prostate size more than 30 g, and Qmax less than 15 mL/s,
the authors found that the prevalence of BPH in this population was
11.8%. Among patients less than 50 yr of age, however, the prevalence
26 Gerber
using this definition was less than 1%, and in men older than 70 yr, the
prevalence using this definition was 30%. In another study, the I-PSS
was administered to 2096 men 20 yr or older in Austria, who also
underwent a digital rectal examination (DRE) and provided a detailed
urologic history (18). When stratified by decade, patients with advanc-
ing age showed an increase in the I-PSS and the incidence of previous
surgical treatment for BPH (Table 1).
The prevalence of BPH was also studied in a Dutch population of
502 men between the ages of 55 and 74 yr who had no history of prostate
cancer or surgical treatment for BPH (27). In addition to the I-PSS,
prostate volume, Qmax, and postvoid residual urine volumes (PVR)
were measured. Using the I-PSS, moderate or severe symptoms were
noted in 24% and 6% of men, respectively. A good correlation was
found between the total symptom score and the single disease-specific
quality of life question included with the I-PSS. However, weak corre-
lations were noted between the I-PSS results and prostate volume, Qmax,
PVR, and age. Based on the poor correlation between the magnitude of
urinary symptoms and the observed objective measures, the authors of
this study concluded that symptom scores should not be independently
used as a criterion for determining the prevalence of clinical BPH.
A subsequent Dutch study of nearly 4000 men between 50 and 75 yr
of age further demonstrated the difficulty in defining the clinical preva-
lence of BPH (28). In this trial, men completed the I-PSS and also
underwent physical examination, measurement of prostate volume by
TRUS, and determination of Qmax. To define the prevalence of BPH,
a variety of definitions of BPH that had been suggested by earlier studies
to be most valid were assessed (29,30). Using an I-PSS of eight or
greater to define the presence of clinical BPH, the overall incidence in
this study among all men was 25% (28). However, there were significant
Table 1
Prevalence of LUTS in 2096 Austrian Men
Age Moderate
(yr) Mean I-PSS to severe LUTS Previous TURP
20–29 2.1 6.3% 0%
30–39 2.6 8.4% 0%
40–49 3.0 11.1% 0%
50–59 5.8 27.1% 1.3%
60–69 5.7 28.3% 4.2%
70–79 6.4 36.0% 20.9%
80 or greater 6.1 35.7% 27.5%
Adapted from ref. 18.
Chapter 2 / Definition of BPH 27
differences in the prevalence of BPH when alternative definitions were
used. As defined by a symptom score of eight or greater and a prostate
volume of more than 30 g, the incidence of BPH in this study was 14%.
When also requiring a Qmax of less than 15 mL/s, 12% of men met the
criteria used to define the presence of BPH. Because no clear consensus
has been reached as to how BPH should be defined, it is apparent that
there will be wide differences in the reported prevalence rates depending
on the choice of criteria used.
EPIDEMIOLOGY OF BPH
A number of investigators have studied the epidemiology of BPH.
Clearly, the most important demographic factor in the incidence and
severity of BPH is aging. Not only does prostate size correlate closely
with age, but worsening LUTS is also seen commonly as men get older.
Rhodes et al. studied men using serial prostatic ultrasonography per-
formed during a follow-up period of approx 7 yr (31). In general, higher
prostate growth rates were seen in men with larger baseline glands, and
the average annual change was 1.6% across all age groups. Although
urinary symptoms may worsen because of ongoing prostatic enlarge-
ment, it is also likely that some component of symptom progression is
attributable to increased bladder dysfunction associated with aging and
other factors.
In addition to aging, a variety of other factors have been investigated
in men with BPH. In many cases, disparate results have been noted in
different trials. Platz et al. studied the role of racial or ethnic origin in
the prevalence of BPH among American male health professionals (26).
Included in the study were 1508 men who underwent surgery for BPH
between 1986 and 1994 and 1837 men who had moderate-to-severe
LUTS during approximately the same time period. In addition, more
than 23,000 asymptomatic men were also included. The authors of this
study found that African-American men were not at increased risk for
BPH compared with white men. Although Asian men were less likely
to have undergone surgery for BPH than white men, the relative risk for
symptoms was similar in the two groups. White men of Scandinavian
heritage had a slightly decreased likelihood of BPH symptoms than
white men of southern European origin. Homma et al. studied approx
7500 men in Asia and Australia using the I-PSS and compared their
results to those found in studies of men in Europe and North America
(32). They concluded that the prevalence of symptomatic men in Asia
and Australia is similar or greater than the number among the compari-
son group. Studies have also been conducted concerning the role of
28 Gerber
family history in the development of BPH and urinary symptoms (33).
Using the Olmstead County population in Minnesota, 2119 men com-
pleted symptom scores, had their flow rates measured, and were ques-
tioned regarding their family history of BPH and prostatic enlargement
(33). The age-adjusted odds ratio of having moderate or severe urinary
symptoms was elevated to 1.3 among those with a family history. The
relative risk was also greater for men with relatives diagnosed with BPH
at a younger age. Finally, men with a family history were also 1.3 times
more likely to have a diminished Qmax.
The role of a variety of lifestyle factors in the development of BPH
has also been investigated. Three studies have addressed the effect of
cigarette smoking on prostate size and BPH (34–36). Meigs et al. fol-
lowed 1709 men age 40 to 70 yr for a mean of 9 yr (34). Men were
classified with clinical BPH if they reported frequent or difficult void-
ing and were told by a physician that they had an enlarged prostate, or
if they had undergone surgery for BPH. Using this classification, ciga-
rette smoking appeared to lower the risk of developing clinical BPH.
Similarly, in a study of Japanese men who underwent transrectal ultra-
sonography with measurement of prostate size, it was found that men
who smoked cigarettes had a lower risk of prostatic enlargement (35).
Contrasting results regarding the effects of cigarette smoking were
noted, however, in a study of Greek men (36). In this investigation,
which included men who were surgically treated for BPH and normal
controls, cigarette smoking had no major effect on the incidence of BPH.
The relationship between diet and BPH has been explored by several
investigators (34,35,37). Lagiou et al. studied Greek men with and
without prostate disease and found that increased consumption of both
butter and margarine was positively associated with the risk of BPH
(37). In addition, fruit intake appeared to lower the risk of BPH. In an
American study, no association between total or fat calorie intake and
the development of BPH was noted (34). Nukui has reported that higher
serum levels of β-carotene were seen in men with BPH compared to
those without prostate disease (35). In addition to dietary factors, it has
been suggested that obesity may play a role in the development of BPH
(38). Possible reasons for this include the increase in estrogen-androgen
ratio that occurs in obesity and greater sympathetic nervous system
activity (38). Giovannucci et al. studied the association between obesity
and BPH in men age 40 to 75 yr who were participants in the Health
Professionals Follow-Up Study (38). These investigators found that
abdominal obesity may increase the frequency and severity of urinary
obstructive symptoms and did increase the likelihood of men under-
going surgical treatment for BPH. In contrast to these results, Meigs et al.
Chapter 2 / Definition of BPH 29
reported that body mass index and waist-hip ratio were not helpful in
predicting the presence of clinical BPH (34).
Hyperinsulinemia has been suggested to be a risk factor for the devel-
opment of BPH (39). Hammarsten and Hogstedt studied 307 men with
LUTS to investigate the effects of metabolic disease and fasting plasma
insulin levels on the annual growth rate of the prostate (39). Prostate
volume was determined by serial transrectal ultrasound, and insulin
levels were assessed from fasting blood samples. Serum cholesterol
levels, blood pressure, history of hypertension, body height and weight,
and body mass index were also assessed. In the entire group of patients,
the median annual prostatic growth rate was 1.03 mL/yr. This growth
rate was significantly faster in men with metabolic disease, noninsulin-
dependent diabetes mellitus, treated hypertension, obesity, and
dyslipidemia. In addition, the prostatic growth rate correlated positively
with the diastolic blood pressure and the body mass index and correlated
negatively with the high-density lipoprotein cholesterol level. High
fasting plasma insulin levels also correlated with the annual prostate
growth rate and were an independent predictor of prostate gland volume
using multivariate analysis. The authors of this study concluded that
hyperinsulinemia is a causative factor in the development of BPH and
felt that their findings supported the concept of increased sympathetic
activity in men with BPH.
Oh et al. investigated the association of BPH and male-pattern bald-
ness (40). Both are androgen-dependent and it is logical to presume that
there may be an increased incidence of prostatic enlargement and/or
BPH symptoms among bald men. The study involved 225 patients with
BPH and 160 controls of similar age (40). Baldness was graded on a
scale of 1 to 7 (Norwood classification), and BPH was evaluated using
the I-PSS. The investigators found that patients with BPH had a higher
grade of male-pattern baldness compared with controls. Overall, the
proportion of men with baldness of grade 4 or greater in the BPH group
was significantly larger than that of the control group (54 vs 37%).
Finally, limited study suggests that physical exercise may have a protec-
tive effect against the development of clinical BPH, and alcohol intake
was not helpful in predicting the presence of BPH (34,35).
ECONOMICS OF BPH
It is likely that the cost of treatment associated with BPH will con-
tinue to rise in upcoming years for a variety of reasons. The aging
population in the United States and other Western countries will result
in a greater number of men with BPH who will require treatment. It has
30 Gerber
been estimated that by the year 2020 there will be 65 million Americans
65 yr of age or older (41). In addition, new pharmacologic and techno-
logic developments are likely to improve the therapy of BPH and lower
the incidence of side effects, thus leading more men to choose to be
treated. Newer technology is generally more expensive, however, which
will further increase costs. Finally, a greater awareness among layper-
sons regarding prostate disease and treatment options is likely to increase
the number of men seeking medical attention for BPH.
There is a great deal of information that is unknown regarding the
cost-effectiveness associated with the evaluation and management of
men with BPH (42). Although the details are beyond the scope of this
chapter, a variety of diagnostic methods are available to the physician
when assessing men with LUTS. There remains much controversy sur-
rounding the use of these tests, and no clear consensus has been reached
in many cases. Similarly, the growing treatment options available for
men with BPH have only added to the confusion regarding the best
and/or most cost-effective options. Although medical therapy may be
less expensive in the short term, surgical or device therapy may ulti-
mately be less expensive when long-term costs are considered (43).
Much work needs to be done in these areas as we strive to define the best
approach to evaluate and manage men with BPH.
SUMMARY
BPH is an important cause of diminished quality of life among aging
men, and the prevalence of this condition in the United States is likely
to grow as the population ages. A variety of definitions of BPH is avail-
able based on the presence of urinary symptoms, prostatic enlargement,
and/or the histologic finding of hyperplastic glands. In addition,
urodynamic results demonstrating decreased urinary flow rates or blad-
der outlet obstruction may also be used to help define the presence of
BPH. Although nonspecific, the presence of LUTS such as frequency,
hesitancy, or nocturia are most commonly used to define the prevalence
of BPH. Overall, the introduction and validation of symptom question-
naires such as the I-PSS has added greatly to our understanding of the
extent and magnitude of BPH in a variety of populations.
A number of epidemiologic factors have been investigated among
men with BPH. Although aging clearly has the most important effect on
the development of prostatic enlargement and urinary symptoms, a
variety of other factors may also play a role in the occurrence of BPH.
It appears that racial or ethnic background may play a minor role in the
incidence of BPH. However, African-American men do not appear to be
Chapter 2 / Definition of BPH 31
at increased risk compared with whites and other groups. Although a
family history of BPH appears to increase the overall likelihood that
urinary symptoms and prostatic enlargement will occur, the ambiguity
associated with the definition of BPH among relatives is a limiting
factor. Among lifestyle factors, cigarette smoking seems to lower the
risk of BPH, whereas obesity and a high-fat diet may increase the inci-
dence of prostatic enlargement. Conflicting results have been reported,
however, in different studies, and the precise role of many factors in the
development of BPH remains largely unknown. As the importance of
BPH grows, it is likely that further information will become available
regarding the role of epidemiologic factors in BPH.
REFERENCES
1. McConnell JD, Barry MJ, Bruskewitz RC, et al. Benign Prostatic Hyperplasia:
Diagnosis and Treatment. Clinical Practice Guideline, Number 8. Rockville,
MD, Agency for Health Care Policy and Research, US Public Health Service,
US Dept of Health and Human Services, 1994. AHCPR Publication No. 94-0582.
2. Barry MJ. Evaluation of symptoms and quality of life in men with benign pro-
static hyperplasia. Urology 2001;58(suppl 6a):25.
3. Barry MJ, Cockett ATK, Holtgrewe HL, et al. Relationship of symptoms of
prostatism to commonly used physiologic and anatomical measures of the
severity of benign prostatic hyperplasia. J Urol 1993;150:351.
4. Andersen JT, Nordling J, Walter S. Prostatism: I. The correlation between symp-
toms, cystometric and urodynamic findings. Scand J Urol Nephrol 1979;13:229.
5. Brooks ME, Hanani D, Braf ZF. Relationship between subjective complaints
and urinary flow. Urology 1983;22:449.
6. Jacobsen SJ, Girman CJ, Lieber MM. Natural history of benign prostatic hyper-
plasia. Urology 2001;58(suppl 6a):5.
7. Yalla SV, Sullivan MP, Lecamwasam HS, et al. Correlation of American Uro-
logical Association symptom index with obstructive and non-obstructive pros-
tatism. J Urol 1995;153:674.
8. Abrams P. New words for old: lower urinary tract symptoms for “prostatism”.
BMJ 1994;308:929.
9. Schafer W, Rubben H, Noppeney R, Deutz FJ. Obstructed and unobstructed
prostatic obstruction. A plea for urodynamic objectivation of bladder outflow
obstruction in benign prostatic hyperplasia. World J Urol 1989;6:198.
10. Abrams P. Objective evaluation of bladder outlet obstruction. Br J Urol
1995;76(suppl):11.
11. Rollema HJ, van Mastrigt R. Improved indication and follow up in transurethral
resection of the prostate using the computer program CLIM: a prospective study.
J Urol 1992;148:113.
12. Lepor H, Machi G. Comparison of the AUA symptom index in unselected males
and females between 55 and 79 years of age. Urology 1993;42:36.
13. Barry MJ, Fowler FJ Jr., O’Leary MP, et al. The American Urological Associa-
tion symptom index for benign prostatic hyperplasia. J Urol 1992;148:1549.
14. Streiner D, Norman G. Health Measurement Scales: A Practical Guide to Their
Development and Use, Oxford, Oxford University Press, 1989, pp. 4–10.
32 Gerber
15. Wright JG, Young NL. A comparison of different indices of responsiveness.
J Clin Epidemiol 1997;50:239.
16. Barry MJ, Adolfsson J, Batista J, et al. Committee 6: measuring the symptoms
and health impact of benign prostatic hyperplasia and its treatments. In Denis L,
Griffiths K, Khoury S, et al., eds., Proceedings of the Fourth International Con-
sultation on Benign Prostatic Hyperplasia. Plymouth, UK: Health Publications,
Ltd, 1998, pp. 265–321.
17. Chicharro-Molero JA, Burgos-Rodriguez R, Sanchez-Cruz JJ, et al. Prevalence
of benign prostatic hyperplasia in Spanish men 40 years old or older. J Urol
1998;159:878.
18. Madersbacher S, Haidinger G, Temml C, Schmidbauer CP. Prevalence of lower
urinary tract symptoms in Austria as assessed by an open survey of 2,096 men.
Eur Urol 1998;34:136.
19. Barry MJ, Fowler FJ Jr, O’Leary MP, et al. Correlation of the American Urologi-
cal Association symptom index with self-administered versions of the Madsen-
Iversen, Boyarsky and Maine Medical Assessment Program symptom indexes:
Measurement committee of the American Urological Association. J Urol
1992;148:1558.
20. Barry MJ, Fowler FJ, Jr, O’Leary MP, et al. Measuring disease-specific health
status in men with benign prostatic hyperplasia. Med Care 1995;33:AS145.
21. Barry MJ, Fowler FJ, Mulley AG, et al. Patient reactions to a program designed
to facilitate patient participation in decisions for benign prostatic hyperplasia.
Med Care 1995;33:771.
22. Barry MJ, Williford WO, Chang Y, et al. Benign prostatic hyperplasia specific
health status measures in clinical research: how much change in the American
Urological Association symptom index and the benign prostatic hyperplasia
impact index is perceptible to patients? J Urol 1995;154:1770.
23. Haidinger G, Madersbacher S, Waldhoer T, et al. The prevalence of lower uri-
nary tract symptoms in Austrian males and associations with sociodemographic
variables. Eur J Epidemiol 1999;15:717.
24. Chute CG, Panser LA, Girman CJ, et al. The prevalence of prostatism: a popu-
lation-based survey of urinary symptoms. J Urol 1993;150:85.
25. Roberts RO, Jacobsen SJ, Jacobsen DJ, et al. Longitudinal changes in peak
urinary flow rates in a community based cohort. J Urol 2000;163:107.
26. Platz EA, Kawachi I, Rimm EB, et al. Race, ethnicity and benign prostatic
hyperplasia in the health professionals follow-up study. J Urol 2000;163:490.
27. Bosch JL, Hop WC, Kirkels WJ, Schroder FH. The International Prostate Symp-
tom Score in a community-based sample of men between 55 and 74 years of age:
prevalence and correlation of symptoms with age, prostate volume, flow rate
and residual urine volume. Br J Urol 1995;75:622.
28. Blanker MH, Groeneveld FP, Prins A, et al. Strong effects of definition and
nonresponse bias on prevalence rates of clinical benign prostatic hyperplasia:
the Krimpen study of male urogenital tract problems and general health status.
BJU Int 2000;85:665.
29. Garraway WM, Collins GN, Lee RJ. High prevalence of benign prostatic hyper-
trophy in the community. Lancet 1991;338:469.
30. Bosch JL, Hop WC, Kirkels WJ, Schroder FH. Natural history of benign pros-
tatic hyperplasia: appropriate case definition and estimation of prevalence in the
community. Urology 1995;46:34.
31. Rhodes T, Girman CJ, Jacobsen SJ, et al. Longitudinal prostate growth rates
during 5 years in randomly selected community men 40-79 years old. J Urol
1999;161:1174.
Chapter 2 / Definition of BPH 33
32. Homma Y, Kawabe K, Tsukamoto T, et al. Epidemiologic survey of lower
urinary tract symptoms in Asia and Australia using the international prostate
symptom score. Int J Urol 1997;4:40.
33. Roberts RO, Rhodes T, Panser LA, et al. Association between family history of
benign prostatic hyperplasia and urinary symptoms: results of a population-
based study. Am J Epidemiol 1995;1:142.
34. Meigs JB, Mohr B, Barry MJ. Risk factors for clinical benign prostatic hyper-
plasia in a community-based population of healthy aging men. J Clin Epidemiol
2001;54:935.
35. Nukui M. Epidemiological study on diet, smoking and alcohol drinking in the
relationship to prostatic weight. Nippon Hinyokika Gakkai Zasshi 1997;88:950.
36. Signorello LB, Tzonou A, Lagiou P, et al. The epidemiology of benign prostatic
hyperplasia: a study in Greece. BJU Int 1999;84:286.
37. Lagiou P, Wuu J, Trichopoulou A, et al. Diet and benign prostatic hyperplasia:
a study in Greece. Urology 1999;54:284.
38. Giovannucci E, Rimm EB, Chute CG, et al. Obesity and benign prostatic hyper-
plasia. Am J Epidemiol 1994;140:989.
39. Hammarsten J, Hogstedt B. Hyperinsulinaemia as a risk factor for developing
benign prostatic hyperplasia. Eur Urol 2001;39:151.
40. Oh BR, Kim SJ, Moon JD, et al. Association of benign prostatic hyperplasia with
male pattern baldness. Urology 1998;51:744.
41. Holtgrewe HL, et al. The economics of the management of lower urinary tract
symptoms and benign prostatic hyperplasia. In: Denis L, Griffiths K, Khoury S,
et al., eds., Proceedings of the 4th International Consultation on BPH, Plymouth,
UK: Health Publication Ltd, 1998, pp. 63–81.
42. Stoevelaar HJ, McDonnell J. Changing therapeutic regimens in benign prostatic
hyperplasia. Clinical and economic considerations. Pharmacoeconomics
2001;19:131.
43. McDonnell J, Busschbach JJ, Kok E, et al. Lower urinary tract symptoms sug-
gestive of benign prostatic obstruction- Triumph: health-economical analysis.
Eur Urol 2001;39(suppl 3):37.
Chapter 3 / Pathophysiology, Diagnosis, and Treatment of POD 35
35
From: Management of Benign Prostatic Hypertrophy
Edited by: K. T. McVary © Humana Press Inc., Totowa, NJ
3
Pathophysiology, Diagnosis,
and Treatment
of the Postobstructive Diuresis
Chris M. Gonzalez, MD
CONTENTS
CASE REPORT
BASIC PATHOPHYSIOLOGY
DIAGNOSIS
LABORATORY DATA
TREATMENT
CONCLUSION
REFERENCES
CASE REPORT
A 68-year-old man was seen in the emergency room with a 4-d com-
plaint of dribbling urination and lower abdominal discomfort. His medi-
cal history included hypertension controlled on two medications and
benign prostatic hyperplasia (BPH) treated with an α1-receptor antago-
nist. The patient’s vital signs revealed a temperature of 99°F, blood
pressure of 132/80, pulse of 65 beats per min, and respiratory rate of 10.
On physical examination, the patient was alert and responsive to com-
mands and had lower abdominal distension with moderate edema of the
lower extremities. His serum electrolyte levels were normal, with serum
blood urea nitrogen (BUN) level and creatinine levels of 42 and 3.5,
respectively. A Foley catheter was placed in the patient’s bladder and
2 L of urine were drained. Urinalysis revealed 3 white blood cells per
high-powered field with eventual culture showing no bacterial growth.
Renal ultrasound revealed bilateral hydroureteronephrosis with no evi-
dence of parenchymal abnormalities or echogenic foci.
36 Gonzalez
The patient was given free access to oral fluids and observed in the
emergency room for the next 4 hr, with urine output of 1200 mL during
that time. Repeat serum electrolyte testing was normal and showed a
urine osmolality of 150 mosM/L, spot urine sodium excretion of
50 meq/L, and fractional excretion of sodium (FENa) > 1. The patient
was admitted to the hospital for observation. Over the next 24 hr, he was
given free access to oral intake, and his urine output remained high at
250 mL/hr. His mental status, physical examination, vital signs, and
serum electrolyte levels remained normal throughout this time; how-
ever, he did have persistent azotemia, with a serum BUN/creatinine of
42/3.4, urine osmolality of 1.000, and FENa > 1.
He was started on intravenous D5 half-normal saline with milliliter-
for-milliliter fluid replacement of the previous 2-hr urine output. He was
still granted free access to oral fluids at this time. His vital signs remained
stable over the next 12 hr, with normal serum electrolyte levels and a
repeat serum BUN/creatinine of 21/2.3. At this time, the urine specific
gravity was 1.010, urine osmolality was 350 mosM/L, and FENa was
> 1. Intravenous fluid replacement was continued over the next several
hours, and the urine output remained brisk at 200 mL/hr with no change
in the patient’s vital signs or mental status. Twelve hours later, the
serum electrolyte levels were normal and serum BUN/creatinine was
12/1.1. The intravenous fluids were stopped, and the patient was dis-
charged home. Over the next 72 hr, the patient’s urine output slowed to
2500 mL/d with moderate oral intake. Repeat renal ultrasound revealed
resolution of the hydronephrosis, and the patient underwent successful
transurethral prostatic resection one month later.
This case report demonstrates a management scheme for the patient
with postobstructive diuresis (POD) after relief of a bladder neck
obstruction. Complete urinary tract obstruction impedes the ability of
the kidneys to concentrate and regulate the urine properly. After relief
of the obstructive process, there may be a marked diuresis of solutes and
water that ranges from mild and self-limiting to severe and potentially
life-threatening. Although most patients do not exhibit POD of water
and solutes, it is important to have a high index of suspicion for this
condition so that it can be recognized promptly and managed. This
chapter will attempt to provide a basic, simplified guide toward under-
standing issues related to the pathophysiology, diagnosis, and treatment
of POD.
BASIC PATHOPHYSIOOGY
A description of renal physiology is beyond the scope of this chapter,
and the reader is referred elsewhere for a review of this subject. Com-
Chapter 3 / Pathophysiology, Diagnosis, and Treatment of POD 37
plete obstruction of the urinary tract refers to a process that involves
both kidneys or a solitary kidney. At the basis of this pathophysiologic
milieu is an elevation of ureteral pressure that is ultimately transmitted
to the level of Bowman’s capsule. This increased intratubular pressure
causes a decrease in hydrostatic pressure at the interface of Bowman’s
capsule and the glomerulus, causing vasoconstriction of the glomerular
vessels and a reduced glomerular filtration rate (GFR). This decrease in
GFR causes further vasoconstriction of the afferent renal arterioles and
leads to an overall decrease in renal blood flow (1). This entire process
begins within the first 24 hr of complete obstruction and will progress
rapidly if unaltered.
Decreased blood flow to the obstructed kidney(s) leads to azotemia,
ischemia, and eventual acute tubular necrosis (ATN), all of which impair
the kidney’s ability to maintain a normally hyperosmotic medullary
interstitium. It is this hyperosmotic medullary gradient maintained
through the tubular regulation and reabsorption of sodium, urea, and
water that is responsible for the kidney’s ability to concentrate urine.
The two main tubular areas that are damaged from ischemia and ATN
are the normally water-impermeable, thick ascending limb of Henle and
the collecting duct. Damage to these tubular structures prevents the
reabsorption of sodium and chloride in the thick ascending limb and
prevents the reabsorption of urea in the collecting duct. The inability to
reabsorb these particular solutes prevents the maintenance of the
hyperosmolar medullary gradient and the subsequent ability of the kid-
neys to concentrate the urine before excretion (2). In addition to causing
the tubular damage that leads to POD, the solutes and water that are
retained as a result of the obstructed urinary tract accumulate within
the tubules and interstitium of the kidney and lead to an overall volume
expansion of the patient. Once the obstructed urinary tract is relieved,
the restored blood flow to the kidney and specifically to the medullary
interstitium causes a washout of the retained solutes and water from the
tubules and interstitium of the kidney. This washout of the hyperosmolar
medullary gradient in concert with excretion of the retained water and
solutes in the POD leads to the indiscriminate diuresis seen in some
patients (2–5).
Hormones also have a role in urinary tract obstruction and possibly
in POD. Secretion of atrial natriuretic peptide in response to stretch of
the right atrium has been reported in patients with an obstructed urinary
tract (6). Elevated serum levels of atrial natriuretic peptide have also
been found to increase the GFR through afferent arteriolar smooth
muscle relaxation and to improve the filtration of plasma at the glom-
erular/tubular interface (3,6,7). Because of these natriuretic (sodium
excretion) and diuretic affects, this peptide has been implicated as a
38 Gonzalez
cause of POD, along with fluid overload and tubular injury. This
hypothesis, however, is controversial, and further data are needed (8).
The role of the secretion and regulation of antidiuretic hormone during
POD is still unclear.
Clinically, three types of POD have been described: physiologic,
pathologic, and iatrogenic (5,9,10). The basis of a physiologic POD
includes the loss of iso-osmotic urine (300 mosM/L) without excessive
solute loss (sodium and urea) from the kidney. The excessive urine
output in this process stems from the excretion of the retained sodium,
potassium, urea, and water within the tubules and interstitium of the
kidney during the obstructive process. Because these substances could
not be reabsorbed or excreted during the obstructive process, they are
removed by means of a relatively limited physiologic water diuresis
after the obstruction has been relieved. This type of POD is generally
self-limited and subsides within 24 hr after the excess free water and
solutes have been excreted and renal function normalizes. Prolonged
azotemia and congestive heart failure (CHF) can potentiate this physi-
ologic subtype of POD, and these patients should be monitored closely.
Less common is a pathologic POD that involves the excessive loss of
sodium from the tubules because of ATN incurred during the obstruc-
tive process. This excessive loss of sodium is not related to the excretion
of retained sodium during the obstructive process but rather to the injured
renal tubule’s inability to reabsorb this solute. Sodium losses in this
condition can be massive and are associated with equal losses of free
water (9,11). Because this condition is usually associated with acute
renal failure and rapid volume depletion as a result of enormous sodium
and water losses, intensive monitoring and aggressive volume replace-
ment should be instituted.
Finally, iatrogenic POD involves the excessive intravenous replace-
ment of glucose to the patient. Large amounts of this solute can overload
the proximal tubule’s ability to reabsorb it and POD can be prolonged.
Management involves the elimination of excessive glucose from the
intravenous fluids.
DIAGNOSIS
POD refers to the potential polyuria that can occur after relief of an
obstructed urinary tract involving either both kidneys or a solitary kid-
ney. Generally, obstruction occurs at the level of the bladder neck in
male patients, but rarely, obstruction can involve an extrinsic or intrin-
sic process that occludes both ureters or the ureter of a solitary kidney.
Although there are many potential causes of complete urinary tract
Chapter 3 / Pathophysiology, Diagnosis, and Treatment of POD 39
obstruction, there does not appear to be any relationship between the
cause of the obstructive process and the incidence or severity of result-
ant POD. Therefore, the importance of taking a thorough medical his-
tory, performing a good physical examination, and appropriately
interpreting laboratory data are mandatory to identify those with or at
risk for POD.
The most important issue for a patient with an obstructive uropathy
is immediate, definitive relief of the occluded kidneys. Maneuvers such
as clamping the Foley catheter for a time after each half-liter of urine is
drained has no physiologic basis and only delays the complete relief of
total urinary obstruction. Once the patient’s urinary tract has been com-
pletely relieved, close monitoring of the patient’s overall fluid status
and urine output is mandatory. The definition of POD is sustained urine
output of more than 200 mL/ hr for 24 hr; however, it is wise to assume
that this process is underway if urine output remains more than 200 mL/hr
for the first 2 to 3 hr after relief of obstruction. Factors such as high
glucose-containing intravenous fluid preparations, uncontrolled diabe-
tes, or excessive hypertonic fluid replacement should be recognized and
addressed before making a diagnosis of POD.
Historic elements that are important include renal insufficiency, CHF,
hypertension, recent hypotension, dizziness, or mental status impair-
ment. Any of these conditions can place the patient at high risk for
possible POD, and close monitoring should be instituted (5) . Vital signs
and urine output should be monitored every 2 hr in these high-risk
patients once the obstructive process has been relieved.
The patient’s general appearance and mental status should be closely
followed once urinary obstruction has been relieved because altered
sensorium may indicate an underlying metabolic disturbance that will
affect the patient’s ability to take oral replacement for ongoing water
and solute loss. A complete physical examination should be conducted
with special attention to findings consistent with volume overload such
as jugular venous distension, presence of rales on auscultation of the
lungs, and lower extremity edema. Serum chemistries including BUN,
creatinine, electrolyte, magnesium, phosphorous, calcium, and glucose
levels should be obtained. Obtaining BUN and serum creatinine levels
when the patient is first seen is important because a patient with azotemia
is also considered to be at high risk for POD and should be managed
accordingly. Urine sodium, potassium, chloride, and creatinine levels in
addition to specific gravity should be obtained if urine output remains
high and POD is suspected. Urine is sent for analysis and culture, and
empiric antibiotic therapy should be instituted in the presence of pyuria
or bacteruria.
40 Gonzalez
LABORATORY DATA
The frequency of obtaining serum and urine chemistries is according
to the judgment of the clinician and largely depends on the overall
condition of the patient and the severity of the diuresis. At the minimum,
the basic serum and urine chemistries should be ordered once the diag-
nosis of POD is suspected or if a patient has the previously mentioned
high risk factors for the condition. From the results of serum and urine
chemistries, the clinician can calculate many important characteristics
of the diuresis, which will guide management (Table 1).
Urine osmolality is an important parameter used to guide the treat-
ment of POD. The inability of the kidneys to concentrate urine is one of
the first renal functions impaired in the azotemic patient because of the
pathophysiologic mechanisms described earlier. A simple way to esti-
mate urine osmolality while waiting for this value to be automated is
through urine specific gravity. It is important to note that the more
consecutive readings taken of the urine osmolality and specific gravity,
the more accurate the data regarding POD. If the specific gravity is
1.010, this is consistent with a urine osmolality of 300 mosM/L and thus
the urine is iso-osmotic with serum. This indicates that the kidneys are
unable to or do not need to maximally concentrate the urine, and an iso-
osmotic diuresis is in progress. This most commonly represents physi-
ologic POD, which is a self-limiting process of excreting retained solutes
and water. A specific gravity of 1.020 is consistent with a higher urine
osmolality in the range of 700 to 800 mosM/L, indicating that the urine-
concentrating ability of the kidneys is intact and recovery is complete
or near complete. The presence of glycosuria (severe diabetes) and pro-
teinuria can cause a false elevation of the urine osmolality, and these
factors should be excluded before the urine is determined to be
hyperosmolar. Finally, a low specific gravity of 1.000 correlates with a
urine osmolality of 50–100 mosM/L, indicating hypo-osmolality of the
urine. This inability of the kidneys to concentrate urine should prompt
serial readings of the urine because the pathologic salt-wasting subtype
of POD most commonly is shown by hypotonic urine.
Serum osmolarity is calculated as 2 × (serum sodium) + serum glu-
cose/2.8 + BUN/18. This calculated value should be within 10 mosM/L
of the automated measured serum value. Patients with azotemia or dia-
betes may have raised serum osmolarity as the result of elevated BUN
(urea) or glucose levels, respectively. All efforts should be made to
correct these parameters as soon as possible in the face of POD. A self-
limited rise in the serum osmolarity level can sometimes be seen in the
Chapter 3 / Pathophysiology, Diagnosis, and Treatment of POD 41
41
Table 1
Calculation of Serum and Urine Parameters Used in the Evaluation of POD
Calculation Comments
Urine Osmolality Automated Urine-specific gravity correlates with the urine
osmolality.
Specific gravity of 1.000 correlates with a urine
osmolality of 50–100 mosM (low osmolality).
Serum Osmolarity 2 × (serum sodium) + serum glucose / 2.8 + BUN / 18 Normal is 280 mosM/L
FeNa (urine spot sodium) × (serum sodium)
× 100
FeNa < 1 suggests a salt-conserving condition.
(serum creatinine) × (urine creatinine) FeNa < 1 suggests a salt-wasting condition.
Creatinine Clearance (140 – age) × (kg weight)/72 × serum creatinine The value for women is that of men × 0.85.
Spot Urine Electrolytes Sodium, potassium, chloride Serial levels should be taken.
Sodium > 40 meq suggests a salt-wasting condition.
42 Gonzalez
earlier phases of POD because of retention of these respective solutes
and sodium during the obstructive process.
Fractional excretion of sodium is also an important measurement to
obtain in a patient with suspected severe POD, namely the salt-wasting
variety. It is simply calculated as:
FeNa = [Urine spot sodium × serum creatinine/
serum sodium × urine creatinine] × 100.
If the FeNa value is less than 1, this indicates that sodium is being
conserved and that the patient’s intravascular volume is depleted (dehy-
dration). If the FeNa is more than 1, this indicates that sodium is being
inappropriately lost from the kidneys. Massive sodium loss is very
serious and is consistent with the pathologic salt-wasting variety of
POD, which requires intensive monitoring and intervention.
Creatinine clearance can be performed as a rough estimate of overall
renal function and may be an adjunctive way to monitor recovery of
renal function if desired. The optimal way to calculate this value is
24-h urine collection, although this can be somewhat impractical in the
setting of POD. A simple way to calculate this value is as follows:
Men: Creatinine clearance in mL/min = (140 – age) × (kg weight) /
72 × serum creatinine
Women: Absolute value calculated in men × 0.85
Spot urine electrolyte levels also provide valuable information, but
variations can be seen with isolated values. Much like urine osmolality
and the fractional excretion of sodium, the more consecutive spot
urine electrolyte readings taken over a set period of time, the more
indicative these values are of the underlying condition. Generally a spot
urine sodium level more than 40 meq/L during prolonged POD indicates
sodium wasting that is most likely associated with tubular injury and the
inability to appropriately absorb this solute. A spot urine potassium
level more than 20 meq/L and chloride level more than 20 meq/L also
indicates the inability to reabsorb these solutes and the corresponding
presence of tubular injury. If large amounts of solutes continue to be
excreted, serum levels of the corresponding solutes should be checked
every 4 to 8 h and replaced as needed.
Radiologic imaging after relief of obstructive uropathy associated
with azotemia generally includes a renal and bladder ultrasound. In the
presence of azotemia, bilateral hydronephrosis is generally seen, and
this finding warrants a repeat ultrasound within the next several days to
ensure resolution of the obstruction. If azotemia does not improve after
48 to 72 h, further imaging should be obtained to ensure complete relief