AGRICULTURAL NONPOINT SOURCE POLLUTION: Watershed Management and Hydrology - Chapter 3 ppt
Bạn đang xem bản rút gọn của tài liệu. Xem và tải ngay bản đầy đủ của tài liệu tại đây (1.67 MB, 31 trang )
3
Nitrogen and Water
Quality
William F. Ritter and Lars Bergstrom
TABLE OF CONTENTS
3.1
3.2
3.3
3.4
3.5
3.6
3.7
3.8
The Nitrogen Cycle
3.1.1 Mineralization and Immobilization
3.1.2 Plant N Uptake
3.1.3 Leaching and Surface Runoff
3.1.4 Ammonia Volatilization and Denitrification
Sources of Groundwater Contamination
3.2.1 Fertilizers
3.2.2 Livestock Wastes
3.2.3 Land Application of Manures, Sludges, and Wastewater
Sources of Surface Water Contamination
3.3.1 Fertilizers
3.3.2 Animal Wastes
3.3.3 Land Application of Manures and Sludges
Groundwater-Surface Water Interactions
Riparian Zone Processes
Effect of Tillage On Fate And Transport of Nitrogen
3.6.1 Surface Water
3.6.2 Groundwater
Whole Farm Nitrogen Budgets
Nitrogen and Water Management Practices to Reduce Nonpont Source
Pollution
3.8.1 Nitrogen Management Practices
3.8.1.1 Accounting For All Sources
3.8.1.2 Realistic Yield Goals
3.8.1.3 Amounts of Nitrogen To Apply
3.8.1.4 Timing of Application
3.8.1.5 Calibration of Equipment
3.8.1.6 Early Season Soil And Plant Nitrate Tests
3.8.1.7 Nitrification Inhibitors
3.8.1.8 Leaf Chlorophyll Meters
© 2001 by CRC Press LLC
3.8.1.9 Cover Crops
Water Management
3.8.2.1 Irrigation Method
3.8.2.2. Drainage Volume
3.8.2.3 Irrigation Scheduling
3.9 Summary
References
3.8.2
3.1 THE NITROGEN CYCLE
Nitrogen is one of the major nutrients for all living organisms and one of the most
important factors limiting crop yield. Therefore, considerable research efforts have
been undertaken over the years, trying to elucidate all the processes controlling N
cycling in various ecosystems. The biogeochemical N cycle is very complex because
N can occur in many valance states depending on redox potential. Certain processes
occur only aerobically and others only anaerobically, regulated to a large extent
by microbial processes occurring in a complex soil structure under nonsteady-state
conditions.
Because of its importance for crop yields, high amounts of N are usually given
to soils in agricultural production systems in North America and western Europe.
This has led to considerable environmental problems, such as eutrophication of
inland and coastal waters and potential depletion of the ozone layer in the stratosphere. Along with these problems, many diverse agricultural practices have been
developed, all with the main goal to reduce harmful emissions of N to a minimum.
For such practices to be successful, we need to understand not only the N transformation processes but also the interactions among the various components of the
N cycle.
3.1.1 MINERALIZATION AND IMMOBILIZATION
Nitrogen mineralization is the process through which organically bound N, which is
the major N constituent in terrestrial systems, is converted to ammonium nitrogen
(NH4-N). This process is mainly carried out by microorganisms. The subsequent fate
of NH4-N in soil depends on several biotic and abiotic factors and processes that compete for available NH4-N (e.g., nitrification and plant uptake). This ongoing competition usually results in very low NH4-N levels in cropped agricultural soils. Indeed,
in many cases NH4-N concentrations are below 5 mg N/kg soil, even though mineralization rates are quite high.1
The carbon/nitrogen ratio of a substrate added to the soil compared with that of
the decomposing microorganisms is determining whether N will be mineralized or
immobilized. The switch between net immobilization and mineralization of N is
about 15 in well-balanced arable soils.2 If the substrate has a lower C/N ratio, excess
N will be available and NH4-N will be released. Because of the low N concentration
in most undecomposed plant litter, net mineralization (the difference between mineralization and immobilization of N) occurs mainly from soil organic matter. As
© 2001 by CRC Press LLC
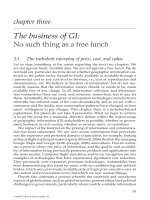
FIGURE 3.1. Nitrogen cycle
© 2001 by CRC Press LLC
decomposition of fresh organic material proceeds, N is concentrated into microbial
biomass and secondary decomposition products, and carbon is mineralized to CO2.
Release of NH4-N from microorganisms results from catabolism of nitrogeneous
substrates such as amino acids when these are assimilated in excess of growth
demands.3
However, large differences exist in plant litter C/N ratios between different
species and also between different parts of the same species. For example, in mixed
pastures of grasses and legumes, it is usually the legume leaf litter with a lower C/N
ratio than the above-ground grass residues that contributes to net N mineralization
during decomposition.4 Therefore, introduction of N-fixing legumes will not only
provide an atmospheric N input to the system but also reduce immobilization of N
and hence improve the general soil fertility.5 On the other hand, although legume leaf
litter mostly has a more favorable C/N ratio than leaf litter of grass, their roots have
commonly less favorable C/N ratios for mineralization, leading to higher immobilization of N than expected for grass roots. Also, senescent leaves of some grain
legumes, such as soybean, can have sufficiently small N contents that N is immobilized when added to soil.6
Whether net mineralization will occur or not cannot be judged based only on
knowledge about the C/N ratio of a substrate. Indeed, the C/N ratio is merely an
approximation of the energy/N ratio, which is important to keep in mind.2 The assimilation efficiency of the heterotrophic microorganisms responsible for mineralization
is also dependent on other quality parameters. Some of the C and N consitutents of
the substrate undergoing decomposition, such as nitrogen-free lignins and polyphenols, are not readily available to microorganisms and are therefore not easily mineralized. These microorganisms can also affect immobilization, such that plant materials
containing a large proportion of lignins (for example) will not cause any substantial
net immobilization of N, even though they have a relatively high C/N ratio.
Soil animals also play a major role in regulating N mineralization and can be of
direct importance by excreting NH4-N.7 In this respect, microbial feeders protozoa
and nematodes have been shown to be especially important.8 Their relatively low biomass C/N ratio, which is similar to those of microorganisms, results in liberation of
NH4-N as they are grazing on the microbes. This pattern is influenced by the presence
of roots because rich root exudates stimulates growth of bacteria that are subsequently consumed by the microbial feeders such as protozoa.9 When digesting the
bacteria, the protozoa release some of the bacterial N as NH4-N on the root surface,
where it can be taken up by the root.10 Also, nematodes can mineralize substantial
amounts of N that can be used by plants. Anderson et al.7 estimated this mineralization to be 14–124 kg N/ha/yr under field conditions.
3.1.2 PLANT N UPTAKE
Through photosynthesis, green plants convert the energy provided by sunlight into
chemical energy. By doing this, plants play a key role in most ecosystems, being the
main suppliers of energy to heterotrophic soil organisms. Also, plants and their
residues are fundamental sources and sinks of nutrients.11
© 2001 by CRC Press LLC
Considering nutrient demands by plants, N is clearly one of the most critical of
all essential elements in its effect on growth. Olson & Kurtz12 summarized the major
roles of N in plant growth as follows: (1) component of the chlorophyll molecule; (2)
component of amino acids, and therefore essential for protein synthesis; (3) essential
for carbohydrate utilization; (4) component of enzymes; (5) stimulative to root development and activity; and (6) supportive to uptake of other nutrients.
Before N can be taken up by plants, it must be transported to the surfaces of roots
for absorption. This movement normally occurs by convective flow of water in response
to transpiration of a growing crop. When the potential uptake exceeds the N supplied
by such mass flow, the N concentration near the root surface drops and movement by
diffusion begins. Plants can take up N from the soil solution either in the form of NO3
or NH4-N; although, because of chemical and biological processes occurring in the root
zone of well-drained agricultural soils and the dominance of mass flow, NO3 is usually
more prevalent and therefore taken up in larger amounts. However, when both ion
species are abundantly present in the soil solution, assimilation of NO3 into organic N
is usually retarded and NH4-N is then preferentially used.13 Also, early in the growing
season, when low soil temperatures limit nitrification rates, it appears as if many crops
favor uptake of NH4-N as an adaptation to the prevailing conditions.12
After being taken up by plants, N undergoes certain transformations before it can
be used. In terms of NO3, the initial step is reduction to NO2, which is subsequently
reduced to NH3. The reductions are catalyzed by NO3 and NO2 reductase in the
respective transformation, of which the first process (the reduction of NO3 to NO2) is
the rate limiting step. Accordingly, the activity of NO3 reductase is often considered
as a good indicator of crop growth rates.14 The level of nitrate reductase in plant tissues shows a considerable variation over time—over the short term as well as over a
growing season.15 Failure to produce NO3 reductase can be caused by several factors,
of which reduced light intensity, soil moisture stress, and other nutrient deficiencies
in the plant are some of the most important.16 The result of such adverse effects can
be problems with lodging, winter hardiness, and accumulation of high amounts of
NO3 in leafy parts of plants that potentially could lead to nitrate poisoning of cattle
grazing feeds. In contrast, NH3 seldom accumulates in plants but is readily metabolized and incorporated into amino acids and proteins.16
The total amounts of N taken up by plants vary considerably depending on the
type of crop and also between different genotypes of the same species. There is also
substantial variation in crop N-uptake depending on soil type, climate, and other
environmental conditions. Overall, however, there is no doubt that N uptake by plants
in most cases represents the largest N sink in croplands, of which a substantial portion is normally exported from the field. For agricultural crops, the harvested portion
of the total N uptake is clearly higher than 50%. For some crops (e.g., wheat and soybeans), it may be as high as 75%.12
3.1.3 LEACHING AND SURFACE RUNOFF
Leaching and runoff of N to surface waters and groundwaters have gained increasing
attention during the last few decades. This is attributed to both the negative effects on
© 2001 by CRC Press LLC
rivers, lakes, and coastal waters and to deteriorating drinking water quality.
Accordingly, much emphasis has been put on finding counter measures to reduce
such losses to acceptable levels.
The overwhelming part of N leaching through agricultural soils occurs as NO3,
whereas NH4-N, as a cation, is mostly adsorbed to the net negatively charged soil
matrix. In clay soils, NH4-N may also be fixed between the layers of 2:1 type clay
minerals, such as the vermiculites,17 which considerably reduce mobility and availability of NH4-N to plants. In sandy soils, however, in which adsorption affinity is
much less than in clay soils and pH is usually lower (nitrification is thereby reduced),
leaching of NH4-N may constitute a significant part of the total N that is leached.
Two prerequisites have to be met before any notable leaching takes place. First,
the NO3 levels in the soil solution have to be sufficiently high, and second, the downward movement of water has to be enough to displace the available NO3 below the
rooting depth of plants. The first criterion is met in most agricultural soils, except during the growing season when crop uptake of N is high. The second condition is most
commonly met in soils of humid and subhumid zones, where precipitation clearly
exceeds evopotranspiration. In such areas, considerable amounts of NO3 may leach
through soil after the growing season, depending on soil type, amounts of fertilizer
used, hydrogeologic conditions, and management practices.19 In terms of soil type,
sandy soils are usually considered to be more susceptible to NO3 leaching than clay
soils, mainly because of their smaller water-retaining capacity.20, 21 In some cases,
leaching losses in clay soils may certainly also exceed those in sandy soils exposed
to similar condition (i.e., if preferential flow processes in the clay rapidly move newly
applied NO3 to deeper soil layers beyond reach of plant roots22). In most cases, however, nonequilibrium flow in structured soils tends to reduce NO3 leaching. This is
because NO3 is mostly mixed with and protected in the smaller pores of the soil
matrix, and water flowing through macropores does not interact with the soil
matrix.23 In addition to soil type, hydrogeologic conditions that determine the net vertical pressure gradient in the groundwater flow, and climate are factors that have a
major influence on NO3 leaching and groundwater contamination, although they are
more or less impossible to control. In contrast, fertilizer type and intensity and management strategies (e.g., tillage practices and use of cover crops) can be altered or
refined, which can reduce leaching of N considerably.24–26
In addition to leaching, N can also reach rivers and lakes through surface runoff
if precipitation exceeds the infiltration capacity of a soil. Accordingly, this type of
loss mechanism is strongly coupled to rainfall intensity and the hydraulic properties
of a soil, and certainly also to factors such as topography and degree of soil cover. In
total for the U.S., it has been estimated that about 4.5 x 10⁹ kg N is lost yearly by soil
erosion,27 which is compatible with estimates of N leaching. Little of this N is in soluble form. The overwhelming part is in organic form, which is ultimately deposited
in freshwater and marine sediments, with small chances of being recycled into agricultural systems.27
Because of the great importance of the amount and intensity of rainfall to trigger
surface runoff, problems with this loss mechanism are especially widespread in the
tropics. However, runoff problems in these regions are associated more with high soil
loss rates than losses of N.28 Also, in cold climates, surface runoff related to snowmelt
© 2001 by CRC Press LLC
may cause substantial soil erosion and losses of N. For example, Nicholaichuk &
Read29 estimated runoff losses of N to be about 10 kg N/ha/yr after fallow in
Saskatchewan, primarily due to intensive snowmelt.
As for NO3 leaching, several management practices have been developed with
great potential of reducing N losses in surface runoff. The importance of ground
cover in N transport by surface runoff was shown by Burwell et al.30 In a study on a
loamy soil in Minnesota, they found that runoff losses could be reduced from 23.8 to
3.3 kg N/ha by switching from continuous corn to hay in rotation. For fields on steep
slopes, large runoff reductions could be obtained by tillage practices against the slope
(contouring and terracing and combinations thereof).31 Measures that protect soil
against direct raindrop impact, such as cropping systems with multicanopy structure,
can also significantly decrease runoff losses of N.32
3.1.4 AMMONIA VOLATILIZATION AND DENITRIFICATION
The most important N compounds lost as gases from agricultural cropping systems
are ammonia (NH3), nitrous oxide (N2O), nitrogen oxide (NO), nitrogen dioxide
(NO2), and diatomic nitrogen (N2).
Ammonia volatilization to the atmosphere is a complex process controlled by a
combination of biological, chemical, and physical factors.33 Examples of such factors are the balance between NH4-N and NH3, which is affected by pH among other
things; presence or absence of plants; wind speed; and NH3 concentration in the air
space adjacent to the soil surface. The main source of NH3 volatilization from agriculture is excreta from animals. Indeed, an average of 50% of the N excreted by farm
animals kept in intensive agriculture is released to the atmosphere directly from animal barns during storage, during grazing, and after application of manure to soil.34
However, substantial amounts of NH3 emitted to the atmosphere also originate from
microbial decomposition of amino acids and proteins in dead plant residues, soil
fauna, and microorganisms. It has been estimated that about 90% of all NH3
volatilization in western Europe originates from agriculture and, therefore, less
than 10% from other sources.34 This corresponds to about 11 and 1 kg N/ha/yr. Near
large animal farms, however, considerably larger emissions may occur, reaching
toxic levels for the surrounding vegetation. An NH3 source of increasing importance
during recent years is composting of source-separated household wastes. During
such composting, 20–70% of the total N initially present in the wastes is typically
34
lost as NH3 .
Because emitted NH3 is highly water soluble, it will be washed out by clouds and
return to the soil surface with precipitation; it will also be deposited as dry deposition
near the source. Because NH3 is a basic compound in the atmosphere, it will form
salts with acidic gases that can be transported long distances, especially in the
absence of clouds. The most direct environmental consequence of large NH3 depositions is its contribution to eutrophication of freshwater and marine ecosystems. This
eutrophication may lead to decreased biological diversity and also to increased carbon storage in sediments and forest soils, which, over the long term, will likely affect
the global carbon budget. Also, NH3 deposition contributes to acidification of soils if
nitrified and leached.
© 2001 by CRC Press LLC
Denitrification, which is the other major source of N loss to the atmosphere, is
the process whereby NO3 and NO2 are reduced to gaseous forms of N (NO, N2O,
and N2). Biological denitrification is usually performed under anaerobic
conditions by a heterogeneous group of bacteria, including both autotrophs and heterotrophs. The energy generated by using NO3 as a terminal electron acceptor is
almost compatible with that released during aerobic respiration and much more than
the regular fermentative pathways. In general, the main end products in the denitrification process are N2O and N2, whereas NO is usually quantitatively of less importance. If O2 concentrations increase, the ratio between N2O and N2 also increase,
whereas NH4-N concentrations do not affect production of either of these constituents.
In addition of being responsible for losses of an essential nutrient often limiting
plant growth, denitrifying bacteria contribute to regulation of N2O concentrations in
the atmosphere. Nitrous oxide entering the stratosphere is involved in catalytic reactions where ozone is consumer.35 Several studies have shown that this depletion may
have increased during the last decades as a result of elevated atmospheric N2O levels
resulting from enhanced N-fertilization rates.36 In a recent global assessment, the
average yearly N2O emission from fertilizers was estimated to be 1 kg N/ha ϩ 1.25
Ϯ 1% of the fertilizer N applied.37 Still, the atmospheric concentration of N2O is quite
small compared with, for example, CO2; although its contribution to the “greenhouse
effect” is considerable, mainly because of the long residence time and high relative
absorption capacity of N2O per mass unit.
3.2 SOURCES OF GROUNDWATER CONTAMINATION
3.2.1 FERTILIZERS
More intensive farming methods have led to higher rates of fertilization. A rapid
increase in N fertilizer use occurred during the 1960s and 1970s. In 1980, U.S. farmers used 11,300,000 mg of N fertilizer, whereas 6,800,000 mg were used in 1970
and only 2,400,000 mg in 1960.38 In 1997, 13,900,000 mg were used.39, 40 During the
1980s, groundwater contamination became a national concern. Irrigated area have
also increased gradually over the last 25 years. In 1974, the irrigated cropland area in
41
the U.S. was 14,180,000 ha, and in 1998 it was 25,296,000 ha. In the past, the main
interest in N management and irrigation was related to agronomic and economic factors, but in the past 15 years, NO3 leaching under irrigation has become a major environmental concern.
42
Madison and Brunett did the first comprehensive nationwide mapping of area
distribution of NO3 in groundwater. They used 25 years of records of more than
87,000 wells from the U.S. Geological Survey’s Water Storage and Retrieval System
(WATSFORE). Nitrate concentration exceeded 3 mg N/L in agricultural areas of
Maine, Delaware, Pennsylvania, central Minnesota, Wisconsin, western and northern
Iowa, the plains states of Texas, Oklahoma, Kansas, Nebraska, and South Dakota,
eastern Colorado, southeastern Washington, Arizona, and central and southern
43
California. Lee and Nielsen used Madison’s and Burnett’s data together with N
© 2001 by CRC Press LLC
fertilizer usage and aquifer vulnerability. They eliminated areas with elevated NO3
concentrations in northern Maine and added areas in Ohio, Indiana, and Illinois when
WATSFORE data were sparse. The studies of Madison and Brunitee42 and Lee and
Nielson43 indicated there is a higher occurrence and prediction of NO3 in groundwater
in the central and western U.S. than other parts of the country.
There have been a number of comprehensive statewide surveys of NO3 in
groundwater. A study in Texas of 55,495 wells indicated some NO3 contamination.44
However, only 8.2% of the wells had NO3 concentrations above 10 mg N/L. Spalding
and Exner45 concluded, after reviewing the North Carolina survey and other studies
in the Southeast, that high temperatures and abundant rainfall and the relatively highorganic-content soils in the Piedmont Plateau and Coastal Plain of the southeastern
U.S. promote denitrification below the root zone and therefore, naturally remediate
NO3 loading of the groundwater. Baker et al.46 found in a statewide survey in Ohio of
14,478 domestic wells that only 2.7% exceeded the EPA drinking water of 10 mg N/L
for NO3 and only 12.7% of the wells exceeded 3.0 mg N/L. The average concentration was 1.3 mg N/L. In their review, Spalding and Exner45 concluded most leachate
was intercepted by tile drainage and never reached the groundwater.
A statistic-based statewide rural well survey in Iowa showed that the regional
distribution of NO3 concentrations above 10 mg N/L was not uniform and skewed.48
The highest incidents of contamination were in the glaciated areas of southwestern
and northwestern Iowa, where 31.4 and 38.2%, respectively, of all the wells were
above 10 mg N/L. In northcentral Iowa, only 5.8% of the wells had NO3 concentrations above 10 mg N/L. The major difference between the high and low contamination areas was related to well construction and well depth.
Halberg48 has reported decreasing NO3 concentrations with increasing depth in
Iowa aquifers. Intensive irrigation has caused high NO3 levels in groundwater in certain areas. Exner and Spaling found the NO3 concentrations exceeded 10 mg N/L in
20% of 5826 sampled between 1984 and 1988 in Nebraska. Slightly more than half
of the wells with NO3 concentrations above 10 mg N/L were in areas highly vulnerable to leaching. These areas are characterized by fence-row-to-fence-row irrigated
corn grown on well- to excessively well-drained soils and a vadose zone less than 15
m thick in the Central Platte region.
California has the most irrigated cropland and a history of high NO3 concentrations in groundwater beneath intensively farmed and irrigated basins in central and
southern California.50 Keeney,51 in reviewing data from a number of studies in
California, concluded that the NO3 levels in groundwater under normal irrigated
cropland in general will range from 25 to 30 mg N/L. Only when N application rates
exceed those that are efficiently used by crops does the leaching of N become excessive. For many crops, with good agronomic practices and profitable production,
about 20 mg N/L of NO3 in drainage effluents may be the best achievable.
Devitt et al.52 measured annual NO3 losses that ranged from 23 to 155 kg N/ha/yr
on six irrigation sites with tile drainage in southern California. On sites where a low
leaching fraction was used, NO3 concentrations in the tile effluent were higher than
on sites with a high leaching volume. However, higher mass amounts of NO3 were
lost under irrigation management where a high leaching volume was used.
© 2001 by CRC Press LLC
In the Sand Plain Aquifer region of Minnesota, where 20% of the wells had NO3
concentrations above 10 mg N/L, nearly 50% of the wells had NO3 concentrations
above 10 mg N/L in the irrigated cropland area.53 Concentrations averaged 17 mg
N/L in the irrigated area and 5.4 mg N/L in the nonirrigated cropland area.
In 1991, the USGS initiated the National Water Quality Assessment (NAWQA)
Program in 20 areas and phased in work in more than 30 additional areas in 1997.54
Results from the first 20 areas have been summarized. Concentrations of NO3
exceeded 10 mg N/L in 15% of the samples collected in shallow groundwater beneath
agricultural and urban areas. Concentrations of NO3 in 33 major drinking water
aquifers were generally lower than those in the shallow groundwater. Four of the 33
major drinking water aquifers had NO3 concentrations above 10 mg N/L in 15% or
more of the samples. All four of the aquifers were relatively shallow in agricultural
areas, and were composed of sand and gravel that is vulnerable to contamination by
application of fertilizers. Nitrate concentrations in the shallow groundwaters in the
Central Columbia Plateau study area of Washington were among the highest of the
20 study areas. The highest NO3 concentrations occurred where fertilizer use and irrigation were greatest.
3.2.2 LIVESTOCK WASTES
Nitrate contamination of groundwater can occur as a result of seepage from manure
storage basins and lagoons, dead animal disposal pits, stockpiled manure, and livestock feedlots. Reese and Louden55 conducted a literature review on seepage from
earthen livestock waste storage basins and lagoons on data from 1970 to 1982. They
concluded natural sealing takes place that results in very low seepage rates occurring
in earthen manure storage basins and lagoons. Initially, this seal takes time to
develop, which could result in a shock load of pollutants moving down and reaching
groundwater. There is also the possibility of initial seal breakage because of drying,
and the potential for another shock load upon refilling a manure basin after cleanout.
Ritter and Chirnside56 concluded that seals may break and cause serious groundwater
contamination. They found a swine waste lagoon with a clay liner that was pumped
dry twice a year and had NH4-N concentrations above 1,000 mg N/L in the shallow
monitoring wells around the lagoon.
Westerman et al.57 found that seepage from old unlined lagoons in North
Carolina was much higher than previously believed. Two swine lagoons that received
swine waste for 3.5 to 5 years had high NO3 and NH4-N concentrations in the shallow groundwater. In a follow-up study, Huffman58 evaluated 34 swine lagoons for
impacts for seepage. About two-thirds of the sites had NO3 concentrations above 10
mg N/L at 38 m down gradient in the shallow groundwater.
Several researchers have found that livestock feedlot soil profiles develop a biological seal similar to earthen manure storage basins and lagoons.59, 60 The feedlot
usually contains a compacted interfacial layer of manure and soil that provides a biological seal that reduces water infiltrations to less than 0.05 mm/hr. Norstadt and
Duke59 measured soil NO3 levels that decreased from 80 mg N/kg at the top of feedlot soil profiles to less than 10 mg N/kg at the 1.0 to 1.5 m depth.
© 2001 by CRC Press LLC
On the Delmarva Peninsula and in the southeastern U.S., where broiler production is concentrated, dead birds are most often disposed of on the farm. In the past,
many farms used disposal pits that could be a source of groundwater contamination.
Today, many farms use composting for dead bird disposal but some still use disposal
pits. Most of the disposal pits do not have lined floors. Hatzell61 found the median
NO3 concentration increased by 2.0 mg N/L in the vicinity of a dead bird disposal pit
relative to two wells upgradient of the pit in northcentral Florida. Ritter et al.62 measured NO3 and NH4-N concentrations in groundwater around six disposal pits on
Coastal Plain soils in Delaware. Elevated NH4-N concentrations were detected in the
groundwater at three of the six disposal pits. Ammonium nitrogen concentrations as
high as 366 mg N/L were measured. Average NO3 concentrations ranged from 0.46
to 18.3 mg N/L, with three of the disposal pits having NO3 concentrations above 20
mg N/L. Disposal pits used on the Delmarva Peninsula are old metal feed bins with
the bottoms cut out. Many of these pits are partially in the groundwater because of
the high groundwater table in many parts of the Delmarva Peninsula.
Recent research has shown that old poultry houses themselves may be
causing groundwater contamination. Ritter et al.63 investigated N movement under 12
poultry houses constructed from 1959 to 1985. Total mass of NH4-N in the top
150 cm of the soil profile varied from 3420 to 12,580 kg N/ha, and the NO3
concentrations in the groundwater around a set of two poultry houses was 45.5 mg
N/L in northcentral Florida. Lomax et al.64 sampled 30 broiler houses with house
floor types, caterorized as loose soil, compacted (hard) soil, and concrete. They took
borings to a depth of 150 cm in the spring and fall in each house. The loose, compacted, and concrete floor types had average total kjeldahl nitrogen (TKN) concentrations of 1063, 1077, and 213 mg N/kg, NH4-N concentrations of 404, 460, and 24
mg N/kg and NO3 concentrations of 245, 263, and 14 mg/N/kg, respectively. These
studies clearly indicate that poultry houses with dirt floors may be a source of
groundwater contamination.
3.2.3 LAND APPLICATION OF MANURES, SLUDGES, AND
WASTEWATER
Excessive applications of manures or sludges may cause NO3 contamination of groundwater. Land application of wastewater has been used in the food processing industry for
years, and over the past 20 years has become a more popular method of disposal of
municipal wastewater. Nitrogen is the limiting design parameter in many cases. Today
approximately 55% of the sludge generated in the U.S. is applied to land or used as a
soil amendment.65 Other forms of solid waste are also used as soil amendments.
Overapplication of poultry litter has been shown to cause elevated levels of NO3
in soil solution and groundwater.66 Adams et al.67 evaluated NO3 leaching in soils
fertilized with both poultry litter and hen manure at 0, 10, and 20 mg/ha. They found
that the amount of NO3 leaching into the groundwater was a function of litter application rate.
Liquid swine and dairy manure are commonly applied to forage crops in the
southeastern U.S. Vellidis et al.68 evaluated the environmentally and economically
© 2001 by CRC Press LLC
sustainable liquid dairy manure application rates on a year-round forage production
system on a loamy sand Coastal Plain soil in Georgia. Nitrate concentrations
increased in the soil solution at 1.5 and 2.0 m depths at application rates of 600 and
800 kg N/ha, remained relatively unchanged under the 400 kg N/ha rate, and
decreased at an application rate of 250 kg N/ha.
Westerman et al.69 found applying swine lagoon effluent at a rate of 450 kg N/ha
of available N was too high for coastal bermuda grass in a sandy soil with a high
water table and caused increased NO3 concentrations in the groundwater. Hubbard et
al.70 found NO3 concentrations exceeded drinking water standards on a Georgia
Coastal Plain plinthic soil when dairy manure was applied to coastal bermuda grass
at rates of 44 and 91 kg N/ha per month. It appears an annual application rate of 400
kg N/ha to coastal bermuda grass is the maximum application rate that should be
used. Other forage systems would probably use less N and should have lower manure
application rates. Stone et al.71 indicated, from reviewing a number of research studies that groundwater in swine manure spray fields often has NO3 concentrations
above 20 mg N/L, whereas most row crop studies have NO3 concentrations below 20
mg N/L and pastures have NO3 concentrations below 5 mg N/L.
Nitrate contamination of groundwater from land application of municipal effluents and sewage sludges can be controlled to a great extent because their application
is regulated in the U.S. Irrigation of crops with treated effluent has not been regulated
at the federal level but is regulated at the state level. Land application of sludges was
not regulated at the federal level until the EPA promulgated “Standards of the Use and
Disposal of Sewage Sludge” in 1993.72 Regulations do not allow wastewater or
sludges to be applied at greater than agronomic N rates of the crop.
Research has shown that excessive sludge application rates will contaminate
groundwater. Higgins73 found that the upper rate of sludge application to corn on a
Sassafras sandy loam soil to protect groundwater was 22.4 mg of dry solids/ha.
Chang et al.74 found that large concentrations of NO3 accumulated in profiles of
sludge-treated soils when rates of sludge application exceed crop requirements for N.
Greater than optimum rates of sludge addition increased NO3 leaching from course
and fine loamy soils as linear functions of increasing total N inputs. Other researchers
have also found NO3 leaching is a linear function of sludge application rates above
crop N requirements on sandy soils, but occurred only above a certain threshold on
clay soils.75
One of the problems in estimating sludge application rates is in determining the
mineralization rates of organic N. Typically treated sludges contain from 1 to 6% N
on a dry-weight basis, with a large portion being in the organic form in some sludges.
The rate of mineralization of sludge-borne organic N in soil ranges from a high of
essentially 100% per year to a low of a few percent during the initial year of application. Nitrogen not mineralized the first cropping year is mineralized in subsequent
years but usually at diminishing rates. Laboratory incubation studies of the N release
characteristics of sewage sludge mixed with soil have proven useful in developing
sludge application rates. For example, the mineralizable N content of anaerobically
digested sludge during the year of application has been estimated at 15% of the
organic N fraction by this approach.76 Based upon reported N availabilities, the
© 2001 by CRC Press LLC
decreasing potential risk of NO3 leaching from various types of sewage sludge the
first year after application is liquid, digested Ͼ dewatered, digested Ͼ liquid, undigested Ͼ dewatered, undigested.
Applying liquid manure to fields with tile drainage may have an increased
impact on tile effluent water quality. Dean and Foran77 found high concentrations of
bacteria and N and P in tile drainage discharge when rainfall occurred shortly before
or shortly after manure spreading. In a study in southwestern Ontario on a Brookston
clay loam soil, McLellan et al.78 found tile discharge NH4-N concentrations increased
from 0.2 to 0.3 mg N/L before spreading to a peak of 53 mg N/L shortly after manure
was spread. Land application of liquid manure did not increase NO3 concentrations
in the tile effluent. Blocking the drains to simulate controlled drainage decreased
NH4–N and bacteria concentrations.
3.3 SOURCES OF SURFACE WATER CONTAMINATION
3.3.1 FERTILIZERS
In the U.S. Geological Survey NAWQA study, the estimated background total N concentrations in streams from 28 watersheds in 20 study units was 1.0 mg N/L.54
Average annual concentrations of total N in about 50% of agricultural streams ranks
among the highest of all streams sampled in the 20 study units. In these streams, total
N was about 2.9 mg N/L. Total N input from fertilizer, manure, and atmospheric
sources was generally above 56 kg N/ha for the county.
One of the major sources of N input to surface water in the Corn Belt is through
subsurface drainage discharge. Zucker and Brown79 reviewed water quality impacts
and subsurface drainage in the Midwest. Water quality and agricultural drainage are
discussed in detail in Chapter 8.
Field studies have shown that N losses in surface runoff are correlated with fertilizer rates. In Georgia, TKN concentrations in surface runoff from watersheds
cropped were related to N application rate.80 Fields fertilized at the recommended rate
did not contribute large quantities of N in runoff. Corn Belt research indicated N
application rates greater than 168–196 kg N/ha for corn increased N runoff losses but
did not significantly improve yields.81 In another study, N fertilizer applied at a rate
of 448 kg/ha/yr had annual losses of 50.2 kg/ha total N in surface runoff and an application rate of 174 kg/ha/yr had annual losses of 28.1 kg/ha.82
Methods of fertilizer application and farm management practices can significantly affect N losses in surface runoff. Research in the Corn Belt demonstrate conclusively that most of the total N lost in surface runoff is associated with sediment
losses.83 Therefore, sediment control practices should effectively reduce total N
losses in surface runoff. Kissel et al.84 also concluded that controlling sediment losses
and following soil test results for proper fertilizer application rates can reduce N
losses in the southwestern prairies.
In simulated rainfall studies in Minnesota,85 it was shown that fertilization
methods can be varied to control N losses in surface runoff. Greatest N losses came
from plots upon which fertilizer was broadcast on a disked surface and the lowest
© 2001 by CRC Press LLC
losses were with fertilizer broadcast onto a plowed surface. Corn, forage, small grain,
and soybean growers in New York are advised to band and sidedress fertilizer to best
meet economic and water quality objectives.86
3.3.2 ANIMAL WASTES
The major potential pollution source of N from animal wastes in addition to land application of manure is from feedlot runoff. Both the volume and pollution concentration
of feedlot runoff are highly variable. Precipitation is more important than either slope
or stocking rate in determining feedlot runoff rates. In a study in South Dakota at six
locations, the annual N loss varied from 0.1 to 6.6% of the total N in the manure.87
More N is usually lost through N volitalization than runoff. Bierman88 estimated 53 to
63% of the N voided was lost by volitalization, whereas runoff loss of N was only 5%
for normal fiber diets, 7% for high-fiber diets, and 21% for low-fiber diets.
Westerman and Overcash89 measured N concentrations from an open dairy lot in
North Carolina. Nitrogen concentrations were lower than data reported for beef
feedlots. In the same study, runoff N concentrations from the lot were 4 to 6 times
higher than from a pasture that received 1 cm of dairy lagoon water every other week
by irrigation.
3.3.3 LAND APPLICATION OF MANURES AND SLUDGES
In the U.S., sludge application sites require permits, so runoff on these sites should
be controlled through regulations. Many swine, dairy, and poultry layer operations in
the southeastern U.S. use liquid waste management systems that include a lagoon and
land application of the lagoon water by irrigation. Bermuda grass and tall fescue are
used on many of the land application sites. Nitrogen application rates of 400 to 600
kg/ha may be used.69 With such high N application rates, there is the potential for surface runoff losses of N. Westerman et al.90 applied swine manure slurry at a rate of
670 kg N/ha/yr and swine lagoon effluent to supply 600 and 1200 kg N/ha/yr for four
years to tall fescue on a Cecil silt loan soil and compared these rates with 201 kg/
N/ha/hr of commercial fertilizer. They concluded both surface-water and groundwater contamination can occur by applying manure and effluent at these high rates.
Pollution by runoff was more likely when rainfall occurred soon after manure
application.
Many dairy farmers with small herds do not have manure storage systems and
spread it daily in states like New York, Wisconsin, and Pennsylvania. By spreading
manure on frozen or snow-covered ground, there is an increased potential for surface
runoff. Hensler et al.91 reported that up to 20% of the N was lost from manure applied
to frozen, tilled soil. Young and Mutchler92 found that soil cover influenced runoff
and nutrient losses. Up to 20% of the N was carried away in the spring runoff from
manured alfalfa plots, whereas no more than 3% of the N was lost from manure
spread on fall plowed soils. Klausner et al.93 found little difference in nutrient losses
between different manure application rates when the soil was not frozen, but nutrient
losses rose with increasing rates of application when the soil was frozen. Steenhuis
et al.94 found the fate of the first melt water after spreading manure on frozen soils
© 2001 by CRC Press LLC
largely determined the fate of the total N application. If this water infiltrates, the N
losses will be small. If, however, the water runs off, the losses will be high. Thus, if
manure is spread on frozen soil covered with an ice layer or on melting snow, high N
losses can be expected.
There are concerns regarding surface water quality impacts of using poultry litter as a nutrient source. Nitrogen losses in surface runoff from litter and poultry
manure from numerous studies are summarized in Table 3.1. The interval between
manure application and rainfall affect the quality of runoff water. Westerman and
Overcash99 found that concentrations of TKN decreased by approximately 90% following a 3-day delay between application of poultry manure to fescue plots and simulated rainfall.
McLeod and Hegg95 compared water quality impacts of commercial fertilizer,
municipal sludge, dairy manure, and poultry manure applied to all fescue plots. One
day after application runoff from the plots treated with poultry manure had 40 mg
N/L TKN, 16 mg N/L NH4, and 2.5 mg N/L NO3. Simulated rainfall was used to produce runoff events at weekly intervals and after that, N concentrations decreased by
80% with increasing number of runoff events. Edwards and Daniels100 also found
highest N concentrations occurred in the first runoff event from tall fescue plots
receiving poultry litter and inorganic fertilizer and that background concentrations
(control) were approached after 2 to 5 runoff events.
Several authors have studied the effect of sludge application on the quality of
runoff water from agricultural lands. Kelling et al.101 found significant reductions
in runoff and sediment losses from sludge treated areas compared with commercial
TABLE 3.1
Nitrogen Concentrations In Runoff From Areas Receiving Poultry Waste
Location
Soil
Waste
Loading
Rate
(Mg/ha)
Total N
NH4
(mg
N/L)
NO3
(mg N/L
Reference
South Carolina
Clay
Litter
2.8–8.9
6–40
1–15
2–2.5
Maryland
Silt loam
Litter
6.4
10–35
Maryland
Silt loam
Litter
4.7–6.7
North Carolina
Clay,
sandy
loam
Clay,
sandy
loam
Sandy
loam
Litter
McLeod
et al.95
Magette
et al.96
Magette
et al.97
Westermann
et al.98
North Carolina
North Carolina
© 2001 by CRC Press LLC
—
0.5–1.4
3–7
0–0.5
—
4.1–8.2
129–165
19 –39
1.3–2.1
Manure
3.0–6.0
106–230
15 –38
0.2–0.4
Westermann
et al.98
Manure
3.3
8–132
—
—
Westerman
and
Overcash99
fertilized plots. However, NO3 losses in runoff water from sludge-treated
plots increased compared with the control plots. Dunnigan and Dick103 found that
surface application of sewage sludge resulted in increased N losses relative to
incorporated sludge. Bruggeman and Mostaghimi103 found that surface application
of sludge at a rate of 75 kg N/ha reduced runoff, sediment, and N losses
compared with plots where no sludge was applied. Sludge applications of 150 kg
N/ha increased the infiltration capacity of the soil, thereby reducing runoff but
greatly increasing N yields. A sludge application of 75 kg N/ha on no-till plots
seemed to be the best alternative for sludge disposal from a surface water quality
standpoint.
3.4 GROUNDWATER–SURFACE WATER INTERACTIONS
There are three ways that groundwater interacts with streams. Streams may gain water
from inflow of groundwater through the streambed, they lose water to groundwater by
outflow through the streambed, or they do both, gaining in some reach areas, losing in
other reaches.104 In general, this shallow groundwater that interacts with streams is
more susceptible to contamination because changing meteorological conditions
strongly affect surface water and groundwater patterns. Precipitation, rapid snowmelt,
or release of water from a reservoir upstream may cause a rapid rise in stream stage
that causes water to move from the stream into the streambanks by a process known as
bank storage (Figure 3.2). As long as the rise in stage does not overtop the strea banks,
most of the volume of stream water that enters the streambanks returns to the stream
within a few days or, in some cases, weeks. If large areas of the land surface are
flooded, widespread recharge to the water table can take place in the flood area. In this
case, the time it takes the recharged flood water to return to the stream by groundwater
flow may take weeks, months, or years. Depending upon the frequency, magnitude,
FIGURE 3.2 Bank storage in streams104
© 2001 by CRC Press LLC
and intensity of storms and on the related magnitude of increases in stream stage,
some streams and adjacent shallow aquifers may be in continuous readjustment from
interactions related to bank storage and overbank flooding.
Other processes may also affect the exchange of water between streams and adjacent shallow aquifers. Pumping can cause changes in stream flow between gaining
and losing conditions. In headwater areas, changes in stream flow between gaining
and losing conditions may be extremely variable. The headwater segments of streams
may be completely dry except during storms or during certain seasons when
snowmelt or precipitation is sufficient to maintain continuing flow for days or weeks.
During dry periods, the stream loses water to the unsaturated zone beneath its bed.
However, as the water table rises through recharge in the headwater area, the losing
reach may become a gaining reach as the water table rises above the level of the
stream.
Significant denitrification has been found to take place at locations where oxygen is absent or present at very low concentrations and where suitable electron donor
compounds, such as organic carbon, are available. Such locations include the interface of aquifers with silt- and clay-confining beds and along riparian areas adjacent
to streams. McMahon and Bohlke105 examined the effects of denitrification and mining on NO3 loadings to surface water in Nebraska’s South Platte River alluvial
aquifer, which is affected by irrigation. Denitrification and mixing between river
water and groundwater on the floodplain deposits and riverbed sediments substantially reduced NO3 concentrations between recharge area and discharge area groundwater. Denitrification accounted for about 15–30% of the apparent decrease in NO3
concentrations. Mass balance measurements indicated that discharging groundwater
accounted for about 18% of the NO3 load in the river. However, the NO3 load in discharging groundwater was about 70% less than the load that would have resulted
from the discharge of unaltered groundwater from the recharge area.
Several studies have shown that riparian zones can lower groundwater NO3 concentrations to below 2 mg/L. Martin et al.106 found that two riparian headwater stream
zones in southern Ontario removed nearly 100% of the NO3 from subsurface waters.
Magette et al.107 concluded NO3 concentrations will be diluted in the groundwater by
buffer areas of native riparian vegetation in the Chesapeake Bay watershed.
In studying surface-water and groundwater quality in a mixed land use watershed, Shirmohammadi et al.108 concluded that lateral groundwater flow plays a major
role in NO3 loadings to streams in the Piedmont physiographic region. Nutrient management becomes an important priority in upland agricultural fields to reduce these
loads. Ritter109 concluded that groundwater discharge contributed 75% of the N load
to the Delaware Inland Bays from nonpoint sources.
3.5 RIPARIAN ZONE PROCESSES
In the Atlantic coastal plain, broad coastal plains are transected by streams, scarps,
and terraces. The gentle relief and sandy well-drained soils of the coastal plain make
it ideal for agriculture. In many areas, cropland is separated from streams by riparian
© 2001 by CRC Press LLC
forests and wetlands. Evapotranspiration directly from groundwater is widespread in
the coastal terrain.104 The land surface is flat and the water table is generally close to
the land surface; therefore, many plants have root systems deep enough to transpire
groundwater at nearly the maximum potential rate. The result is that the evapotranspiration causes a significant water loss, which affects the configuration of groundwater flow systems.
Movement of nutrients from agricultural fields has been documented for the
Rhodes River watershed in Maryland.110 Application of fertilizer accounted for 69%
of the N input to the watershed and 31% from precipitation. Forty-six percent of the
N was taken up by harvested crops. Almost all of the rest of the N is transported in
groundwater and is taken up by trees in riparian forests and wetlands or is denitrified
to N gas before it reaches the stream. It was determined that less than 1% of the N
reached the stream.
Martin et al.106 found riparian zones of two streams in southern Ontario removed
almost 100% of the NO3 from subsurface waters. Attenuation was concentrated in the
leading 20–30 m of the riparian zone. Forested riparian zones depleted NO3 over a
shorter distance than grassy riparian zones. Other studies have also shown that riparian zones can lower groundwater NO3 levels below 2 mg N/L.110, 111
Nitrogen in surface runoff is removed in the riparian zones by plant uptake,
denitrification, and sediment trapping.112 Plant uptake alone may not be a permanent
removal of required N unless the plants are harvested. Annual plants will die and
release the N following decomposition. The relative importance of plant uptake and
denitrification is site-specific for a given site and season of the year. Clausen et al.113
found that neither of the two processes was important pathways for NO3 removal in
a 35-m riparian area of a field planted in corn.
3.6 EFFECT OF TILLAGE ON FATE AND TRANSPORT
OF NITROGEN
3.6.1 SURFACE WATER
Conservation tillage will reduce erosion from 50 to 90% and the amount of particulate nutrients in runoff but can increase soluble nutrient concentrations in runoff.114
The increase in soluble nutrient losses is attributed to the increase in the amount of
surface residue and decrease in fertilizer incorporation. Baker and Laflen115 showed
that surface fertilizer significantly increased NH4–N concentrations in runoff, as high
as 5% of the NH4–N applied was lost in runoff. In another study, Mickelson et al.116
found surface-applied N losses with no-tillage were 14 times higher than with incorporated fertilizer N treatment
Some studies have shown that most N losses are associated with the sediment
fraction. In evaluating six-tillage practices, Barisas et al.117 found that the sediment
fraction was the major carrier of N. In the highly erodible loessial soils in northern
Mississippi, N losses from conventional tillage soybeans were 46.4 kg N/ha and 4.7
kg N/ha from no-tillage soybeans.118 Staver et al.119 found that the greatest potential
for N transport in surface runoff from a coastal plain watershed in Maryland occurs
© 2001 by CRC Press LLC
during extreme precipitation events soon after N application. They observed very little annual difference of N surface runoff losses between conventional tillage and notillage.
In a comprehensive literature review, Baker120 concluded that, in general, conservation tillage reduces runoff and losses of N via this route. The reduction in runoff
volume has been variable between locations and years, but the average reduction with
conservation tillage is probably 20–25%. The reduction in the amount of N in surface
runoff as a result of conservation tillage has not been as great as the reduction in the
amount of sediments. There is generally higher concentrations of dissolved N in the
surface water and higher total N in the sediment. The higher average concentrations
of dissolved N is a result of most fertilizer N being applied on the surface.
3.6.2 GROUNDWATER
Many studies have shown that conservation tillage decreases runoff and increases
infiltration. Surface residues provide protection against surface sealing that results
in increased infiltration before runoff occurs on well-structured soils. Because of the
initial higher infiltration, NO3 losses in surface runoff will be low, and with
increased infiltration with conservation tillage, there is the potential for increased
NO3 leaching.
A number of studies have been conducted under different climate and soil conditions to study leaching of NO3 under different tillage systems. Kitur et al.121 found
equal N fertilizer losses under no-till and conventional tillage systems. Kanwar et
al.122 found higher NO3 leaching losses under conventional tillage systems in a rainfall simulation study. The results from that study indicated that most of the previously
applied NO3 present in the soil was bypassed by the applied water later, as it
infiltrated through the macropores under no-till systems. In another study, Kanwar et
al.123 studied the effects of no-till and conventional tillage and simple and split N
applications on the leaching of NO3 with subsurface drainage of continuous corn. No
significant effect of tillage or N management was observed during the first year of the
experiments. However, in the third year, a significant reduction of NO3 in subsurface
drainage water with no-till relative to conventional tillage was observed.
An 11-year study in Minnesota showed there was very little difference in NO3
losses between conventional tillage and no-tillage in subsurface drainage.79 Nitrate
concentrations were lower in the no-till plots, but the amount of subsurface drainage
flow was higher, so NO3 losses were approximately the same.
In Georgia, McCracken et al.124 found no consistent differences between notillage and conventional tillage in their effect on NO3 leaching and concluded the
choice of tillage method will have minor impact on groundwater quality. In another
study in western Tennessee and Kentucky, Wilson et al.125 found there was little difference in NO3 leaching rates between conventional annual tillage and no-tillage, but
cropping systems and rainfall timing had pronounced effects. Cotton was the most
susceptible crop to NO3 losses. Research by Tyler and Thomas126 in Kentucky demonstrated greater NO3 leaching with no-tillage than conventional tillage. They concluded no-tillage enhanced the preferential leaching of NO3 through macropores.
© 2001 by CRC Press LLC
3.7 WHOLE-FARM NITROGEN BUDGETS
One method of predicting NO3 leaching potential to groundwater is by calculation of
N budgets for individual farms. The N budget can be formulated so that a positive balance would indicate the amount of N potentially available for leaching. The average
amount of groundwater recharge could then be estimated to predict the mean maximum amount of NO3 leached to the groundwater. The N budget can be simplified by
assuming that soil organic matter, and consequently soil N content, remain constant on
a yearly basis on monoculture systems or on a rotation basis for crop rotation systems.
Farm N inputs need to be calculated for feed, fertilizer, and seed; nitrogen fixation; and
atmospheric deposition. Outputs need to be estimated for animal and grain products
leaving the farm along with atmospheric losses through N volatilization and denitrification. The simplified N balance approach for predicting the long-term effect of farming practices on groundwater quality has been described in detail by Fried et al.127
Sims and Vadas128 estimated the N surplus for a poultry farm in Delaware
with three poultry houses and 75 ha of cropland was 210 kg N/ha/yr. Klausner129
estimated the N surplus for a typical New York dairy farm with 120 cows and 100 ha
of cropland was 202 kg N/ha/hr. Poultry and livestock farms have much larger N
surpluses than grain farms. In applying the N budget approach to farms in Ontario,
Barry et al.130 concluded that denitrification losses were a significant component
of the N budget for grain corn and silage corn grown in southwestern Ontario. Neither
Sims and Vadas128 nor Klausner129 considered denitrification or atmospheric N inputs
in their N budget calculations. Barry et al. estimated a groundwater NO3
concentration of 6.7 mg N/L for a cash grain farm in Ontario and 58.4 mg N/L for a
dairy farm.
3.8 NITROGEN AND WATER MANAGEMENT PRACTICES
TO REDUCE NONPONT SOURCE POLLUTION
3.8.1 NITROGEN MANAGEMENT PRACTICES
3.8.1.1 Accounting For All Sources
When multiple sources of N are used, it is important to account for all sources of N.
Nitrogen available from manure applications, legumes, soil organic matter, and other
sources should be accounted for before supplementary applications of N are made.
The importance of accounting for all sources of N varies greatly from farm to farm
and region to region, depending on the relative contributions of various sources of N
to the soil-crop system.
3.8.1.2 Realistic Yield Goals
One of the important facets in determining N requirements for crops is yield. It is
important to set realistic yield goals when deciding how much N to apply. Climate,
crop genetics, crop management, and the physical and chemical properties of the soil
have a significant effect on crop yield. The primary reason for using realistic yield
© 2001 by CRC Press LLC
goals is economic. Methods to set realistic yield goals include using farm averages,
using a rolling 7- to 10-year field average or adjusting the past average and increase
it by a chosen percentage (usually less than 5%) to take advantage of higher-yielding
varieties.131
3.8.1.3 Amounts of Nitrogen To Apply
Applying only enough N to supply crop requirements should be used. Nitrogen needs
can be supplied by commercial fertilizer or manure. When deciding how much
manure to apply, it is important to know how much N is in the manure. The manure
application method will determine how much NH3 is lost.
3.8.1.4 Timing of Application
The most efficient method of using N fertilizer and minimizing its loss is to supply it
as the crop needs it. Maximum N use occurs near the time of maximum vegetative
growth. If irrigation is used, N may be applied through the irrigation system in four
or five applications. For nonirrigated crops, split applications or side-dressing are two
effective methods for controlling the timing of application. Manure should be applied
as soon as possible after planting except when used as a N source to top-dress small
grains.
3.8.1.5 Calibration of Equipment
It is important to calibrate manure and fertilizer applicator equipment. The task is simple and easy. Nitrogen in manure can be used more efficiently when a farmer knows
how much manure the spreader is applying per unit area. Details on calibrating manure
spreaders can be found in the Pennsylvania manure management manual.132
3.8.1.6 Early Season Soil And Plant Nitrate Tests
Early-season soil (preside-dress soil NO3 test) and plant NO3 tests have been developed for estimating available N contributions from soil organic matter, previous
legumes, and manure under the soil and climatic conditions that prevail at specific
production locations.133, 134 These tests are performed 4 to 6 weeks after the corn is
planted. Early-season soil NO3 tests involve taking soil samples in the top 30 cm of
the soil profile. Early-season plant NO3 testing involves determining the NO3 concentration in the basal stem of young plants 30 days after emergence. One disadvantage of the early season soil and plant NO3 testing is that there must be a rapid
turnaround between sample submitted and fertilizer recommendations from the soil
testing laboratory. If side-dress N fertilizer is being used in conjunction with manure,
the early-season NO3 test should help reduce the potential for overfertilization.
3.8.1.7 Nitrification Inhibitors
Nitrification inhibitors are available to stabilize N in the NH4 form. Stabilizing the N
in manure by inhibiting nitrification should increase its availability for crop uptake
© 2001 by CRC Press LLC
later in the season, reduce its mobility in soil, and reduce its pollution potential under
both conventional and conservation tillage.135 Sutton et al.136 found that stabilized
swine manure had a similar efficiency for crop production as anhydrous NH3.
Nitropyin will temporarily slow nitrification in the soil.
3.8.1.8 Leaf Chlorophyll Meters
The use of leaf chlorophyll meters is a relatively new method to measure N in corn.
Girardin et al.137 demonstrated a strong relationship between N crop deficiency, photosynthetic activity, and leaf chlorophyll content. Lohry138 was one of the first
researchers to use leaf chlorophyll content to monitor the N status of corn. In recent
years, chlorophyll meters have been used to schedule fertigation and side-dress N for
corn.139
3.8.1.9 Cover Crops
Cover crops are used to prevent the buildup of residual N during the dormant season
and prevent N leaching to groundwater in North America and Europe. In the U.S.,
cover crops are more widely used in the southeastern and Mid-Atlantic regions than
other parts of the country. Some of the concerns that have limited their use are depletion of soil water by the cover crop, slow release of nutrients contained in the cover
crop and difficulty in establishing and killing cover crops.140 Nonlegume cover crops
are much more efficient than legumes at reducing N leaching.
3.8.2 WATER MANAGEMENT
3.8.2.1 Irrigation Method
The irrigation method, insofar as it determines the uniformity, amount, and application efficiency, plays an important role in determining the irrigation management for
obtaining the greatest N use efficiency. The coefficient of uniformity determines how
efficiently water is applied to a field. By increasing the coefficient of uniformity, the
application efficiency increases and N leaching losses are reduced.141
Wendt et al.142 found that on a loamy, fine sand soil in Texas, less NO3 was
leached using subirrigation systems than with furrow or sprinkler systems. Furrow
irrigation had the highest water requirements, whereas automatic subirrigation had
the lowest. Water requirements for sprinkler irrigation and manual subirrigation were
approximately the same. McNeal and Carlile143 concluded that the typical furrow irrigation system for potatoes on sandy soils of the Columbia Basin area in Washington
used much larger quantities of water than efficient sprinkler irrigation and produced
extensive NO3 leaching. Alternative furrow irrigation (where two adjacent irrigation
furrows are never wet concurrently) produced considerably less NO3 leaching than
regular furrow irrigation. Surge-flow furrow irrigation offers improved opportunities
for N management with fertigation.139
3.8.2.2. Drainage Volume
Irrigation water management resulting in high leaching volume of 25–50% or more
of the water applied will cause considerable leaching of N. Nitrate leaching is signi© 2001 by CRC Press LLC
ficantly reduced by water management techniques that result in very low drainage
volumes and contribute relatively low mass emission of NO3 in the drainage
waters.144 Letey et al.,145 in studying the amounts of leached NO3 on various commercial farming sites in California and on a controlled experimental plot, found using
multiple regression analysis that the highest correlation was obtained from the
amount of leached NO3 vs. the product of the drainage volume and N fertilizer application. The second highest correlation was for amount leached vs. drainage volume.
Smika et al.,146 in a three-year study in Colorado on a sandy soil, found that for three
center-pivot irrigation systems, average annual deep percolation losses were 16, 29,
and 73 mm. The corresponding average annual NO3 losses were 19.0, 30.4, and 59.7
kg N/ha, respectively.
3.8.2.3 Irrigation Scheduling
Irrigation scheduling based on soil moisture measurements or evapotranspiration
(ET) requirements is the most practical water management method for controlling
NO3 leaching. With good irrigation scheduling, the required amount of water can be
applied at the right time. Duke et al.147 were able to successfully use the USDA irrigation computer scheduling program to determine the proper timing for irrigation and
the amount of water necessary to maintain high crop yields and minimize leaching
losses on sandy soils in Colorado. Wendt et al.142 were able to maintain the N in the
root zone for furrow, sprinkler, and subirrigation systems by irrigating on the basis of
potential ET. When water applied was greater than the 2–2.5 times potential ET and
NO3 in the soil profile were greater than 200 kg/ha, the leachate concentrations were
greater than 20 mg/L on a fine sand/loam soil.
Cassel et al.,148 in developing a sprinkler irrigation schedule for soybeans on
sandy loam soil in North Dakota, examined NO3 leaching differences occurring with
four water levels (dryland, under-irrigation, optimum irrigation, and over-irrigation).
They found that NO3 moved below the crop rooting zone with both heavy fertilizer N
applications and water in excess of ET. Agronomists and engineers in the
Hall County, Nebraska, Irrigation Management Quality Project149 demonstrated that,
with irrigation scheduling based on soil moisture measurements, reasonable corn
yield goals are attainable with less irrigation water and supplemental N than is commonly used.
3.9 SUMMARY
The biogeochemical N cycle is very complex because N occurs in many valence
states depending upon redox potential. Important N cycle processes include mineralization and immobilization, plant uptake, leaching, runoff, NH3 volitalization, and
denitrification. Sources of groundwater contamination include fertilizers, manures,
and sludges. Shallow groundwater NO3 concentrations in some parts of the U.S. may
be high. The USGS NAWQA study found that 15% of the samples collected in shallow groundwater beneath agricultural and urban areas had NO3 concentrations above
10 mg N/L. The lowest NO3 groundwater concentrations are found in the southeastern U.S.
© 2001 by CRC Press LLC
Surface water N concentrations are highest in agricultural areas. One of the
major sources of N input to surface waters in the Corn Belt is through subsurface discharge. Field studies have shown that N losses in surface runoff are correlated with
fertilization rates.
The best management practices to control N leaching can be classified as N management practices or water management practices. Accounting for all N sources is
important before supplemental N applications of manure or fertilizer are made. Other
N management practices include setting realistic yield goals, timing of N application,
calibration of equipment, and use of cover crops. Newer N management practices
being used today include early-season soil and plant NO3 tests and leaf chlorophyll
meters. Water management practices include irrigation application method, reducing
drainage volumes, and irrigation scheduling.
REFERENCES
1. Bowen, G. D. and Smith, S. E., The effects of mycorrhizae on nitrogen uptake by plants,
in Terrestrial Nitrogen Cycles, Processes, Ecosystem Strategies and Management, Clark,
F. E. & Rosswall, T. Eds. Ecol. Bull. 33, 237, 1981.
2. Jansson, S. L. and Persson, J., Mineralization and immobilization of soil nitrogen, in
Nitrogen in Agricultural Soils. Stevenson, F. J., Ed., Agronomy Monograph 22, ASA,
Madison WI., 1982, 229.
3. Alexander, M., Introduction to Soil Microbiology, John Wiley & Sons, New York, NY.,
1977.
4. Palm, C. A. and Sanchez, P. A., Nitrogen release from leaves of some tropical legumes
as affected by their lignin and polyphenolic contents Soil Biol. Biochem., 23:83, 1991.
5. Urquiaga, S., Giller, K. E. and Cadisch, G., Tracing mechanisms of nitrogen transfer
from legume to grass in tropical pastures, in Soil Management in Sustainable
Agriculture, H. Lee & H. Cook, Eds. Wye College Press, Wye, Ashford, UK., 1993, 104.
6. Toomsan, B., McDonagh, J. F., Limpinuntana, V. and Giller, K. E., Nitrogen fixation by
groundnut and soybean and residual nitrogen benefits to rice farmers’ fields in Northeast
Thailand, Plant and Soil, 175, 45, 1995.
7. Anderson, R. V., Coleman, D. S. and Cole, C. V., Effects of saprotrophic grazing on net
mineralization, in Terrestrial Nitrogen Cycles. Processes, Ecosystem Strategies and
Management Impacts, Clark, F. E. and Rosswall, T., Eds., Ecol. Bull. 33, 201, 1981.
8. Rosswall, T., Microbiological regulation of the biogeochemical nitrogen cycle. Plant and
Soil, 67, 15, 1982.
9. Clarholm, M., Protozoan grazing of bacteria in soil—impact and importance, Microbiol.
Ecol. 7, 343, 1981.
10. Clarholm, M., Possible rules for roots, bacteria, protozoa and fungi in supplying nitrogen
to the plants, Fitter, A. H., Atkinson, D., Read, D. J. & Usher, M. B., Eds. in Ecological
Interactions in Soil:Plants, Microbes and Animal, Brit. Ecol. Soc. Spec. Publ. Vol. A,
Blackwell Sci. Publ., Oxford, 1985, 355.
11. Hansson, A. C., Roots of arable crops: production, growth dynamics and nitrogen content, Swedish Univ of Agric. Sci., Dept of Ecology and Environmental Research, Report
28, 1987.
12. Olson, R. A. and Kurtz, L. T., Crop nitrogen requirements, utilization and fertilization, in
Nitrogen in Agricultural Soils, Stevenson, F. J., Ed., Agronomy Monograph 22, Madison,
WI, 1982, 567.
© 2001 by CRC Press LLC
13. Schrader, L. C., Domska, D., Jung, P. U. and Peterson, A., Uptake and assimilation of
ammonium-N and nitrate-N and their influence on the growth of corn (Zea mays), Agron.
J. 64, 690, 1972.
14. Vietz, F. G. Jr, and Hageman, R. H., Factors affecting the accumulation of nitrate in soil,
water and plants, Agricultural Handbook No. 413, U.S. Department of Agriculture,
Washington, D.C., 1971.
15. Stevenson, F. J., Cycles of Soil—Carbon Nitrogen, Phosphorus, Sulfur, Micronutrients,
John Wiley & Sons, New York, NY, 1986.
16. Newbould, P., The use of nitrogen fertilizer in agriculture, Where do we go practically
and ecologically?, in Ecology of Arable Land—Perspectives and Challenges,
Developments in Plant and Soil Sciences, Clarholm, M. & Bergstrom, L., Eds. Vol. 39,
Kluwer Academic Publ., 1989, 281.
17. Nommik, H. & Vahtras, K., Retention and fixation of ammonium and ammonia in soils,
in Nitrogen in Agricultural Soils, Stevenson, J. F., Ed., Agronomy Monograph 22, ASA,
Madison, WI, 1982, 123.
18. Allison, F. E., Doetsch, J. H. and Roller, E. M., Availability of fixed ammonium in soils
containing different clay minerals, Soil Sci., 75, 373, 1953.
19. Gustafson, A., Leaching of nitrogen from arable land into groundwater in Sweden,
Environ. Geol. 5, 65, 1983.
20. Kissel, D. E., Bidwell, O. W. and Kientz, J. F., Leaching classes of Kansas soils, Kansas
State Univ., Agric. Exp. Sta. Bull. 64, 1982.
21. Bergstrom, L. and Johansson, R., Leaching of nitrate from monoligh lysimeters of different types of agricultural soils, J. Environ. Qual., 20, 801, 1991.
22. Priebe, D. L. and Blackmer, A. M., Recovery of urea-derived 15N in calcareous soil following surface applications under wet and dry conditions, in Agronomy Abstracts, ASA,
Madison, WI, 1985.
23. Bergstrom, L., Leaching of dichlorprop and nitrate in structured soils, Environ. Poll., 87,
189, 1995.
24. Kanwar, R. S., Baker, J. L. and Laflen, J. M., Nitrate movement through the soil profile
in relation to tillage system and fertilizer application method, Trans., ASAE, 28, 1802,
1985.
25. Bergstrom, L. and Brink, N., Effects of differentiated applications of fertilizer N on
leaching losses and distribution of inorganic N in soil, Plant and Soils, 93, 333, 1986.
26. Meisinger, J. J., Hargrove, W. L., Mikkelsen, R. L., Williams, J. R. and Benson, V. W.,
Effects of cover crops on groundwater quality, in Proc. of Int. Conf. on Cover Crops for
Clean Water, Hargrove, W. L., Ed., Soil and Water Conserv. Soc., Antieny, IA, 1991, 57.
27. Legg, J. O. and Meisinger, J. J. Soil nitrogen budgets, in Nitrogen in Agricultural Soils,
Stevenson, F. J. Ed., Agronomy Monographic 22, 503, 1982.
28. Kussow, W., El-Swaify, A. A. and Mannering, J. Soil Erosion and Conservation in the
Tropics, ASA Special Publication No. 43, ASA, Madison, WI, 1982.
29. Nicholaichuk, W. and Read, W. L., Nutrient runoff from fertilized and unfertilized fields
in western Canada, J. Environ. Qual., 7:542–544, 1978.
30. Burwell, R. E., Timmons, D. R., and Holt, R. F., Nutrient transport in surface runoff as
influenced by soil cover and seasonal periods, Soil Sci. Soc. Am. Proc., 39, 523, 1975.
31. Schuman, G. E., Burwell, R. E., Piest, R. F., and Spomer, R. G., Nitrogen losses in surface runoff from agricultural watersheds on Missouri Valley loess. J. Environ. Qual. 2,
299, 1973.
32. Lal, R., Effective conservation farming systems for the humid tropics, Soil Erosion and
Conservation in the Tropics, Kussow, W. El-Swaify, S. A. and Mannering, J., Eds., ASA
Special Publication No. 43, ASA, Madison, WI, 1982, 57.
© 2001 by CRC Press LLC