Enzymes in the Environment: Activity, Ecology and Applications - Chapter 15 pps
Bạn đang xem bản rút gọn của tài liệu. Xem và tải ngay bản đầy đủ của tài liệu tại đây (448.17 KB, 15 trang )
15
Bioindicators and Sensors of Soil Health
and the Application of Geostatistics
Ken Killham
University of Aberdeen, Aberdeen, Scotland
William J. Staddon
Eastern Kentucky University, Richmond, Kentucky
I. INTRODUCTION
We require the soil to perform a variety of key functions. It must provide the food, fuel,
and fiber needs of the world’s burgeoning population and must also regulate the quality
of the air we breathe and the water we drink. We also require the soil to act as a sink for
the many pollutants generated by human domestic, agricultural, and industrial activities.
Because of the conflicting pressures increasingly applied to the soil resource, there is a
crucial need for the capacity to assess and monitor the health or quality of soil. In 1996
the Soil Science Society of America (1) defined soil health as ‘‘the continued capacity
of a specific kind of soil to function as a vital living system, within natural or managed
ecosystem boundaries, to sustain plant and animal productivity, to maintain or enhance
the quality of air and water environments, and to support human health and habitation.’’
The definition offered by the society provides a useful basis for considering the
relevance of bioindicators and sensors for the assessment of soil health. It is clear from
the definition that relevant indicators and sensors must contribute to measurement of the
functional integrity of soil in order to assess whether it can sustain its key roles. As dis-
cussed in later sections in this chapter, it is unlikely that any one property or process (and
therefore a single bioindicator or biosensor) is sufficient to provide a reliable measure of
soil health. It is much more likely that indicators and sensors will be used in a battery of
tests in which enzymes of plant, microbial, and animal origin play a part.
As well as exercising care in terms of overreliance on single bioindicators and bio-
sensors, it has been pointed out (2) that whereas scientists select indicators for the link with
functions of soil quality, others such as agriculturalists may just as validly characterize soil
health by using descriptive properties such as tilth with a direct value judgment.
This chapter reviews the main biological properties/systems that can be used as
indicators and sensors of soil health and the application of geostatistics for describing the
spatial variability of these properties.
Copyright © 2002 Marcel Dekker, Inc.
II. BIOINDICATORS OF SOIL HEALTH
A. Definition
A bioindicator is defined as ‘‘an organism, part of an organism, product of an organism
(e.g., enzyme), collection of organisms or biological process which can be used to obtain
information on the quality of all or part of the environment.’’ A number of bioindicators
have been suggested for monitoring soil health, and these are briefly considered.
B. Soil Microbial Biomass
Jenkinson and Rayner (3) defined the soil microbial biomass as the ‘‘eye of the needle’’
through which all organic matter in soil must eventually pass. It is therefore the key driver
of ecosystem productivity and, despite the fact that the microbial biomass typically repre-
sents about 5 tons per hectare of a temperate grassland ecosystem compared to biomass
of the vegetation an order of magnitude greater (4), most of the carbon/energy and nutrient
flow is through the soil microbial biomass.
In the 1970s and 1980s a considerable number of methods for determining soil
microbial biomass were developed. These methods have been reviewed by Sparling and
Ross (5) and are dominated by two techniques: chloroform fumigation and substrate-
induced respiration. The fumigation techniques are based on the susceptibility of microbial
biomass to chloroform vapor. The chloroform-labile carbon mobilized is determined either
by measuring the CO
2
released by mineralization when the fumigated soil is incubated
or by measuring the C that can be extracted from the fumigated soil. Biomass N, P, and S
can also be determined after extraction from fumigated soil. Substrate-induced respiration
techniques are physiologically based; they involve providing the soil microbial biomass
with a saturating concentration of a readily mineralizable substrate (usually glucose) and
monitoring the respiration over a short incubation period. The substrate saturation rate of
respiration represents maximal reaction velocity and is therefore proportional to the bio-
mass. Conversion factors are available to convert the V
max
respiration and the C, N, and
P extracted from fumigated soil into a biomass value.
Because the soil microbial biomass is the main processing unit for organic matter,
its size tends to be roughly proportional to the total organic matter pool. Skeletal montane
soils, for example, have low organic matter and a correspondingly low microbial biomass.
Deciduous woodland soils, on the other hand, have much higher organic matter status and
a higher microbial biomass. Typical biomass values for a range of soils are reported in
a 1997 review by Sparling (2).
Because the microbial biomass is generally related to the organic matter content of
the host soil, it is not the absolute size of the biomass that indicates soil health but changes
in biomass size (other than those that result from seasonal and other natural factors). The
soil microbial biomass can therefore be seen as a barometer, with reductions in biomass
related to either a reduction in the carbon inputs that sustain it or a toxic impact of some
kind (6). A change in biomass size then heralds a later change in soil organic matter status.
The predictive value of measuring soil microbial biomass as a bioindicator of soil fertility
has been suggested by a number of researchers (7,8).
Although the soil microbial biomass can, as mentioned, be affected by toxic impacts,
there are numerous soil contaminants that can adversely affect the biological functioning
of the soil but that do not affect the size of the biomass itself. Some of these contaminants
affect the respiratory quotient of the biomass (i.e., the rate of soil microbial respiration
Copyright © 2002 Marcel Dekker, Inc.
is a function of biomass size) rather than biomass alone (9), but others are more subtle
and require other bioindicators in order for their impact on soil health to be evaluated.
C. Carbon and Nutrient Cycling
Mineralization reactions are vital both for the turnover of organic residue inputs to soil
and for the release of bound nutrients to plants. The mineralization reactions are carried
out by both soil animals and microbes. The former group may not rival the microbes in
terms of total carbon/energy, nutrient flow, and breadth of their enzymatic activities, but
they have a key role in comminuting organic debris and sometimes acting as vectors in
inoculating the newly exposed surfaces with microbial degraders.
The measurement of rates of mineralization of organic C and associated nutrients
(e.g., N, P, and S) probably targets the best overall bioindication of soil health. So many
organisms are involved in these processes, however, that such measurements are unlikely
to identify effects on individual species that may themselves still be of importance to soil
health.
Carbon mineralization has generally been measured by loss of substrate (e.g., the
traditional litter-bag techniques) or by respiration of CO
2
. Measurement of carbon mineral-
ization rates can be defined by use of C isotopes. This technique enables all mineralized
C to be assessed and allows quantification of the partitioning of carbon into biomass and
into cell maintenance. Various quotients can then be determined, and these can indicate
stress to the microbial biomass as well as rates of C mineralization. This is because the
degree to which soil microorganisms partition carbon into biomass versus maintenance
of cell integrity is largely a function of environmental stress (10).
Nitrogen mineralization measurements can be made both aerobically and anaerobi-
cally. The advantage of the latter is that it precludes many of the problems of reimmobilisa-
tion of N due to microbial processing of C during cell growth and synthesis (11). As
with C mineralization, the use of isotopic techniques has done a great deal to facilitate
N mineralization determinations. Isotope dilution techniques involving
15
N enable gross
mineralization to be reliably measured (12).
In contrast to the mineralization processes, nitrification is a soil N cycle flux involv-
ing very few species (Table 1). The simplified reactions illustrated indicate how potentially
sensitive a bioindicator the nitrification process can be. Because the process is the domain
Table 1 Soil Microorganisms Involved in Mineralization and Nitrification N Fluxes.
N flux Soil microorganisms involved
N mineralization Most of the heterotrophs, which domi-
Organic N → NH
3
/NH
4
ϩ
nate the soil microbial biomass.
Nitrification In most soils, the first nitrification step
NH
4
ϩ O
2
ϩ H
ϩ
ϩ 2e
Ϫ
→ NO
2
Ϫ
ϩ 5H
ϩ
ϩ 4e
Ϫ
is dominated by the genera Nitrosolo-
N
2
O
Ϫ
ϩ H
2
O → NO
3
Ϫ
ϩ 2H bus, Nitrosospira, and to a lesser ex-
tent Nitrosomonas; the second by the
genus Nitrobacter; in acid forest soils,
these autotrophs are replaced by a
range of heterotrophs (mainly fungi).
Copyright © 2002 Marcel Dekker, Inc.
of a very few specialist, chemoautotrophic bacteria, any factor that adversely affects these
‘‘keystone’’ species dramatically affects the process (and hence the release of the most
plant-available form of mineral N in soils, nitrate). It is for this reason that screening tests
for pesticides and other agrochemicals always include assessment of impact on nitrification
and why environmental risk assessments of soil pollutant also include nitrification (13).
However, in many cases, good soil health does not require a high supply of available
nutrients through processes such as nitrification (2).
D. Soil Enzymes
Although enzymes contribute to the part played by the other bioindicators considered in
this review, it is particularly important to appreciate the invaluable integrative role of a
suite of enzymes in assessing soil health. This is because of the massive array of enzyme
assays that can readily be applied to soil, encompassing the hydrolases (e.g., phosphatases,
sulfatases, urease, proteases, peptidases, deaminases, cellulases), the oxidoreductases (e.g.,
dehydrogenases, phenol oxidases, peroxidases, catalases), the lyases, and the transferases.
Many soil enzymes have a functional location that is outside the cell, and the significance
of these and other enzymes in soil microbial ecology has been reviewed (14). These extra-
cellular enzymes are often relatively stable and can persist for extended periods, thereby
providing a longer-term perspective than measurements involving extant soil organisms
alone. The impact of pollutants on soil health has been addressed through the measurement
of enzyme activity. Such an approach offers a useful soil management tool as soil enzyme
activity should relate to key soil functions such as biogeochemical cycling, plant growth,
and degradation of organic contaminants (15).
Enzymes that catalyze a wide range of soil biological processes offer a useful assess-
ment of soil ‘‘function’’ (14), and common enzymes, such as dehydrogenase, urease, and
phosphatase, fit into this category. Metabolic stains such as fluorescein diacetate (FDA)
also provide a useful functional indicator (16). The assay works on the principle that the
FDA molecule is taken by active cells and hydrolyzed by a range of enzymes, including
proteases, lipases, and esterases. This releases the fluorochrome fluorescein so that enzy-
matically active cells can easily be distinguished with the aid of a fluorescence microscope
with an ultraviolet (UV) source.
Enzymes that catalyze a narrow range of soil biological activity are useful when
sensitive indicators of change, such as may result from a pollution event, are sought.
Enzymes catalyzing the degradation of certain organoxenobiotics (e.g., polyaromatic hy-
drocarbons [PAHs], polychlorinated biphenyls [PCBs], dioxins) fall into this category.
Knowledge of a reduction in a soil’s capacity to act as a fully functional mineralization
medium for pollutants is critical in overall soil health assessment, but particularly in waste
management (17) and as an indicator of the successful bioremediation of contaminated
land (16).
E. Community Structure and Biodiversity
In recent years, a great deal of research has been devoted to developing and optimizing
methods to assess the structure of the soil microbial community in terms of taxonomy
and in terms of function.
Developments in molecular biology have now provided soil biologists with ‘‘off
the shelf’’ methods for assessing microbial diversity. This has represented nothing short
Copyright © 2002 Marcel Dekker, Inc.
of a revolution, allowing the genetic and functional diversity of the whole community,
rather than just the very small percentage that can be cultured in the laboratory, to be
measured for the first time. The molecular and other methods available for analysis of
microbial community structure was reviewed in 1997 by White and McNaughton (18)
and are briefly discussed in relation to soil health in the following section.
The genetic diversity of the soil microbial community can now be assessed by using
broad screening methods as well as methods with a narrow focus. The broad screening
methods, such as deoxyribonucleic acid (DNA) reanealling kinetics (i.e., the rate at which
melted, single-standard DNA reaneals on cooling depends on the genetic diversity), and
denaturation gradient gel electrophoresis/thermal gradient gel electrophoresis (DGGE/
TGGE), methods that aim to quantify genetic diversity by exploring banding patterns of
soil microbial DNA by gel electrophoresis, may have a future contributory role in soil
health assessment, but probably in combination with more focused probing at the genus
and the specific level. The latter gene probes use DNA and ribonucleic acid (RNA) tech-
niques and can be linked to polymerase chain reaction (PCR) methodologies for increased
sensitivity of detection. 16S-Ribosomal RNA probes are now particularly well developed
for the better characterized groups of soil bacteria (19) and have contributed considerably
to our understanding of genetic diversity in soil. DNA probes linked to enzymes with
specific functions provide a more activity-based assessment and have, for example, been
used to assess the presence of xenobiotic degraders (20) and denitrifiers (21) in soil. Mes-
senger RNA, with its very short turnover, can be probed to provide ‘‘real-time’’ functional
assessment. When such probes are linked to fluorescent tags, they can also provide spatial
information on genetic/functional diversity. The RNA probes now represent a standard
ecological tool that will increase in power of resolution as more and more systems are
developed. This particularly applies to the soil fungi (both free-living and symbiotic), for
which molecular techniques are still in their infancy; to the less well characterized bacteria;
and to the microfauna.
Development of molecular probes to assess functional diversity has partly been
driven by the limitations of techniques that rely on the culturability of soil microbes. Of
these techniques, the most widely used is probably the Biolog system. This system is
based on physiological profiling—the range and number of carbonaceous sole substrates
utilized by the enzymatic activity of microbial communities or by individual soil microor-
ganisms—and the data generated can be interrogated by principal component analysis to
differentiate between soils or to assess changes in soil health (22).
F. Soil Animals
Because of the fundamental importance of soil animals in carbon and nutrient cycling,
their abundance and diversity have been used to provide a key contribution to the overall
assessment of soil health (23). There are a number of relatively simple methods for ex-
tracting the micro- and mesofauna from soil (24), although identification beyond genus
level without considerable experience is difficult.
1. Microfauna and Soil Health
Numerous workers have established the potential of using protozoa and nematodes as
indicators of soil health because of their tremendous abundance, their production of a
wide range of enzymes for roles ranging from plant pathogenicity to mineralization of
soil organic matter, and their scope for culturing the former for use in linked bioassays
Copyright © 2002 Marcel Dekker, Inc.
(25). The diversity and abundance of soil protozoa (26) and nematodes (27) can be signifi-
cantly reduced by the impact, for example, of air-borne pollutants and by heavy metal–
contaminated wastes. Because of the trophic interactions that link the activity of the soil
protozoa and the nematodes both to plants and to the bacteria and the fungi (4), such
reductions in microfaunal abundance and diversity can have a profound effect on soil
health.
2. Mesofauna and Macrofauna and Soil Health
That mesofaunal groups, such as the arthropods, and their associated enzymatic activities
have long been used to assess ecosystem impacts of pollution suggests that they represent
important bioindications of soil health. The contrasting ecophysiological characteristics
of many of the soil arthropods provide the key to their value as bioindicators. For example,
comparisons of the median pH preference of soil arthropods have identified the strength
of the indicator value of individual arthropods with respect to this soil parameter (28).
Presumably, this approach can be applied to other soil parameters such as organic matter
quantity and quality, and ultimately to soil health.
The earthworms represent the most studied group of soil animals and links between
earthworms and soil health have been suggested for centuries. In 1997, these links were
more reliably quantified in agroecosystems with a reasonably strong correlation between
the yield of a cereal crop and the biomass of earthworms in the soil supporting the crop
(29). Earthworm bioindication of pollutant impacts on soil health has considerable merit
and addresses pollutant bioavailability rather than total concentrations. Furthermore, it has
been pointed out (30) that the different ecophysiological strategies of the earthworms
provide scope for differentiating certain pollutant effects—the epigeic (surface dwelling)
species tend to be directly affected by surface-deposited pollutants, whereas the endogeic
(soil-dwelling) species tend to experience more chronic exposure through ingestion of soil
contaminated with ‘‘aged’’ pollutants.
There are numerous advantages to the use of earthworms as bioindicators of soil
health. They are relatively easy to sample and enumerate and, with some experience and
care, can be readily identified. Their relatively long generation times compared to those
of many other soil invertebrates also allow sampling to identify changes in soil health to
be done somewhat less frequently. The use of earthworms as well as other soil animals
as bioindicators of soil health must be considered carefully for soils where management
has uncoupled the natural linkage between soil faunal activity and the soil’s capacity to
sustain crop growth as well as other soil functions. The use of pesticides and fertilizers
may have this effect, for example, massively reducing the population density of the earth-
worms, and yet the farmer would describe the soil as fit for purpose and in good health.
It has been concluded therefore that the high variability of earthworm abundance is deter-
mined by factors other than those that most influence soil health and crop yield (31).
G. Plants
The importance of plants as bioindicators of soil health has been known since ancient
times (32) where the presence of a particular ‘‘natural’’ plant species or the condition of
a ‘‘crop’’ species is diagnostic of soil conditions, be they physical, chemical, and/or even
biological. Where a high degree of diagnostic sensitivity is required, production of particu-
lar chemicals or ‘‘biomarkers’’ by certain plant species can be used (33). These biomarkers
include a range of primary and secondary metabolites, the former including the amino
Copyright © 2002 Marcel Dekker, Inc.
acid proline (34) and the latter including polyamines such as spermidine and putrescine
(35). The activities of certain plant enzymes, such as peroxidases and catalases, can also
be used as biomarkers, particularly for assessing pollutant impacts (36).
Plants can serve as bioindicators of toxic pollutant effects on soil health through
three means: either pollutant accumulation in tissues, absence or presence of key plant
species in a vegetation community, or physiological and biochemical changes to the plant.
Plants that provide useful bioindicators in this regard have been proposed for different
classes of pollutant. Plant response to metals is particularly well documented (plants are
either metal accumulators, metal excluders, or metal indicators, depending on whether
their tissue concentrations indicate accumulation or exclusion, or reflect soil concentra-
tions, respectively) (37). This background knowledge of plant response greatly facilitates
selection of plant species and the means of bioindication.
Plants have a number of major advantages as bioindicators of soil health. They are
relatively cessile, they are generally easy to identify and analyze, and their root systems
can integrate over space and time. This last named property is of great importance when
many of the chemical and physical properties of soil are heterogeneous in distribution
and can change at the microscale.
III. BIOSENSORS OF SOIL HEALTH
A. Definitions
A biosensor is ‘‘any biological material which, when exposed to an analyte (e.g. air, soil,
water), provides an information linked response via a suitable transducer’’ (38).
The biological material used in a biosensor can comprise plants (whole plants, or-
gans, or cells), vertebrates, invertebrates, microorganisms), microbial tissue, enzymes, nu-
cleic acid probes, antibodies, as well as other kinds of biological receptor. In using biosen-
sors to test for soil health, the analyte is the soil or soil constituents, although it may be
exposed to the sensor in a number of ways. Soils may be extracted with a range of solvents
and the extract used with the solid phase present, either intact as a slurry or in a procedure
that more closely defines the contact with either the liquid or the solid phase of the
soil (13).
The type of transducer involved in biosensing for soil quality can vary, and electrical,
conductivity, acoustic, and optical transducers can be used. In Sec. III.C the emphasis is
on optical transducers since the sensors being considered are light-emitting.
B. Whole Cell/Organism Sensors and Reporter Genes
Recent advances in molecular biology have allowed the introduction of reporter genes
into a wide variety of soil microorganisms. These genes can provide real-time reporting
on the function of the host; the nature of the function is determined by the gene promoter
downstream of which the reporter gene(s) is placed in the genome. If a suitable general
promoter is used, then the genes can give a signal that reports on the overall metabolic
health/status of the host.
The introduction of enzyme-linked lux, luc, gfp, lac, and xyl reporter genes into
bacteria and fungi (39) has generated a wide range of ecologically relevant whole cell
reporter systems that can be used to assess soil health. Recently (C Lagido, personal com-
munication), luc genes have been cloned into nematodes so that soil animals can also
Copyright © 2002 Marcel Dekker, Inc.
provide real-time reporting of soil health. The movement and greater surface area contact
between a nematode and the soil environment, coupled with the key role of the soil animals
in nutrient cycling, make this a particularly useful development.
C. lux Biosensors
The lux genes encode for bioluminescence in naturally luminescing marine bacteria such
as Vibrio fischeri, Vibrio harveyi, and Photobacterium phosphoreum, and light output is
expressed via the enzyme luciferase (39).
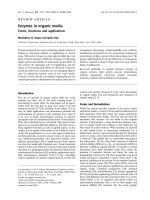
lux genes have now been cloned into a wide range of microorganisms so that biolu-
minescence reports on the metabolic status of each of these whole cell biosensors can be
used for ecologically relevant and rapid assessment of soil health (40). Examples of these
biosensors and the ecological niche they represent are provided in Fig. 1.
In addition to the ‘‘metabolic health’’ sensors illustrated in Fig. 1, reporter genes
can be placed under the control of catabolic promoters so that catabolic activities can be
monitored by the particular reporter system (luminescence, fluorescence etc.) (40). This
is a particularly valuable tool in the study of the enzymological characteristics of degrada-
tion of both xenobiotics and natural soil organic constituents. Biosensors can be used in
a variety of ways to assess soil health (40,41). Probably the most useful approach involves
solid-phase soil health testing, although tests involving soil extracts are also used. In all
cases, bioluminescence is assayed after varying periods of exposure to the soil. Acute and
chronic exposures both provide important information that can contribute decision support
for soil/land management (41). It has been reported (41) that lux bacterial biosensors may
be used as a decision support tool in the management of bioremediation of a large industri-
ally contaminated site. The sensors were used to assess whether soil health was adequate
Figure 1 Examples of lux bacterial biosensors and the information they can provide for assess-
ment of soil health.
Copyright © 2002 Marcel Dekker, Inc.
forintrinsicbioremediationand,wherethiswasnotthecase,whatmeasureswererequired
torestoresoilhealth.
IV.GEOSTATISTICS
A.Introduction
Sincethespatialvariabilityofmicrobialcommunitiesandprocessesexistsatseveral
scales,includingmicrosite,plot,andlandscapelevels(43),understandingtheirspatial
structureiscriticaltounderstandingsoilecologicalprocessesandsoilconservationefforts
(44).Thespatialvariabilityofsoilenzymeactivitieshasbeenexaminedbyusingclassical
statisticalapproaches(45,46).However,geostatistics,whichhaditsoriginsinthemining
industry,isbecomingincreasinglypopularamongsoilscientistsforassessingspatialvari-
ability,andthereareseveralexcellentreviewsoftheprocess(47–50).Severalstudies
haveusedthisapproachtocharacterizethespatialvariationinsoilenzymeactivities(51–
54).Thefollowingisabriefdescriptionofgeostatisticsandinsightsintosoilenzyme
ecologicalfeaturesithasprovided.Clearly,thespatialvariationofallpotentialbioindica-
torsmustbebetterunderstoodforimplementationofsuccessfulmonitoringprograms.
B.Definitions
Geostatisticscharacterizesthespatialdependenceorindependenceofsoilparameters
takenatdifferentsamplinglocations.Itwouldbeaxiomatictostatethatwhensoilsamples
aretakenclosetogetherthevariation(orrelativelackthereof)betweenmeasuredvalues
reflectstheircloseproximity.Suchsamplesaresaidtobespatiallydependentorautocor-
relatedsincetheirvariationreflectslocalizedconditions.Assamplesaretakenatincreas-
ingdistances,thevariationbetweenthemalsoincreases.Whenthedistancesbecomelarge
enough,thesamplesareindependentofeachother.
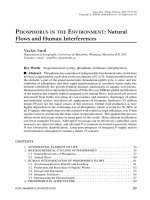
Geostatisticscomprisestwocomponents:(1)modelingthespatialvariationtocreate
thesemivariogram(Fig.2)and(2)krigingtoproducemaps(Fig.3).Thesestudiesbegin
byestablishingsamplinggridswithinaplot(Fig.4).Samplesaretakenateachpointand
parameters measured. Differences in parameter values are then compared for all points.
Semivariograms (Fig. 2) describe the semivariance (a measure of parameter variance)
Figure 2 Example of a semivariogram. Semivariance is plotted for each log distance and a model
is fitted to the points. The verge is the distance over which samples are spatially dependent. The
sill represents the maximal variation in the plot. A nugget occurs when the model does not intercept
at the origin and is indicative of sampling error or spatial structure between the sampling locations.
Structural variance represents the proportion of the variance resulting from spatial structure.
Copyright © 2002 Marcel Dekker, Inc.
Figure 3 Map created from Kriging data. As with other interpolation techniques, the contour
lines represent predicted values for a particular location. However, the values predicted by Kriging
were determined by using a semivariogram, which allows errors associated with each prediction to
be determined.
between sampling locations at different lag distances (Fig. 4). As one would expect, if
the distance between sampling locations increases, the semivariance also increases (Fig. 2).
At a certain distance, known as the range, the semivariance ceases to increase. The maxi-
mal semivariance is referred to as the sill. Soil properties that lie within the range are
spatially dependent and are said to be autocorrelated. Soil samples that lie beyond the
range are spatially independent. The range is important because it provides the researcher
with an estimate of the area for which a sample is representative. Further, as samples
taken within the range are spatially dependent, the use of classical statistics is precluded,
Figure 4 Grids are established in a plot and samples are taken from every point. The parameter
for each sampling point is compared with those of all other sampling points. All the pairs of a given
distance (known as the lag distance) are pooled together to give a measure of semivariance for that
lag distance. Pairs that are separated by a distance that does not correspond to one of the established
lag distances are assigned to the closest lag distance.
Copyright © 2002 Marcel Dekker, Inc.
assuchanalysesassumesampleindependence.Thisinformationisvaluableinthedesign
ofsamplingstrategiesforbioindicatorsasanunderstandingoftherepresentativenessof
samplesofalargerareaiscritical.Thethirdimportantfeatureisthenugget.Theoretically,
whenthelagdistanceiszero(samplestakenatthesamepoint)thereshouldbenovariance.
OftenthesemivariograminterceptsalongtheYaxis,notattheorigin,andthisisknown
asthenuggeteffect.Presenceofanuggetindicateseithermeasurementerrororspatial
structureoverdistancesshorterthantheintervalsbetweensamplinglocations.Structural
varianceisthefourthpropertycharacterizedbythesemivariogram.Thisvalue,whichis
oftenexpressedasaratiobetweenthevariancenotexplainedbythenuggetandthetotal
variance,quantifiestheamountofvariancearisingfromtheunderlyingspatialstructure.
Thegreatertheratio,themorespatiallydependentthesoilparameteris.Informationgener-
atedinthevariogramisthenusedforkriging.Krigingallowsmaps(Fig.3)thatpredict
parameter values at unsampled locations to be drawn. What separates this approach from
other interpolation techniques is that confidence in the predicted value can be assessed.
Geostatistics has gained increasing popularity in the soil sciences. Many studies
have described the spatial variation of soil properties. This interest has, at least in part,
been driven by the desire to develop high-precision agricultural practices. Such technolo-
gies depend on an understanding of the spatial distribution of soil properties such as nutri-
ents and organic matter. However, soil scientists have recognized the power of this method
for increasing our understanding of soil ecological characteristics at the microsite (55)
and field scales (52). Comparisons of semivariograms and kirged maps allow new insights
into the relationships between soil properties. It must be cautioned, however, that similarity
in spatial structure does not necessarily reflect causal relationships.
C. Spatial Variability of Soil Enzyme Activity
The range over which enzyme activities are spatially dependent depends on the enzyme
and localized conditions. Dehydrogenase activity was found to be moderately spatially
dependent (spatial structure 37%) in a no-till field with a range that exceeded 200 m (56).
In contrast, others reported that urease activity was autocorrelated over distances of Ͻ1
to 15 m, depending on the field examined (51,54). In contrasting ranges between studies,
the size of the areas examined must be considered. Spatial structure can be complex, and
a large area may have several sills nested within the semivariogram (50). von Steiger and
associates (54) also found that organic carbon (OC) was more strongly autocorrelated than
urease activity at all the sites they examined. They reasoned that OC would not fluctuate
in the short term. However, urease activity reflects soil microbial biomass and nutrient
status, which experience greater temporal change.
In an examination of soil enzyme activities and other soil parameters along a slope,
mapping revealed similar spatial patterns for water content, OC, phosphatase, and arylsul-
fatase activities (52). The relationship of the two physicochemical parameters to the en-
zyme activities is suggestive of an underlying ecological relationship. Examination of
semivariograms revealed that arylsulfatase activity was more spatially dependent (large
structural variance) than either OC or phosphatase activity (low structural variance). In-
triguingly, phosphatase activity showed a similar range to that of inorganic P, and the
authors suggested this observation required further attention. Further, the authors found
that phosphatase and arysulfatase showed similar spatial patterns. In contrast, it was dem-
onstrated in 1999 (53) that two measures of microbial activity, fluorescein diacetate hydro-
lysis (FDA) and triphenyl-tetrazolium chloride (TTC) dehydrogenase activity, showed
Copyright © 2002 Marcel Dekker, Inc.
opposite trends in an agricultural plot under crop residue management. FDA activity fol-
lowed a similar pattern to that of soil pH, whereas TTC activity was spatially related to
organic matter and clay content.
Although several of the studies discussed have found that soil enzyme activity is
spatially related to organic matter, this is not always the case. In a comparison of areas
within a riparian zone that varied in drainage (51) a spatial relationship between organic
matter and phosphatase was found in a moderately well drained area, but no relationship
between these two parameters was noted in a poorly drained area. Again these relationships
do not necessarily represent causal interactions but do enhance our understanding of soil
enzyme ecological features. These insights are especially significant in the context of
bioindicator development. Appropriate sampling strategies may vary for physical, chemi-
cal, and biological parameters.
D. Applications of Geostatistics
As discussed previously in this chapter, many parameters have been proposed to assess
soil health. Spatial variability is a critical component in our understanding of soil quality
and development of methods for its assessment. Halvorson et al. (57) described a krig-
ing procedure that incorporated several soil parameters simultaneously, including dehy-
drogenase and phosphatase activities. This approach allowed maps to be drawn showing
areas of potentially high and low soil health based upon several criteria. Although much
attention has been paid to the spatial variability of agricultural soils, other soils would
benefit from this type of analysis. For example, bioremediation is an area in which
much could be learned from geostatistical approaches and bioindicators of soil health
would be very important for assessing bioremediation potential and success. Spatial
analysis could be useful for predicting contaminant concentrations as well as develop-
ing appropriate sampling (and then treatment) strategies. Potential studies could include
examining the spatial variability of contaminant degradation, relevant enzyme activity,
and survival of released or biostimulated organisms. The ability to relate such parameters
to the soil properties is invaluable for the design and improvement of bioremediation
strategies.
V. CONCLUSIONS
The heterogeneity of soil with respect to the chemical, physical, and biological properties
and processes that contribute to soil health necessitates resolution across a range of scales.
Microbial biosensors, in particular, have the power to resolve soil health from the microsite
level upward. Individual lux biosensors can be CCD imaged and their activity monitored
in situ (41), but they can also be used to assess the health of soil across large sites (42).
Both scales provide invaluable information. The microsite study is essential if we are to
understand contaminant bioavailability, for example, but much larger-scale resolution is
required when management/decision support is required.
Although, to date, only a few papers have utilized geostatistics to examine potential
bioindicators of soil health, this approach has tremendous potential. Indeed, such studies
are necessary for the development of bioindicators. Knowledge of spatial variability is
essential for designing appropriate sampling strategies and interpreting results of such
studies.
Copyright © 2002 Marcel Dekker, Inc.
In conclusion, this chapter reviews the exciting and rapidly developing field of bioin-
dicators and biosensors of soil health and identifies a key role for geostatistics to help
overcome the challenges of spatial heterogeneity in applying these indicators and sensors.
REFERENCES
1. JW Doran, TB Parkin. Defining and assessing soil quality. In: JW Doran, DC Coleman, DF
Bezidicek, BA Stewart, eds. Defining Soil Quality for a Sustainable Environment. Soil Science
Society of America Special Publication No. 35, Madison, WI:1944, 1996, pp 3–21.
2. GP Sparling. Soil microbial biomass, activity and nutrient cycling as indicators of soil health.
In: CE Pankhurst, BM Doube, VVSR Gupta eds., Biological Indicators of Soil Health. Wall-
ingford: CAB International, 1997, pp 97–120.
3. DS Jenkinson, JH Rayer. The turnover of soil organic matter in some of the Rothamsted
classical experiments. Soil Sci 123:298–305, 1977.
4. K Killham. Soil Ecology. Cambridge: Cambridge University Press, 1994.
5. GP Sparling, DJ Ross. Biochemical methods to estimate soil microbial biomass: Current devel-
opments and applications. In: K Mulangoy, R Merckx, eds. Soil Organic Matter Dynamics
and Sustainability of Tropical Agriculture. Chichester: Wiley, 1993, pp 21–37.
6. EA Paul. Dynamics of organic matter in soils. Plant Soil 76:275–285, 1984.
7. DS Powlson, PC Brookes, BT Christensen. Measurement of soil microbial biomass provides
an early indication of changes in total soil organic matter due to straw incorporation. Soil Biol
Biochem 19:159–164, 1987.
8. GP Sparling. Ratio of microbial biomass C to soil organic C as a sensitive indicator of changes
in soil organic matter. Aust J Soil Res 30:195–207, 1992.
9. PC Brookes, SP McGrath. Effects of metal toxicity on the size of the soil microbial biomass.
J Soil Sci 35:341–346, 1984
10. K Killham. A physiological determination of the impact of environmental stress on microbial
biomass. Environ Pollut Series B 38:283–294, 1985.
11. G Gianello, JM Bremner. Comparison of chemical methods of assessing potentially available
organic nitrogen in soil. Commun Soil Sci Plant Anal 17:215–236, 1986.
12. D Barraclough. The use of mean pool abundances to interpret
15
N tracer experiments. 1. The-
ory. Plant Soil 131:89–96, 1991.
13. M Richardson, ed. Environmental Toxicology Assessment. London: Taylor & Francis, 1995.
14. RG Burns, ed. Soil Enzymes. London: Academic Press, 1978.
15. RP Dick. Soil enzyme activities as integrative indicators of soil health. In: CE Pankhurst, BM
Doube, VVSR. Gupta, eds. Biological Indicators of Soil Health. Wallingford: CAB Interna-
tional, 1997, pp 121–156.
16. HG Song, R Bartha. Effects of jet fuel spills on the microbial community of soil. Appl Environ
Microbiol 56:646–651, 1990.
17. GW McCarty, R Siddaramappa, RJ Wright, EE Codling, G Gao. Evaluation of coal combus-
tion byproducts as soil liming materials: their influence on soil pH and enzyme activities. Biol
Fertil Soils 17:167–172, 1994.
18. DC White, SJ Macnaughton. Chemical and molecular approaches for rapid assessment of the
biological status of soils. In: CE Pankhurst, BM Doube, VVSR. Gupta, eds. Biological Indica-
tors of Soil Health. Wallingfored: CAB International, 1997, pp 371–396.
19. TM Embley, E Stackebrandt. The use of 16S ribosomal RNA sequences in microbial ecology.
In: RW Pickup, JR Saunders, eds. Ecological Approaches to Environmental Microbiology.
Oxford: Prentice Hall, 1996, pp 39–62.
20. WE Holben, BM Schroeter, VGM Calabrese, RH Olsen, JK Kukon, VO Biedirbeck, AE Smith,
JM Tiedje, Gene probe analysis of soil microbial populations selected by amendment with
2,4-dichloro-phenoxyacetic acid. Appl Environ Microbiol 58:3941–3948, 1992.
Copyright © 2002 Marcel Dekker, Inc.
21. GB Smith, JM Tiedje. Isolation and characterisation of a nitrate reductase gene and its use
as a probe for denitrifying bacteria. Appl Environ Microbiol 58:376–384, 1992.
22. JL Garland, AL Mills. Classification and characterisation of heterotrophic microbial communi-
ties on the basis of patterns of community-level-sole-carbon-source utilization. Appl Environ
Microb 57:2351–2359, 1991.
23. CE Pankhurst. Biodiversity of soil organisms as an indicator of soil health. In: CE Pankhurst,
BM Doube, VVSR Gupta, eds. Biological Indicators of Soil Health. Wallingford: CAB Inter-
national, 1997, pp 297–324.
24. F Schinner, R Ohlinger, E Kandeler, R Margesin, eds. Methods in Soil Biology. Berlin:
Springer, 1996, p 426.
25. VVSR Gupta, GW Yeates. Soil microfauna as bioindicators of soil health. In: CE Pankhurst,
BM Doube, VVSR Gupta, eds. Biological Indicators of Soil Health Wallingford: CAB Interna-
tional, 1997, pp 201–234.
26. W Foissner. Soil protozoa as bioindicators in ecosystems under human influence. In: JF Dar-
byshire, ed. Soil Protozoa. Wallingford: CAB International, 1994, pp 147–194.
27. Yeates, GW. Modification and qualification of the nematode maturity index. Pedobiologia 38:
97–101, 1994.
28. NM van Straalen, HA Verhoef. The development of a bioindicator system for soil acidity
based on arthropod pH preferences. J Appl Ecol 34: 1997.
29. BM Doube, O Schmidt. Can the abundance or activity of soil macrofauna be used to indicate
the biological health of soils? In: CE Pankhurst, BM Doube, VVSR Gupta, eds. Biological
Indicators of Soil Health. Wallingford: CAB International, 1997, pp 265–296.
30. KE Lee. Earthworms: Their Ecology and Relationships with Soils and Land Use. Sydney:
Academic Press, 1985.
31. CE Pankhurst, BM Doube, VVSR Gupta. Biological indicators of soil health-a synthesis. In:
CE Pankhurst, BM Doube, VVSR Gupta, eds. Biological Indicators of Soil Health. Wall-
ingford: CAB International, 1997, pp 419–436.
32. WHO Ernst. Geobotanical and biogeochemical prospecting for heavy metal deposits in Europe
and Afirca. In: B Market, ed. Plants as Biomonitors: Indicators for Heavy Metals in the Terrest-
iral Environment. VCH Weinheim, 1993, pp 107–126.
33. MZ Hauschild. Petrescine (1,4-diaminobutane) as an indicator of pollution-induced stress in
higher plants: Barley and rape stressed with Cr(III) or Cr(VI). Ecotoxicol Environ Saf 26:
228–247, 1993.
34. JM Morgan. Osmoregulation and water stress in higher plants. Ann Rev Plant Physiol 35:
299–348, 1984.
35. TA Smith. Polyamines. Ann Rev Plant Physiol 36:117–143, 1985.
36. F Van Assche, H Clijsters. Effects of metals on enzyme activity in plants. Plant Cell Environ
13:195–206, 1990.
37. Baker, AJM Accumulators and excluders strategies in the response of plants to heavy metals.
J Plant Nutr 3:643–654, 1981.
38. D van der Leslie, P Cortisier, W Baeyers, S Wuertz, L Diels, M Mergeay. The use of biosensors
in environmental monitoring. In: Bioremediation: Scientific and Technical Issues, 10th Forum
in Microbiology, 1994.
39. JI Prosser, EAS Rattray, K Killham, LA Glover. lux as a marker gene to track microbes.
In: ADL Akkermans, JD van Elsas, FJ de Bruijn eds. Molecular Microbial Ecology Manual.
Dordrecht: Kluwer, 1996.
40. GI Paton, EAS Rattray, CD Campbell, MS Cresser, LA Glover, JCL Meeussen, K Killham.
Use of genetically modified microbial biosensors for soil ecotoxicity testing. In: CE Pankhurst,
BM Doube, VVSR Gupta, eds. Biological Indicators of Soil Health. Wallingford: CAB Inter-
national, 1997, pp 397–418.
41. EAS Rattray, JI Prosser, K Killham, LA Glover. Luminescence-based non-extractive tech-
Copyright © 2002 Marcel Dekker, Inc.
niques for in situ detection of Escherichia coli in soil. Appl Environ Microbiol 56:3368–3374,
1990.
42. S Sousa, C Duffy, H Weitz, LA Glover, R Henkler, K Killham. Use of a lux-modified bacterial
biosensor to identify constraints to bioremediation of BTEX-contaminated sites. Environ Tox-
icol Chem 17:1039–1045, 1998.
43. TB Parkin. Spatial variability of microbial processes in soil—a review. J Environ Qual 22:
409–217, 1993.
44. JJ Halvorson, JL Smith, RI Papendick. Issues of scale for evaluating soil quality. J Soil Water
Conservation 1997, 52:26–30.
45. M Bonmati, B Ceccanti, P Nanniperi. Spatial variability of phosphatase, urease, protease,
organic carbon and total nitrogen in soil. Soil Biol Biochem 23:391–396, 1991.
46. TW Speir, DJ Ross, VA Orchard. Spatial variability on biochemical properties in a taxonomi-
cally-uniform soil under grazed pasture. Soil Biol Biochem 16:153–160, 1984.
47. P Goovaerts. Geostatistical tools for characterizing the spatial varaibility of microbiology and
physico-chemical soil properties. Biol Fertil Soils 27:315–334, 1998.
48. RE Rossi, DJ Mulla, AG Journel, EH Franz. Geostatistical tools for modelling and interpreting
ecological spatial dependence. Ecol Monogr 62:277–314, 1992.
49. BB Trangmar, RS Yost, G Uehara. Application of geostatistics to spatial studies of soil proper-
ties. Adv Agron 38:45–94, 1995.
50. R Webster. Quantitative spatial analysis of soil in the field. Adv Soil Sci 3:1–70, 1985.
51. JA Amador, AM Glucksman, JB Lyons, JH Go
¨
rres. Spatial distribution of soil phosphatase
activity within a riparian zone. Soil Sci 162:808–825, 1997.
52. DW Bergstrom, CM Monreal, JA Millette, DJ King. Spatial dependence of soil enzyme activi-
ties along a slope. Soil Sci Soc Am J 62:1302–1308, 1998.
53. WJ Staddon, MA Locke, RM Zablotowicz. Spatial variation of microbial and soil paremeters
relevant to herbicide fate. Weed Science Society of America, 39th Annual Meeting, San Diego,
1999.
54. B von Steiger, K Nowack, R Schulin. Spatial variation of urease activity measured on soil
monitoring. J Environ Quality 25:1285–1290, 1996.
55. SJ Morris. Spatial distribution of fungal and bacterial biomass in southern Ohio hardwood
forest soils: Fine scale variability and microscale patterns. Soil Biol Biochem 31:1375–1386,
1999.
56. C Cambardella, TB Moorman, JM Novak, TB Parkin, DL Karlen, RF Turco, AE Konopka.
Field-scale variability of soil properties in central Iowa soils. Soil Sci Soc Am J 58:1501–
1511, 1994.
57. JJ Halvorson, JL Smith, RI Papendick. Integration of multiple soil parameters to evaluate soil
quality: A field example. Biol Fertil Soils 21:207–214, 1996.
Copyright © 2002 Marcel Dekker, Inc.