Heavy Metals in the Environment - Chapter 4 pptx
Bạn đang xem bản rút gọn của tài liệu. Xem và tải ngay bản đầy đủ của tài liệu tại đây (501.56 KB, 26 trang )
4
Radionuclides in the Environment
David M. Taylor
Cardiff University, Cardiff, Wales
1. INTRODUCTION
A broad spectrum of radionuclides was produced following the creation of the
cosmos and those whose radioactive half-lives are long compared to the age of the
earth remain as ubiquitous components of today’s environment. These primeval
radionuclides include those of the uranium and thorium series, and their daughter
products, and
40
K (1). Another radioelement, plutonium, was formed in large
quantities in early supernova explosions, but because of the relatively short radio-
active half-lives of its principal isotopes, it is virtually extinct today; however,
some natural
239
Pu is present in the earth’s crust due to continuous production
by spontaneous neutron capture in
238
U (2,3). In addition, largely as a result of the
development of nuclear weapons and nuclear technology, a number of artificial
radionuclides, especially
134,137
Cs,
90
Sr, and
239
Pu, have been released to become
part of the human environment. This chapter discusses the concentrations of the
primeval radionuclides, especially those of the actinide elements and their radio-
active daughter products, and the nature of the radioactive environment in which
life developed on earth. The present distribution and concentrations of both natu-
ral and manmade radionuclides in the earth’s crust and the processes underlying
their transfer to plants animals and human beings are considered. The concentra-
tions of radionuclides that occur in human tissues are considered and discussed
Copyright © 2002 Marcel Dekker, Inc.
in terms of their possible long-term effects on human health. Although the empha-
sis is on radionuclides of heavy metals, it is also necessary to consider other
radioelements, metallic and nonmetallic, particularly those that are members of
the uranium and thorium decay chains, or are components of the fallout from
nuclear weapon testing.
2. RADIONUCLIDES IN THE ENVIRONMENT
Table 1 lists the known primeval radionuclides, together with their radioactive
half-lives and estimates of their present concentrations in the earth’s crust and
of their residual global radioactivity. Only two of the 17 elements listed in Table
1,
40
K and
82
Se, are known, or suspected, to be biologically essential. The alkali
metal potassium is, of course, an essential component of the human body and of
all other living organisms. The normal human body contains ϳ140 g of potassium
(4); of this only ϳ17 mg (ϳ480 mBq) is present as
40
K but this is sufficient to
deliver a radiation dose of ϳ150 µSv a
Ϫ1
to the average person, about half the
total annual dose from natural radionuclides incorporated into the body tissues
(5). Since the alkali metals
40
K and
87
Rb, together with
82
Se and
128,130
Te, cannot
T
ABLE
1 Concentrations and Residual Global Radioactivity of the
Primeval Radionuclides in the Earth’s Crust (1,6)
Elemental
Isotopic concentration
Half-life Principal abundance Residual global
Radionuclide Z (a) radiation (%) g/kg Bq/kg radioactivity (Bq)
40
K 19 1.2Eϩ09 β
Ϫ
0.01167 2.1Eϩ01 6.9EϪ02 1.6Eϩ21
82
Se 34 1.4Eϩ20 β
Ϫ
9.2 5EϪ05 5.1EϪ13 1.2Eϩ10
87
Rb 37 4.9Eϩ10 β
Ϫ
27.83 9.0EϪ02 2.2Eϩ01 5.2Eϩ23
113
Cd 48 9Eϩ15 β
Ϫ
12.2 1.5EϪ04 2.9EϪ08 6.9Eϩ14
115
In 49 5.1Eϩ14 β
Ϫ
95.7 2.5EϪ04 5.3EϪ05 1.2Eϩ18
128
Te 52 1.5Eϩ24 β
Ϫ
31.7 1EϪ06 7.4EϪ18 1.5Eϩ08
130
Te 52 2Eϩ21 β
Ϫ
34.5 1EϪ06 6.9EϪ15 1.8Eϩ05
138
La 57 1.1Eϩ11 β
Ϫ
0.089 3.9EϪ02 3.5EϪ05 8.2Eϩ17
144
Nd 60 2.1Eϩ15 α 23.8 4.1EϪ02 9.8EϪ05 2.3Eϩ18
147
Sm 62 1.1Eϩ11 α 15.1 7.0EϪ03 1.3EϪ01 3.1Eϩ21
148
Sm 62 8Eϩ15 α 11.3 7.0EϪ03 9.6EϪ07 2.3Eϩ16
152
Gd 64 1.1Eϩ14 α 0.21 6.2EϪ03 2.1EϪ08 4.9Eϩ14
176
Lu 71 3.6Eϩ10 α 2.61 8EϪ04 1.1EϪ04 2.7Eϩ18
174
Hf 72 2.0Eϩ15 α 0.16 3EϪ03 2.9EϪ10 6.8Eϩ12
187
Re 75 4Eϩ10 β
Ϫ
62.60 7EϪ07 4.8EϪ04 1.1Eϩ19
190
Pt 78 6Eϩ11 α 0.013 5EϪ06 9.7EϪ10 2.3Eϩ13
232
Th 90 1.5Eϩ10 α 100 9.6EϪ03 3.9Eϩ01 9.2Eϩ23
235
U 92 7.0Eϩ08 α 0.720 2.7EϪ03 1.1EϪ02 2.6Eϩ20
238
U 92 4.5Eϩ09 α 99.27 2.7EϪ03 3.3Eϩ01 7.8Eϩ23
239
Pu 94 2.4Eϩ04 α 100 2.4EϪ14 4.6EϪ08 1.1Eϩ15
244
Pu 94 8.3Eϩ7 α 3EϪ25 2EϪ22 5Eϩ00
Copyright © 2002 Marcel Dekker, Inc.
be classified as heavy metals, these primeval radionuclides will not be discussed
further in this chapter.
All the primeval radionuclides are ubiquitous components of the earth’s
crust,oceans,andothernaturalwaters.Table1showsthat,exceptfor
235
U,
238
U,
239
Pu, and
244
Pu, their radioactive half-lives are so long compared to the age of
the earth, ϳ4.5E ϩ 09 a, that their concentrations will have remained virtually
unchanged throughout the evolution of life on the planet. Because of the presence
of these primeval radionuclides in the earth’s crust and oceans all forms of life
evolved in an environment of ionizing radiation. Adding up the figures in the
last column indicates that the global residual radioactivity from the primeval
radionuclides in the earth’s crust amounts to ϳ2 million EBq (ϳ2.10
24
Bq); this
is an enormous amount of radioactivity, many orders of magnitude greater than
the manmade radioactivity produced since the beginning of the nuclear age in
the 1940s.
Varying fractions of the primeval radionuclides enter the atmosphere in the
form of fine dust particles or aerosols that may be deposited directly on growing
vegetation or be inhaled directly by humans and other animals. Transfer within
the biosphere depends on many factors, chemical, biochemical, and physical, and
an important question is how large are the quantities of these natural radionuclides
that enter the human food chain and are incorporated into the human body? Envi-
ronmental radionuclides can enter the human body by two routes, inhalation of
respirable dust particles or aerosols, and through food and water. The relative
importance of these two uptake routes will vary with the element, but for radioele-
ments such as thorium and plutonium, whose absorption from the human gastro-
intestinal tract is very low, inhalation may in fact become the major entry path-
way. This will be discussed later as the specific elements are discussed.
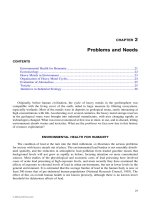
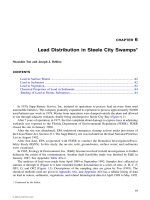
Figure1showstheremainingprimevalradionuclideswiththeirposition
in the periodic table. It can be seen that 10 of the total of 21 radionuclides are
members of the lanthanide and actinide series of elements whose geo- and bioin-
organic chemistry exhibits a number of similarities. The information on the occur-
rence of each of the radionuclides in the environment and in humans will now
be reviewed.
3. THE BIOINORGANIC CHEMISTRY OF THE RESIDUAL
PRIMEVAL RADIONUCLIDES
3.1 Cadmium
Cadmium is the 64th most abundant element in the earth’s crust (6). Cadmium
minerals are rare and the element occurs by isomorphous displacement in almost
all zinc ores, the most common of which is sphalerite, (ZnFe)S (7). The predomi-
nant oxidation state is Cd(II) and this is the oxidation state to be expected in all
environmental situations. The cadmium concentration in the earth’s crust is ϳ150
Copyright © 2002 Marcel Dekker, Inc.
F
IGURE
1 The periodic table of the elements indicating the remaining prime-
val radioelements.
µgkg
Ϫ1
(6) and that in seawater is ϳ3 orders of magnitude lower at ϳ110 ng
dm
Ϫ3
. The fraction of the radioactive isotope
113
Cd in the total cadmium is 12.2%
(Table1).Thezincconcentrationsinboththeearth’scrustandtheoceansare
about 100-fold greater than those of cadmium, and a similar Zn/Cd ratio is also
found in biological materials, including human and animal tissues. Cadmium is
taken up readily from the soil and water by many plants, and in edible fungi such
as mushrooms levels may reach mg kg
Ϫ1
fresh weight. The daily intake of cad-
mium in the human diet and drinking water is ϳ150 µgd
Ϫ1
(8); of this ϳ5%
may be expected to be absorbed from the gastrointestinal tract (8,9). Cadmium
in tobacco leaves contributes to increased levels of the metal in the bodies of
smokers. Because cadmium is a potentially highly toxic metal, its levels in human
tissues have been widely studied (8–10). The whole-body content of cadmium
ranges from ϳ30 to 50 mg, of which ϳ15%, 35%, and 35%, respectively, are
located in the liver, kidneys, and skeleton. The whole-body content of
113
Cd is
calculated to be ϳ50–80 µBq; this means that on average 1 atom will disintegrate
somewhere in the human body about every 4 h, thereby releasing a β
Ϫ
particle
with an energy of 91 keV. This amount of energy, when deposited in the human
body, will deliver a lifetime radiation dose, a committed effective dose (CED)
(9), of ϳ10 pSv, or about 9 orders of magnitude less than that from the pri-
meval
40
K.
3.2 Indium
Indium, with a concentration of ϳ250 µgkg
Ϫ1
in the earth’s crust, has a slightly
greater abundance than that of cadmium (6). Indium is assigned, together with
Copyright © 2002 Marcel Dekker, Inc.
aluminumandgallium,toGroup13oftheperiodictable(Fig.1),andincommon
with these latter metals the predominant oxidation state is In(III) (7). In the earth’s
crust traces of indium, ϽϽ1%, occur in aluminum and zinc ores. In contrast to
cadmium, indium has few industrial or medical applications and, in consequence,
it has attracted little environmental or toxicological interest and its concentrations
in natural waters, or in plant, animal, or human tissues have been little studied.
Consequently there is virtually no direct information on which an assessment of
the indium content of the human body can be made. Experimental studies in
animals suggest that the absorption of indium from the gastrointestinal tract is
about 2% (9). Since, like aluminum, indium occurs in the earth’s crust in silicates,
such as micas and feldspars, and in minerals like bauxite (a hydroxo oxide) and
cryolite (NaAlF
6
), which are not very soluble, its transfer from the soil into the
food chain and thence into the human body is likely to be very low. A rough
assessment of the indium content of the human body can be made from the alumi-
num content and the relative abundance of the two elements in the earth’s crust.
The aluminum content of the human body is ϳ60–100 mg, or a concentration
of ϳ1.2 mg kg
Ϫ1
(4,10); the aluminum content of the earth’s crust is 82.3 g kg
Ϫ1
(6), suggesting a concentration factor (CF) of ϳ7EϪ04. Assuming that this factor
would also apply to the intake of indium and allowing for a fivefold lower absorp-
tion from the gastrointestinal tract, its concentration in the human body might
be ϳ100 ng. Studies with
111
In in animals and humans show that ϳ30% of the
nuclide deposits in bone and ϳ20% in liver (11). In the blood plasma, indium
is transported on the iron-transport protein transferrin, to which it binds very
strongly (12). Assuming that the human body contains 100 ng indium, the radio-
activity of the
115
In would be ϳ20 nBq. These estimated body contents of both
total indium and
115
In must be recognized as having large uncertainties and it
would be wise to assume that the actual levels that might be measured in individ-
ual members of the population would lie in the range 10–1000 ng (2–1000 nBq).
The presence of 20 nBq of primeval
115
In in the human body would correspond
to the decay of 1 atom, with the emission of a β
Ϫ
particle of 153 keV every 250
days, or a lifetime CED of ϳ5 nSv.
3.3 Hafnium
The chemistry of hafnium is almost identical to that of its companion Group 4
element zirconium; thus hafnium, as Hf(IV), occurs in all zirconium minerals
(7). These minerals are widely distributed in the earth’s crust and are not concen-
trated into major deposits (7). The average concentration of hafnium in the earth’s
crust has been estimated to be 3.0 mg kg
Ϫ1
(6), making it of comparable abun-
dance to uranium and many of the lanthanide elements; in contrast zirconium is
present at 165 mg kg
Ϫ1
. The microchemical analysis of hafnium is difficult and
this difficulty is reflected by the paucity of information on its concentrations in
Copyright © 2002 Marcel Dekker, Inc.
natural waters or in plant, animal, or human tissues. The daily intake of zirconium
in the human diet and drinking water is estimated to be 4.2 mg d
Ϫ1
(8); thus, on
the basis of their relative abundances, that of hafnium might be ϳ0.1 mg d
Ϫ1
.
Experimental studies in animals indicate that the absorption of hafnium from the
gastrointestinal tract is very low, ϳ0.05% (9), and that the major sites of deposi-
tion are the skeleton (ϳ25%) and liver (ϳ5%) (13,14). Like indium, Hf(IV) is
also associated with transferrin in the blood plasma (12). The zirconium content
of the human body has been estimated to be 420 mg (8); this implies a concentra-
tion factor of ϳ4E–02; thus by simple analogy based on the close chemical simi-
larities between hafnium and zirconium, the body content of hafnium might be
of the order of 100 µg. A body content of 100 µg hafnium would correspond to
ϳ10 pBq of
174
Hf. These estimated body contents of both total hafnium and
174
Hf
must be recognized as having large uncertainties and it would be wise to assume
that the actual levels that might be measured in individual members of the popula-
tion would lie in the range 1–1000 µg (1–100 pBq
174
Hf). A body content of 10
pBq
174
Hf would result in less than 1 α-particle of 2.5 MeV being emitted in a
human lifetime.
3.4 Rhenium
Rhenium lies in Group 7 of the periodic table, together with manganese and
technetium(Fig.1).Theabundanceofrheniumintheearth’scrustisϳ700µg
kg
Ϫ1
(6). The element appears together with molybdenum in various ores as the
sulphide ReS
2
or as the oxide Re
2
O
7
. Rhenium can exist in various oxidation
states between Ϫ1 and ϩ7 and the Re(IV) and Re(VII) states are probably the
most important from the environmental point of view (7). In seawater the element
believed to be present in very low concentrations is the perrhenate ion, ReO
4
Ϫ
.
Rhenium is produced and purified industrially for use as an oxidation catalyst,
or as filaments and coatings in electronic and electrical equipment. However,
the rarity and the high cost of the pure metal combine to prevent widespread
environmental contamination or toxicological concern; thus there is little or no
information on the concentrations of rhenium in vegetation or in animal and hu-
man tissues. Recent interest in the use of
188
Re for the treatment of cancer has
prompted some studies of the biodistribution of this radionuclide in experimental
animals (15), but these cannot yield any information on the normal concentrations
of the element in the tissues or whole body. Radionuclide studies with [
188
Re]-
ReO
4
Ϫ
in animals indicate that there is virtually complete absorption from the
gastrointestinal tract and that of the absorbed radionuclide; ϳ30% is deposited
in the liver, 4% in the thyroid, and 1% in the stomach wall; the remainder is
assumed to divide equally among all other tissues (11).
The whole-body content of rhenium has not been measured; assuming a
fairly conservative CF of 1E–04, it could be predicted that the rhenium content
Copyright © 2002 Marcel Dekker, Inc.
of the whole body might be of the order of 100 pg, of which ϳ20 pg might be
in the liver. This latter value would correspond to the presence of ϳ50 nBq of
primeval
187
Re in the human body and to the emission of a single 0.66-keV β-
particle about every one and a half years.
3.5 Platinum
Platinum, like rhenium, is a rare element with a concentration of only ϳ5 µg
kg
Ϫ1
in the earth’s crust (6). The metal has no known essential physiological
role, although in recent years cis-diaminodichloro-platinum and other platinum
complexes have become first-line drugs in the treatment of certain types of can-
cer. Studies with radioactive cis-diaminodichloro-platinum indicate that about
10% of the radionuclide deposits in the liver and a further 10% in the kidney,
the remainder being more or less equally distributed in the other tissues (16). No
information on the natural concentrations of platinum in biological materials,
including human tissues, appears to be available; however, it seems unlikely that
the tissue concentrations will be markedly different from those of gold, which
has a similar abundance in the earth’s crust (6). Gold concentrations in human
liver, lungs, and skeleton have been measured (17,18) and these indicate a total
body content of ϳ1–30 µg. A whole-body platinum content of 30 µg would
include ϳ60 pBq
190
Pt; this would correspond to the emission of less than 1 α-
particle in a human lifetime.
3.6 The Primeval Lanthanides
Theprimevalradionuclides
138
La,
144
Nd,
147
Sm,
148
Sm,
152
Gd,and
176
Lu(Fig.1)
are members of the lanthanide series of elements. The natural abundance of these
elements in the earth’s crust ranges from ϳ40 mg kg
Ϫ1
for lanthanum and neo-
dymium to 0.8 mg kg
Ϫ1
for lutetium; concentrations in seawater are 6 or 7 orders
of magnitude lower than those in the earth’s crust (6). Although the lanthanides
have no known essential or potentially beneficial biological function, they are of
biochemical and medical interest and their biodistribution and biokinetic behavior
in animals and plants has been quite widely studied (19). The analysis of lantha-
nides at levels of Ͻ1 µgkg
Ϫ1
is very difficult, and even with the best modern
analytical methods, such as ICP-MS, ICP-AES, or neutron activation analysis,
the published results show very large standard deviations, and the data are not
always consistent, either from sample to sample or from element to element (19).
In human organs there is also evidence that diseases such as cancer, cirrhosis
of the liver, and myocardial infarction may increase lanthanide levels in some
tissues (19).
Radionuclide studies in experimental animals indicate that the liver and
skeleton are the major sites of deposition, accounting for 80% of the lanthanide
that enters the systemic circulation (20,21); Durbin (20) has pointed out that liver
Copyright © 2002 Marcel Dekker, Inc.
deposition appears to decrease approximately linearly with increasing atomic ra-
dius of the lanthanide, while the skeletal content increases. The available data are
far from complete and present only a general picture of the behavior of lanthanide
elements in plants and tissues.
There are no comprehensive reports of measurements of lanthanides in food
crops or animals and human tissues. The principal uptake route into plants and
animals is by leaching of lanthanides from minerals into the groundwater, and
also by the formation of respirable aerosols. Measurement of lanthanide concen-
trations in crops taken from a high background region of Brazil indicated levels
ranging from Ͻ1toϳ700 µgkg
Ϫ1
in vegetables (19). Comparing the lanthanide
concentration in foodstuffs with those in the earth’s crust led Evans to suggest
a concentration ratio for lanthanides ranging from 1E–03 to 1E–05 (19). Since
the fractional absorption of lanthanides from the human gastrointestinal tract ap-
pears to be ϳ5E–04 (7), the overall concentration ratio for humans might be
expected to lie in the range 1E–07 to 1E–09.
If this assumption were true, the lanthanide concentrations in human tissues
would be expected to lie in the ng-pg range. However, the sparse measurements
of human tissues suggest higher concentrations; measurements of lanthanide con-
centrations in human spleen ranged from ϳ3toϳ900 µgLakg
Ϫ1
fresh weight
to 0–40 µgkg
Ϫ1
for Sm (19). Neutron activation analysis of nonexposed human
lung revealed mean values of 16.6, 46.2, 2.5, and 0.46 µgkg
Ϫ1
fresh weight for
La, Nd, Sm, and Lu, respectively (19). Lanthanum concentrations of 4.5 and 5.5
µgkg
Ϫ1
, respectively, were reported in the lungs and liver of deceased smelter
workers (19). Hamilton et al. (23), using mass spectrometry, reported lanthanum
concentrations of 80 and 10 µgkg
Ϫ1
, respectively, in liver and lung. McAughey
(24), using ICP-AES, found that the daily urinary excretion of La, Sm, Gd, and
Nd lay in the range 0 to ϳ150 ng d
Ϫ1
. These liver and urinary values would
be consistent with a total body content of ϳ200–1000 µg. However, even
assuming a body content of 1 mg for each of the lanthanides of interest, the
radioactivity would correspond to 0.5 µBq
138
La, 2.8 µBq
144
Nd, 19 mBq
147
Sm,
0.1 µBq
148
Sm, 3.4 µBq
152
Gd, and 143 µBq
176
Lu; in no case would this result
in a CED Ͼ 1 µSv.
4. THE BIOINORGANIC CHEMISTRY OF THE PRIMEVAL
ACTINIDES
4.1 Thorium and Uranium
After
40
K, the primeval actinides and their daughter products are the largest
source of the natural radioactivity of mankind and the human environment. Of
all the primeval actinides,
232
Th is the most abundant with an average concentra-
tion of 9.6 mg (39 Bq) kg
Ϫ1
in the earth’s crust (6). However, concentrations
may vary from region to region and a realistic range might be Ͻ0.5–Ͼ20 mg
Copyright © 2002 Marcel Dekker, Inc.
kg
Ϫ1
. Concentrations in seawater, at ϳ1ngkg
Ϫ1
, are, however, about 7 orders
of magnitude lower, reflecting both the poor solubility of Th(IV), the predominant
oxidation state, and its lower concentration in the mafic rocks of the ocean crust.
The concentration of
238
U, the longest-lived uranium isotope, in the earth’s crust
is 2.7 mg kg
Ϫ1
(6), about 4 times lower than that of
232
Th; however, the radioactiv-
ity in the earth’s crust due to
235
U is 33 mBq kg
Ϫ1
, only slightly less than that
of
232
Th. The concentration of
238
U in seawater is 3.2 µgkg
Ϫ1
, some 3000 times
greater than that of thorium, largely reflecting the greater solubility of uranium
minerals as compared to those of thorium. The second primeval isotope of ura-
nium,
235
U(T
1/2
7.038.10
4
a), has an isotopic abundance of only 0.72%, but its
radioactivity is 11 mBq kg
Ϫ1
in the earth’s crust.
Thorium-232 and
238
U, as well as most of their daughter products, emit α-
particles, which, if they are emitted within the human or animal body, may be
highly radiotoxic (5). There has, therefore, been considerable interest in the con-
centrations of the isotopes of the thorium and uranium decay series that are pres-
ent in the human diet and in the bodies of humans and animals.
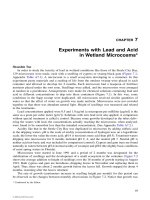
4.1.1 The Radioactive Decay of
232
Th and
238
U
Thorium-232 decays by α-particle emission to
228
Ra (T
1/2
5.76 a) and thence to
228
Th (T
1/2
1.913 a),
228
Ra (T
1/2
6.7 a),
224
Ra (T
1/2
3.64 d),
220
Rn (thoron) (T
1/2
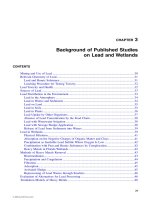
54.5s),and,finally,throughfurtheremissionofα-particles,tostable
208
Pb(Fig.
2). All the daughters of
232
Th have physical half-lives of Ͻ6 a; thus, even geologi-
cally young thorium-containing minerals and rocks will contain the whole radio-
active series in equilibrium (1). Primeval
238
U also decays by α-particle emission
to
234
Th (T
1/2
24 days) and thence by β-particle emission to
234
Pa (T
1/2
1.1 min)
and through successive α-particle decays to
234
U,
230
Th, and
226
Ra to stable
210
Pb.
Uranium-235 decays by α-particle emission to
231
Pa (T
1/2
3.43 10
4
a) and thence
by emission of a β-particle to
231
Th (T
1/2
25.6 h) and through further α-particle
emissions to stable
207
Pb. Thus the radiochemistry of both
235
U and
238
U also
involves that of thorium.
There are two important daughter products of
226
Ra and
228
Ra, the gaseous
radionuclides
222
Rn and
220
Rn, which diffuse out of the minerals into groundwater
and to the atmosphere and add radioactivity to each through both themselves and
their radioactive daughters (3). Since both
226
Ra,
228
Ra,
222
Rn, and
220
Rn are highly
radiotoxic nuclides, capable of causing cancers of lung and bone, their behavior
in the environment and in humans is considered below, even though they are not
heavy metals.
4.1.2 Thorium and Uranium Isotopes in the Human
Food Chain
Thorium-232,
238
U, and their decay products are present in at least trace concen-
trations in virtually all terrestrial and marine biota, and their concentrations in
various types of foodstuff and drinking waters have been quite widely studied.
Copyright © 2002 Marcel Dekker, Inc.
F
IGURE
2 The radioactive decay of
232
Th and
238
U.
Table2listssomeillustrative,androunded,valuesfortheconcentrationsof
230
Th,
232
Th,
234
U,
235
U,
238
U, and
226
Ra in some of the most important foodstuffs. These
values are derived from the studies of Fisenne et al. (25), Shiraishi et al. (26)
and Yu and Mao (27) in the New York City, Ukrainian, and Japanese diets;
the values are also comparable with those of other studies (25–30). The highest
concentrations listed in Table 2 are for shellfish. There are, however, variations
that may reflect regional differences; for example, Yu and Mao (27) reported
that in six varieties of fish obtained from the Hong Kong fish market the concen-
trations of
232
Th and
238
U were below the detection limits. Pronounced regional
differences in the
238
U concentrations in drinking water between New York City,
Salt Lake City, Utah, and Hong Kong are evident from Table 2.
Comparison of the estimated daily dietary intakes of thorium and uranium
in various countries across the Northern Hemisphere indicates that average intake
may range from ϳ2to10µBq (0.5–2.5 µg) for
232
Th and from ϳ7to60µBq
(ϳ0.5–5 mg) for
238
U. In thorium and uranium mineral-rich regions, intakes may
Copyright © 2002 Marcel Dekker, Inc.
T
ABLE
2 Illustrative Values for the Concentrations of Primeval Actinides
and Their Decay Products in Some Foodstuffs
mBq kg
Ϫ1
Foodstuff
226
Ra
230
Th
232
Th
234
U
235
U
238
U
Dairy products 6 0.4 0.3 1 0.05 0.7
Fresh vegetables 60 20 18 23 1 25
Root vegetables 15 1 1 12 0.1 8
Fresh fruit 50 0.1 0.1 2 2
Meat 2 3 2 2 0.02 2
Fish 30 1 1 20 0.4 15
Shellfish 60 30 30 2200 90 1900
Bread and grain products 100 10 3 30 1 23
Drinking water, NYC 0.4 0.1 0.05 1 0.03 0.9
Drinking water, SLC 18
Drinking water, HK 4 7 79
NYC ϭ New York City; SLC ϭ Salt Lake City; HK ϭ Hong Kong. The values are derived
from refs. 25–30. The coefficients of variation on the reported values range from ϳ4
to Ͼ40%, but a realistic concentration range probably lies between 0.1 and 10 times
the values shown.
beordersofmagnitudehigher(28–30).Table3,whichisrecalculatedfromthe
dataofFisenneetal.(25)andYuandMao (27),comparesthefractionsof the
dailyintakesof
230,232
Th,
235,238
U,and
226
Raduetodiet,drinkingwater,andinhala-
tion for New York City and Hong Kong residents.
The data in Table3indicatethatforNewYorkCity,ϳ98%ofthedaily
intakeof
226
Raand
230,232
Thwasderivedfromthe diet, 1–2% from the drinking
water, and Ͻ0.15% by inhalation; the corresponding figures for
234,235,238
U were
ϳ92% from the diet, ϳ8% from drinking water, and ϳ0.1% by inhalation. How-
ever, the thorium and uranium concentrations in New York City drinking water
are low and the data of Yu and Mao (27) indicate that in Hong Kong, where the
drinking water concentration of uranium is 80 times greater, ϳ22% of the daily
intake of
226
Ra and ϳ40% of the
238
U are derived from drinking water.
4.1.3 Thorium and Uranium in the Human Body
Wrenn et al. (31,32) have provided the most comprehensive set of data on thorium
isotopes in human tissues taken at autopsy from cases of sudden accidental death.
Some further data are given for the concentrations of
232
Th,
230
Th, and
228
Th in
the lungs and bones of persons living in high and normal radiation background
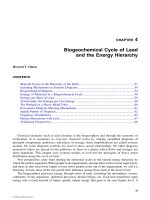
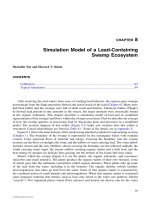
regionsofChina(33).Figure3showsthewhole-bodycontentsof
228
Th,
230
Th,
and
232
Th (Fig. 3a), and for total thorium (Fig. 3b), calculated from these data.
Copyright © 2002 Marcel Dekker, Inc.
T
ABLE
3 Average Daily Intake of
230,232
Th,
234,235,238
U, and
226
Ra by Ingestion
in Food and Water and by Inhalation in the United States and China
(31,33)
mBq Person
Ϫ1
d
Ϫ1
226
Ra
230
Th
232
Th
234
U
235
U
238
U
New York City
Food 51.2 6.06 4.07 16.8 0.7 14.7
Water 0.6 0.18 0.07 1.5 0.05 1.2
Air 0.01 0.01 0.01 0.02 0.0007 0.02
Total 51.81 6.25 4.15 18.3 0.751 15.9
Hong Kong
Food 7.8 43
Water 2.2 26
Air — —
Total 10.0 69
There were no clear differences in the body content of residents of the mining
area of Grand Junction and urban Washington, DC, and the calculated body con-
tents are about an order of magnitude lower than those for residents of Beijing.
However,ascanbeseenfromFigure3a,thebodycontentsofallthethorium
radionuclides in the residents of the high natural radiation background areas of
China are 10–100 times larger than those observed in Beijing or the United States.
The concentrations of thorium and uranium in the surface soil of the high back-
ground areas are 60.4 Ϯ 28.6 and 7.7 Ϯ 1.7 mg kg
Ϫ1
, respectively, compared to
7.9 Ϯ 3.2 mg Th and 1.7 Ϯ 0.7 mg U kg
Ϫ1
in the control area (33). Figure 3a also
shows that, for each location, the radionuclides
232
Th,
230
Th, and
228
Th contribute
broadly similar numbers of mBq to the total-body radioactivity; however, owing
to their much higher specific activities, the contribution of
230
Th and
228
Th to the
total mass of thorium in the body is less than 1 ng. There are differences in the
ratios of
232
Th,
230
Th, and
228
Th at the different locations, and these may reflect
past or present mining and other civilization-related activities. Wrenn et al. (31)
suggest that the
230
Th and
232
Th in the human body is derived largely by inhalation
of suspended particulates, while the
228
Th arises from ingestion in the diet and
by ‘‘ingrowth’’ from the decay of
228
Ra. The presence of ϳ100 mBq
232
Th in
the human body would result in the emission of ϳ9000 α-particles d
Ϫ1
.
Within the body, thorium exists as Th(IV); about 60% deposits in bone,
partly in the hydroxyapatite matrix, but predominantly on bone surfaces within
α-particle range of radiosensitive cells, which could give rise to radiation-induced
bone cancer (34–36). The liver contains ϳ4% of the body thorium, mainly depos-
Copyright © 2002 Marcel Dekker, Inc.
F
IGURE
3 The total-body content of thorium in the human body in different
regions of the world. (a) The mean body contents, measured in mBq, in for-
mer residents of Washington, DC (USA-DC), Grand Junction, Colorado (USA-
GJCO) (31,32), Beijing, China, and the high background radiation areas of the
Guangdong Province of China (33). (b) The same data for the total mass of
thorium, which is essentially all contributed by
232
Th.
Copyright © 2002 Marcel Dekker, Inc.
ited in lysosomal structures, frequently in association with the iron storage protein
ferritin (35,36). In the blood plasma thorium appears to be transported on the
iron-transport protein transferrin (12,37).
Review of the information on the uranium content of the human body (38)
indicates a total-body content of ϳ20 µg; this is illustrated in Figure 4, which
also shows similar data for plutonium and radium. The total uranium content of
thebodyissimilartothatofthorium(Figs.3and4).Sincethenaturalabundance
of thorium in the earth’s crust is about four times greater than that of uranium
(Table 1), the similarity in the total body content of the two elements probably
reflects the greater mobility of uranium. Limited data from seven countries across
the world indicate that the total uranium content of the human skeleton, the organ
in which ϳ95% of the body content is located (8), may range from Ͻ1toϳ770
µg (31). A total-body content of 20 µg
238
U would correspond to a radioactivity
of ϳ250 mBq, or the emission of ϳ20000 α-particles d
Ϫ1
.
The uranium in the body is most probably in the hexavalent form, [UO
2
]
2ϩ
,
F
IGURE
4 The estimated total-body contents of uranium,
226
Ra, and pluto-
nium in the adult human body (2,38,40); the data are given as both mBq and
µg.
Copyright © 2002 Marcel Dekker, Inc.
which in bone exchanges with Ca
2ϩ
ions on the surface of the hydroxyapatite
crystals of the bone mineral (34). The uranium in bone is fairly rapidly lost to
the plasma, with a half-life of ϳ150 days (34). In the blood plasma uranium has
also been shown to be associated with transferrin (12,37).
4.2 Plutonium
Both
244
Pu (T
1/2
8.3. 10
7
a) and
239
Pu (T
1/2
2.4.10
4
a) were primeval radionuclides,
but because of their short half-lives on a cosmic scale only minute traces of
244
Pu
survive today. The present-day abundance of
244
Pu in the earth’s crust has been
estimated to range from ϳ7.10
Ϫ24
to ϳ3.10
Ϫ22
gkg
Ϫ1
(34). Assuming that all this
plutonium was primeval, and that the earth’s crust has a mass of 2.367.10
22
kg
(6), the total residual cosmogenic
244
Pu today might range from ϳ0.2 g to ϳ7g
(2,40). However, there has been continuous, low-level production of
239
Pu from
238
U by spontaneous fission since the formation of the earth, according to the
reaction:
238
U(n,γ)
239
U →
β
23 min
239
Np →
β
2.3 days
239
Pu
Assuming secular equilibrium and a
239
Pu/
238
U ratio of (1.5 Ϯ 0.2) ϫ 10
Ϫ11
,the
rate of formation of
239
Pu corresponds to a total annual production of ϳ28 kg in
the entire earth’s crust (40,41).
On the basis of an average uranium concentration of 2.7.10
Ϫ3
gkg
Ϫ1
in the
earth’s crust (6), the average
239
Pu concentration would be ϳ40 fg kg
Ϫ1
, and this
is, presumably, the plutonium concentration that has been present through-
out the evolution of life. This is a very low concentration compared with that of
thorium, ϳ9.6 mg kg
Ϫ1
Th kg
Ϫ1
(6), and since the chemistry of tetravalent pluto-
nium, its most stable oxidation state, and tetravalent thorium resemble each other
very closely, the geochemistry of the natural
244
Pu may well have followed that
of thorium, rather than pursuing its own specific chemistry.
Since the birth of the nuclear age in 1945, some 6 tons of
239
Pu have been
released into the earth’s atmosphere, predominantly by the atmospheric nuclear
weapons testing carried out in the 1950s and 1960s (42). The fallout plutonium
from nuclear weapons testing was distributed unevenly between the Northern and
Southern Hemispheres, with the deposition in the Northern Hemisphere being
more than 3 times greater than that in the Southern Hemisphere (43). The concen-
trations of fallout
239,240
Pu in the upper layers of the earth’s crust in 1970–71
were 3 ng kg
Ϫ1
(ϳ7Bqkg
Ϫ1
) in the Northern, and 0.6 ng kg
Ϫ1
(ϳ1Bqkg
Ϫ1
)in
the Southern Hemisphere. Orders of magnitude higher levels of soil contamina-
tion with
239
Pu may be found in the region of nuclear test sites or nuclear-fuel-
processing sites (38). This plutonium is almost certainly relatively immobile and
the ratios of the amount of plutonium in the earth’s crust to that incorporated
into vegetation and animals, including humans, are probably ϽϽ10
Ϫ7
.
Copyright © 2002 Marcel Dekker, Inc.
Like the other actinide radionuclides, environmental plutonium can enter
the human body by inhalation, and through food and water. While the food chain
is probably the predominant source of the natural
239
Pu in the human body, the
major route of entry of fallout plutonium into humans and animals has been by
inhalation (42).
Taylor (2), using the available published data from measurements in tissues
collected at autopsy, calculated median whole-body contents of
239,240
Pu in former
residents of various countries in the Northern Hemisphere who died between
1959 and 1976; the values ranged from 35 mBq in southern Finland to 179 mBq
in Japan with a population-weighted median value of 74 mBq (ϳ30 pg)
239
Pu
(Fig.4),avalueatleast5ordersofmagnitudegreaterthanthecalculatedϽ500
ag base load of natural plutonium in the human body (2).
The decreasing levels of
239,240
Pu intake since the late 1960s, especially by
inhalation, mean that persons born after the cessation of atmospheric weapons
testing in about 1970 will have much lower body burdens. Calculations suggest
that for persons born in 1970 the fallout
239,240
Pu content of the human body would
be ϳ3 mBq (ϳ1pgorϳ5 fmol Pu). Such levels will be very difficult to confirm
by direct measurements of autopsy material, even using modern mass spectromet-
ric methods, which offer detection limits of about 0.5 µBq per sample (46).
Large accidental releases of plutonium into the environment can cause sig-
nificant local or regional increases in population intake. For example, the Cherno-
byl accident, which released some 61 TBq of
239,240
Pu into the northern European
environment, may have increased the body content of the people of the Bialystok
region of Poland by ϳ6 mBq (40,46). Compared to the median value of 74 mBq
for the amount of plutonium in the bodies of persons who had lived through the
whole period of fallout from weapons testing, this Chernobyl-related increase in
body content is quite small; however, for the young people of this region who
were born after 1970, the Chernobyl-related intake could have more than doubled
their body burden (40). The 74-mBq civilization-related load of
239,240
Pu in the
human body corresponds to the emission of ϳ6000 α-particles d
Ϫ1
.
5. THE BIOINORGANIC CHEMISTRY OF RADIUM
AND RADON
5.1 Radium
In undisturbed uranium and thorium ores, radioactive equilibrium is established
between the parent
238
Uor
232
Th and the daughter products in the decay chain.
The decay chains pass through
226
Ra (T
1/2
1600 a) and
228
Ra (T
1/2
5.7 a), respec-
tively,tostable
206
Pbor
208
Pb(Fig.2),atratescorrespondingtotheamountsof
the parent radionuclides in the ore. As long as the ore remains undisturbed, radio-
active equilibrium is maintained. Radium, as a member of the alkaline earth group
of metals, would be expected to exhibit chemical behavior broadly similar to that
Copyright © 2002 Marcel Dekker, Inc.
of calcium. The radium and radon concentrations in the earth’s crust are said to
average 900 pg kg
Ϫ1
and 400 fg, respectively, concentrations in seawater being
3–4 orders of magnitude lower (6).
Tracy et al. (47) measured the uptake of
226
Ra into garden produce grown
on soils containing 2.5–830 ng
226
Ra kg
Ϫ1
and showed that the CF for soil-to-
plant transfer ranged from ϳ800 to ϳ1300. Radium is present in all foodstuffs
at concentrations ranging from 0.74 to 6.5 pg kg
Ϫ1
(Tables 2 and 3); drinking
water concentrations range from ϳ0.07 to 8 pg kg
Ϫ1
, but drinking water accounts
for only ϳ10% of the daily intake (8). Yu and Mao (27) measured
226
Ra and
228
Ra concentrations in a range of foodstuffs from Hong Kong and reported con-
centrations ranging from 0.3 to 39 mBq kg
Ϫ1
for each radionuclide. The daily
intake in food and drink was estimated to be ϳ27 mBq (0.7 pg) person
Ϫ1
for
226
Ra and ϳ70 mBq (ϳ8 fg) person
Ϫ1
for
228
Ra. Fisenne et al. (25) measured
226
Ra in the diet of New York City dwellers in 1978 and reported concentrations
ranging from 2 to 104 mBq kg
Ϫ1
; the daily intake was assessed at 52 mBq (1.4
pg) d
Ϫ1
for
226
Ra and 35 mBq (3.9 fg) d
Ϫ1
for
228
Ra (Table 4). Estimates of daily
dietary intake of
226
Ra in other geographical locations range from 0.7 to 3 pg d
Ϫ1
(8). The absorption of radium from the human gastrointestinal tract is assumed
to average 20% (9). Radium absorbed from the gastrointestinal tract deposits
mainly in the skeleton, where like calcium it is laid down in the hydroxyapatite
of the bone mineral.
Comparison of the concentrations of
226
Ra measured in human bone sam-
ples collected from various countries across the world indicate a range from ϳ80
to 800 mBq (2–22 pg) kg
Ϫ1
fresh weight (33), with a weighted mean value of
252 mBq (6.8 pg) kg
Ϫ1
fresh weight. Concentrations in subjects from the high
radiation background areas in China were ϳ3 times greater than the maximum
observed in other areas. In the Chinese samples the
226
Ra/
228
Ra ratios varied be-
tween ϳ1 and 2 (33). On the basis of a
226
Ra/
228
Ra ratio of 1 the total mass of
228
Ra in the human body would be ϳ30 fg kg
Ϫ1
fresh weight.
Assuming that 95% of the environmentally derived
226
Ra in the body is
located in the skeleton, and that worldwide the mean skeletal concentration is 7
pg kg
Ϫ1
fresh weight, with a range of 2–22 pg kg
Ϫ1
fresh weight, the total body
massofradiumcanbecalculatedtobeϳ70pg,range18–200pg(Fig.4);this
is in reasonable agreement with the value of ϳ30 pg assumed for ICRP Reference
Man (8). The calculated average total-body
226
Ra content of ϳ70 pg (2.6 Bq)
corresponds to the emission of ϳ2.2 10
5
α-particles d
Ϫ1
, mostly in the mineral
mass of the skeleton.
5.2 Radon
As mentioned above, the
222
Rn and
220
Rn that are produced by the continuous
decay of
238
U in the rocks and soil diffuse rapidly into the atmosphere where,
together with their short-lived radioactive daughter products, they are inhaled by
Copyright © 2002 Marcel Dekker, Inc.
the entire human population (5,49). The levels of radon in the air vary widely
according to the geological nature of the ground, being low in areas of basalt
and high in areas rich in granite. Radon concentrations within buildings are gener-
ally higher than those in the outside air because of the emanation of radon from
the wall and floors of the building and of the restricted ventilation in most build-
ings. Average indoor
222
Rn levels in houses vary widely between countries; for
example, the level in Australia is 10 Bq m
Ϫ3
(38,48,49) and 20 Bq m
Ϫ3
in the
United Kingdom while levels in much of western Europe and parts of the United
States may range from ϳ80 to 180 Bq m
Ϫ3
(38,48). Within most countries there
are quite large regional or local variations in indoor radon concentrations; for
example, in the United Kingdom the average concentration is ϳ20 Bq m
Ϫ3
; how-
ever, persons residing in areas rich in granite, such as Cornwall, may be exposed
to concentrations 5 or more times greater than this. Thoron concentrations are
much lower and the radiation doses delivered to the population by
220
Rn are less
than one-tenth of those that result from
222
Rn (48). There is now widespread
evidence from experimental and epidemiological studies to show that radon, plus
its daughter products, is a human carcinogen (50) and this will be discussed in
more detail later.
6. THE BIOINORGANIC CHEMISTRY OF THE FALLOUT
RADIONUCLIDES
The two atomic bombs dropped in Japan in 1945, and more especially the atmo-
spheric testing of nuclear weapons between 1945 and the late 1960s, resulted in
the release of several other metallic radionuclides into the environment; of these
only
137
Cs (T
1/2
30.2 a) and
90
Sr (T
1/2
29.1 a), remain of major interest. Like
239,240
Pu (q.v.), the fallout
90
Sr and
137
Cs from nuclear weapon testing, together
with much smaller quantities of the shorter-lived
134
Cs (T
1/2
29.1 a), were depos-
ited widely across the world. In the Northern Hemisphere the total deposition of
137
Cs peaked at ϳ150 PBq (1 PBq ϭ 10
15
Bq) in about 1963, then declined
steadily reaching levels at or below the limits of detection in 1982. A further
deposition of ϳ70 PBq followed the accident at the Chernobyl nuclear power
station in the Ukraine in 1986, but deposition dropped to below detectable levels
from 1987 onward (51). Deposition in the Southern Hemisphere was about one-
sixth of that in the north with the peak activity, ϳ23 PBq, occurring in 1965;
thereafter the activity declined steadily and fell below the limits of detection in
1981. The deposition of
90
Sr showed a similar pattern with a peak level of 94
PBq in 1963 in the Northern Hemisphere, and of 15 PBq in 1965 in the Southern
Hemisphere. A transient, Chernobyl-related peak of ϳ2 PBq
90
Sr was observed
in 1986. A survey of the 1987–88 soil concentrations across Japan revealed me-
dian values of 3 Bq (range 0.3–30) Bq
90
Sr and 23 (range 0.08–148) Bq
137
Cs
kg
Ϫ1
in the top 5 cm of soil (52).
Copyright © 2002 Marcel Dekker, Inc.
6.1 Cesium
The bioinorganic chemistry of the alkali metal radionuclide
137
Cs is broadly simi-
lar to that of potassium and the monovalent Cs
ϩ
cation must be regarded as being
quite mobile. Cesium is incorporated into almost all foodstuffs, with milk, meat,
and fish showing the highest levels. The results of an extensive survey of
137
Cs
and
90
Sr samples in a few types of food across Japan in the years 1987–88 (52)
are listed in Table 4. The data show a wide spread of values, much wider than
the variations in the calcium and potassium concentrations; this large variation
suggests that, except perhaps for fish, there is no simple relationship between the
uptake of
137
Cs and potassium or
90
Sr and calcium. Comparison of the concentra-
tions in the foodstuffs with those in the soil suggest CF values of ϳ1–5.10
Ϫ3
for
both radionuclides.
In the human body
137
Cs is almost completely absorbed from the gastroin-
testinal tract (8,9) and becomes more or less uniformly distributed throughout
the body tissues, the largest amount being found in the muscle mass. This
137
Cs
appears to exist in ionic form in the tissues (53); its rate of elimination is relatively
slow with biological half-times ranging from 50 to 200 days (9). The rate of
elimination from females (T
1/2
ϳ80 days) is shorter than that in males (T
1/2
ϳ100
days). The amount of
137
Cs that is found in the human body depends principally
on the individual’s dietary intake, with persons eating diets rich in meat, fish, or
edible fungi showing higher levels than those whose diet is largely vegetarian.
For example, Eskimos and residents of Lappland, whose diet is rich in caribou
or reindeer meat, show some of the highest levels. Caribou and reindeer feed on
lichens, which concentrate large amounts of fallout
137
Cs. The levels of
137
Cs in
humans peaked around 1964 with levels reaching up to ϳ50 kBq in a 70-kg
Eskimo man (54); these peak levels decreased quite rapidly and by the late 1970s
levels ϳ30–110 Bq were being reported (55). The Chernobyl accident increased
137
Cs levels in people in some areas of Europe; for example, Pietrzak-Flis and
Krajewski (56) estimated that in northeast Poland the dietary intake of
137
Cs in-
creased by up to 10-fold following the Chernobyl accident and that human body
burdens of
137
Cs reached levels of up to 1900 Bq in 1986–87, but declined to
Ͻ450 Bq by 1991–92.
6.2 Strontium
The results of an extensive survey of
90
Sr concentrations in a few types of food
across Japan in the years 1987–88 (52) are listed in Table 4. The data show a
wide spread of values, much wider than the variations in the calcium concentra-
tions; this large variation suggests that, except perhaps for fish, there is no simple
relationship between the
90
Sr uptake and the calcium concentration. Comparison
of the concentrations in the foodstuffs with those in the soil suggest CF values
of ϳ1–5.10
Ϫ3
for
90
Sr.
Copyright © 2002 Marcel Dekker, Inc.
T
ABLE
4 Concentrations of
137
Cs and
90
Sr Measured in Soils and Some Foodstuffs in Japan in 1988–89 and Total
Daily Intakes of These Radionuclides in the Diet (Ref. 52)
90
Sr (mBq kg
Ϫ1
)
137
Cs (mBq kg
Ϫ1
)
Material g Ca kg
Ϫ1
gKkg
Ϫ1
Mean Ϯ SD Median Mean Ϯ SD Median
Soil (31) 6.8 Ϯ 7.3
a
3.0
a
32.8 Ϯ 37.9
a
23.3
a
(0.3–30.0)
a
(0.85–148)
a
Milk (77)
a
1.11 Ϯ 0.08 1.59 Ϯ 0.11 33 Ϯ 37 26 78 Ϯ 113 48
(0–277) (0–777)
Rice (39) 0.04 Ϯ 0.01 1.02 Ϯ 0.24 9.6 Ϯ 6.6 11.1 40 Ϯ 70 26
0–26 0–444
Vegetables (74) 0.47 Ϯ 0.28 4.15 Ϯ 2.39 200 Ϯ 274 105 42 Ϯ 101 15
7–1776 0–814
Fish (27) 4.0 Ϯ 4.2 3.76 Ϯ 0.73 11 Ϯ 11 11 208 Ϯ 70 229
(0.1–13.4) 0–44 (78–370)
g person
Ϫ1
d
Ϫ1
mBq person
Ϫ1
d
Ϫ1
mBq person
Ϫ1
d
Ϫ1
Total diet 0.69 Ϯ 0.26 2.1 Ϯ 0.44 116 Ϯ 59 94 229 Ϯ 179 176
Japan 1988–89 (30–285) 30–285
Total diet 30 Ϯ 8 Ͻ50
USA 1980–82
a
Bq kg
Ϫ1
.
Copyright © 2002 Marcel Dekker, Inc.
Strontium is an alkaline earth metal and resembles calcium in its general
bioinorganic chemistry, except that, unlike calcium, there is no biochemical
mechanism that enhances its absorption from the gastrointestinal tract. About
30% of the
90
Sr ingested in the diet is assumed to be absorbed from the gastroin-
testinal tract and of the absorbed radionuclide the largest fraction will deposit in
bone (8). The amount of
90
Sr reaching human bone is dependent both on the
dietary intake and on the physiological activity of the skeleton; thus age at inges-
tion is an important factor. Papworth and Vennart (57), from a study of orally
ingested fallout
90
Sr in human bone, showed that skeletal uptake decreased from
ϳ9% at 3 months of age to ϳ4% at age 5, then began to increase at about age
10 to reach a peak of ϳ8% at 15–16 years, declining thereafter to 4% at 20
years. Dehos and Schmier compared the age dependence of concentrations of
90
Sr in the bones of West German residents in the years 1977, 1980, and 1982
(58). In 1977 the peak activity, ϳ100–150 mBq
90
Sr g
Ϫ1
Ca, was found at age
20–22; by 1980 the peak level was still seen at age ϳ20 but the concentration
had decreased to ϳ80 mBq
90
Sr g
Ϫ1
Ca. For persons aged 30 years or more the
concentrations in all three years ranged from ϳ10 to ϳ40 mBq
90
Sr g
Ϫ1
Ca,
which corresponds to a total-body content of ϳ20–80 Bq
90
Sr.
7. HUMAN HEALTH IMPLICATIONS OF ENVIRONMENTAL
RADIONUCLIDES
As we have seen in the preceding discussion, the total mass of the element that
is associated with the residual primeval radionuclides in the human body is very
small, generally less than a few µg, however the radioactivity may vary widely.
Table 5 presents a summary of the information in rounded figures; the final col-
umn of the table gives, for each of the radionuclides, a rounded value for the
number of disintegrations that would be expected to occur each day in the human
body. Table 5 indicates that only for the actinide radionuclides and for
147
Sm,
226
Ra,
137
Cs, and
90
Sr do the disintegration rates exceed 1 per day. For a total-
body content of 1 mg
147
Sm the lifetime effective radiation dose is Ͻ1 µSv; this
is far below the level at which any deleterious effects on human health would
be detectable, especially when they must be detected against a 2000-fold higher
background irradiation from other natural sources. Radium, thorium, uranium,
and plutonium deposit mainly in bone where the α-particle irradiation may cause
bone tumors;
90
Sr also deposits in bone but the β-particle emission is less effective
for inducing bone tumors than α-particles (50). Taylor (60) estimated the risk of
bone tumor induction from environmental levels of
228,230,232
Th,
234,235,238
U,
239
Pu,
and
226
Ra and concluded that these radionuclides might contribute about one-
hundredth of the overall spontaneous lifetime risk of developing a bone tumor,
ϳ0.05%in50years.Figure5presentstherisksforeachoftheseradionuclides
recalculated using updated risk estimates (59); these revised data suggest that
Copyright © 2002 Marcel Dekker, Inc.
T
ABLE
5 Total-Body Contents of Primeval Radionuclides and Associated
Disintegration Rates
Body content
Radionuclide Mass (g) Radioactivity (Bq) Disintegrations d
Ϫ1
113
Cd 8EϪ05 1.6EϪ08 1.4EϪ03
115
In 1EϪ07 2.2EϪ08 1.3EϪ03
138
La Ͻ1EϪ03 Ͻ5EϪ07 Ͻ4EϪ02
144
Nd Ͻ1EϪ03 Ͻ2EϪ06 Ͻ2EϪ01
147
Sm Ͻ1EϪ03 Ͻ2EϪ02 Ͻ2Eϩ03
148
Sm Ͻ1EϪ03 Ͻ2EϪ06 Ͻ2EϪ01
152
Gd Ͻ1EϪ03 Ͻ1EϪ07 Ͻ9EϪ03
176
Lu Ͻ1EϪ03 Ͻ2EϪ06 Ͻ2EϪ01
174
Hf 1EϪ04 9.6EϪ12 8.3EϪ07
187
Re 5EϪ11 3.4EϪ08 2.9EϪ03
190
Pt 5EϪ09 9.7EϪ15 8.4EϪ10
232
Th 2EϪ05 8.1EϪ02 7.0Eϩ03
235
U9EϪ05 3.7EϪ04 3.2Eϩ01
238
U9EϪ05 1.1Eϩ00 9.5Eϩ04
239
Pu 3EϪ11 7.4EϪ03 6.4Eϩ02
244
Pu 3EϪ11 Ͻ1EϪ09 Ͻ1EϪ04
226
Ra 7EϪ11 2.5Eϩ00 2.2Eϩ05
137
Cs 1EϪ08 4.5Eϩ02 3.9Eϩ07
90
Sr 2EϪ11 8.0Eϩ01 6.9Eϩ06
their contribution to the total risk might in fact be ϳ7-fold greater than that
previously calculated. However, these radionuclides have been present in human
beings ever since the race developed, and they will continue to be present as
long as the human race exists; thus any risk they present is an inescapable part
of the natural risk of life on planet earth.
The γ-ray emitting
137
Cs, because of its more or less uniform distribution
through the body, irradiates all the body tissues. In the United Kingdom in the
early 1990s the annual dose from fallout
137
Cs in the diet was about 0.2 µSv,
although in some areas of Europe in the immediate aftermath of the Chernobyl
accident the dose rate in 1986–87 may have been as high as 10 µSv (61). A
comparison of the late biological effects of intravenously injected
137
Cs in beagle
dogs showed a close similarity in the pattern and type of tumors induced by
external γ-irradiation (62). Using the general ICRP factor for total cancer risk
of 0.06 Sv
Ϫ1
(63), the irradiation from the current level of fallout
137
Cs poses
an additional cancer risk of ϳ1.10
Ϫ8
a
Ϫ1
. However, for the majority of the
world’s population this is a decreasing risk as the bioavailability of the fallout
Copyright © 2002 Marcel Dekker, Inc.
F
IGURE
5 The estimated fractional risk of developing a bone tumor from the
bone-seeking primeval or fallout radionuclides and their decay product over
a 50-year period (60).
137
Cs is slowly decreasing and the radioactivity is also being reduced by radio-
active decay.
At the average radon concentration in homes in the United Kingdom (20
Bq m
Ϫ3
) radon, in conjunction with smoking, accounts for about 6% of the life-
time risk of developing human lung cancer from all causes (50). A full discussion
of this evidence is beyond the scope of this review but the most important conclu-
sions are summarized below. It is interesting to note that what is now recognized
to have been radon-induced lung disease was first described by Paracelsus (64)
Copyright © 2002 Marcel Dekker, Inc.
more than 200 years before the discovery of uranium and some 300 years before
the recognition of its radioactivity and of its radioactive daughter products (38).
During the past 30 years, extensive epidemiological studies have been made
of the workers in uranium mines around the world. These have demonstrated
conclusively that there is a causal link between lung cancer and radon exposure
(50). Estimated lifetime risks of developing lung cancer from the inescapable
exposure to average indoor radon levels in various parts of the world range from
ϳ1 in 300 in areas of the United Kingdom with an average
222
Rn air concentration
of 20 Bq m
3
(ϵ1 mSv a
Ϫ1
)toϳ1 in 30 in areas, for example, Finland or Sweden
(54), where the
222
Rn concentrations are 180 Bq m
3
or more; for smokers these
risks are about 3 times greater than those for the general population. The range
of doses observed in the United Kingdom is 0.3–100 mSv a
Ϫ1
(65); this range
is probably similar to that which would be observed in other countries. The life-
time risks must be considered in relation to the overall lifetime risk of developing
lung cancer from all causes, which is about 3–5% for the United Kingdom and
United States (50).
In summary it can be said that the levels of primeval and related radionu-
clides that are presently in the environment pose no significant threat to human
health, and appear unlikely to do so in the future. Provided that no one resorts
to the use of nuclear weapons, or that there is a resumption of nuclear weapons
testing in the atmosphere, the current world levels of
90
Sr and
137
Cs will decay
away over the next century. A matter of some potential concern is the 1200 tonnes
or so of unwanted
239
Pu that has arisen from the decommissioning of nuclear
weapons and from nuclear power production (40). However, the residual prime-
val radionuclides will remain with us, making a small, but significant contribution
to the inescapable natural background irradiation of mankind for many hundreds
of millennia into the future.
REFERENCES
1. RE Kirk, DF Othmer, M Grayson, DV Eckroth. In: I. Kirk-Othmer, ed. Encyclopedia
of Chemical Technology, Vol 19. New York: Wiley-Interscience, 1983, pp 639–
660.
2. DM Taylor. Appl Radiat Isot 46:1245–1252, 1995.
3. G Choppin, JO Liljenzin, J Rydberg. Radiochemistry and Nuclear Chemistry, 2nd
ed. Oxford: Butterworth-Heinemann, 1995, pp 4, 48–419.
4. DM Taylor, DR Williams. Trace Element Medicine and Chelation Therapy. London:
The Royal Society of Chemistry, 1995, p 17.
5. National Radiological Protection Board. Living with Radiation, Chilton UK: Na-
tional Radiological Protection Board, 1998, pp 25–28.
6. DR Lide, ed. CRC Handbook of Chemistry and Physics, 75th ed. Boca Raton, FL:
CRC Press, 1995, pp 14–11.
7. FA Cotton, G Wilkinson. Advanced Inorganic Chemistry, 5th ed. New York: Wiley
Interscience, 1988, pp 777–787.
Copyright © 2002 Marcel Dekker, Inc.
8. International Commission on Radiological Protection. Report of the Task Group on
Reference Man, ICRP Publication 23. Oxford: Pergamon, 1975, pp 327–442.
9. International Commission on Radiological Protection. ICRP Publication 72. Ann
ICRP 26:15–89, 1996.
10. GV Iyengar, WE Kollmer, HJM Bowen. The Elemental Composition of Human
Tissues and Body Fluids. Weinheim: Verlag Chemie, 1978.
11. International Commission on Radiological Protection. ICRP Publication 30. Ann
ICRP 4:47–56, 1980.
12. DM Taylor. In: RW Hay, ed. Perspectives in Bioinorganic Chemistry, Vol 2. Lon-
don: JAI Press, 1993, pp 139–159.
13. DM Taylor, M Lehmann, F Planas-Bohne, A Seidel. Radiat Res 95:339–358, 1983.
14. DM Taylor, A Seidel, H Doerfel. Int J Nucl Med Biol 12:387–391, 1985.
15. K Hashimoto, K Yoshihara. Top Curr Chem 176:275–291, 1996.
16. PHS Smith, DM Taylor. J Nucl Med 15:349–351, 1974.
17. RM Parr, DM Taylor. Phys Med Biol 8:44–50, 1963.
18. IH Tipton, HA Schroeder, HM Perry, MJ Cook. Health Phys 11:403–451, 1969.
19. CH Evans. Biochemistry of the Lanthanides. New York: Plenum, 1990, pp 285–
337.
20. PW Durbin. Health Phys 8:665–671, 1962.
21. DM Taylor, RW Leggett. Rad Prot Dosim 79:351–354, 1998.
22. E Sabbioni, R Petra, P Gaglione, G Vocaturo, F Colombo, M Zanoni, F Rodi. Sci
Total Environ 26:19–32, 1982.
23. EI Hamilton, MJ Minski, JJ Cleary. Sci Total Environ 1:341, 1972.
24. J McAughey. In: Euratom, Radiation Protection Research Action, Final Report
Volume 1, Luxembourg: European Communities, EUR 16769 DE/EN/FR, 1997,
pp 637–648.
25. IM Fisenne, PM Perry, KM Decker, HW Keller. Health Phys 53:357–363, 1987.
26. K Shiraishi, K Tagami, T Ban-nai, M Yamamoto, Y Muramatsu, IP Los, GV Phedo-
senko, VN Korzun, NY Tsiganov, II Segeda. Health Phys 73:814–819, 1997.
27. KN Yu, SY Mao. Health Phys 77:686–696, 1999.
28. K Shiraishi, Y Igarashi, Y Takaku, K Masuda, K Yoshimuzu, Y Nishimura, S
Hongo, H Yamaguchi. Health Phys 63:187–191, 1992.
29. NP Singh, DP Burleigh, HM Ruth, ME Wrenn. Health Phys 59:333–337, 1990.
30. K Shiraishi, K Tagami, Y Muramatsu, M Yamamoto. Health Phys 78:28–35, 2000.
31. ME Wrenn, NP Singh, N Cohen, SA Ibrahim, G Saccomanno. Thorium in Human
Tissues, Springfield, VA: NTIS, 1981, NUREG/CR-1227.
32. SA Ibrahim, ME Wrenn, NP Singh, N Cohen. Health Phys 44(suppl 1):213–220,
1983.
33. Chen Xing-an. J Radiat Prot 15:177–184, 1995.
34. International Commission on Radiological Protection. ICRP Publication 69. Ann
ICRP 25:39–74, 1995.
35. DM Taylor. Health Phys 22:575–581, 1972.
36. JR Duffield, DM Taylor, DR Williams. In: KA Gschneider Jr, L Eyring, GR Chop-
pin, GH Lander, eds. Handbook on the Physics and Chemistry of Rare Earths. Vol
18. Lanthanides/Actinides: Chemistry. Amsterdam: Elsevier, 1994, pp 591–621.
37. DM Taylor. J Alloys Cmpds 271–273:6–10, 1998.
38. DM Taylor, SK Taylor. Rev Environ Health 12:147–157, 1997.
Copyright © 2002 Marcel Dekker, Inc.