ORGANIC SOILS and PEAT MATERIALS for SUSTAINABLE AGRICULTURE - CHAPTER 2 pot
Bạn đang xem bản rút gọn của tài liệu. Xem và tải ngay bản đầy đủ của tài liệu tại đây (182.12 KB, 18 trang )
CHAPTER
2
Irreversible Loss of Organic Soil Functions
after Reclamation
Piotr Ilnicki and Jutta Zeitz
CONTENTS
Abstract
I. Introduction
II. Morphological Classification of Genetic Soil Horizons
III. Changes in Physical Properties
A. Peat Shrinkage
B. Peat Density
C. Peat Porosity
D. Hydraulic Conductivity
IV. Changes in Chemical Properties
V. Changes in Biological Properties
VI. Soil Degradation Symptoms and Prevention
VII. Conclusion
References
ABSTRACT
After drainage, organic soils change their basic functions from natural carbon
sinks and water reservoir to sources of greenhouse gases and water-deficient bodies.
The natural process of carbon sequestration is paludification; with drainage and
aeration, the organic soil undergoes the irreversible moorsh-forming process (MFP).
The intensity of MFP is shown by morphological and structural transformations,
enrichment in humic substances, changes in mineral composition, as well as shifts
in microbial populations, mesofauna and earthworm species. The climatic impact
© 2003 by CRC Press LLC
factor (CO
2
+ CH
4
+ NO
x
) of organic soil cultivation would be between 2.9 and
10.3 Mg CO
2
ha
–1
yr
–1
. Maximum CO
2
production is associated with arable farming
and 90-cm deep water table level. The easily mineralizable N pool makes up 0.4 to
2.8% of total N in the 0–20 cm layer, supplying 77 to 493 kg N ha
–1
yr
–1
as mineral
N depending on moorsh stage. Optimum volumetric air content for N mineralization
is 20–30%. There is 20% more N mineralized under arable farming compared with
grassland. The NO
3
-N to NH
4
-N ratio increases with MFP, thus enhancing N leaching
and denitrification in anaerobic microsites. Addition of N-bearing fertilizers
increases N pollution hazards. Organic soil quality as monitored by MFP attributes
is best maintained under grassland farming with high groundwater level.
I. INTRODUCTION
Drainage must increase volumetric air content to at least 6–8% in the upper layer
of organic soils used as grassland (Okruszko, 1993). Air contents up to 20–30%
provide optimum conditions for intensive MFP, the transformation of peat materials
into moorsh. The MFP is initiated by soil consolidation and subsidence after drain-
age, then accelerated by repeated shrinkage and swelling upon successive drying
and wetting, and by microbial decomposition of organic substances. The peat min-
eralization rate depends on degree of decomposition and ash content, temperature,
water and air contents, and nutrient ratios. It is faster in fen than in oligotrophic or
bog peats, and in soils used for arable farming compared with grassland.
The MFP, the reverse process of paludification, was defined by Okruszko (1985)
as decession (from the Latin word decessio meaning loss or dissipation). The MFP
leads to the gradual disappearance of organic soils from the landscape. The MFP
contributes to CO
2
emissions depending on intensity, and is associated with irre-
versible transformations of peat properties as driven by drier soil conditions. Peatland
functions for conserving water and as carbon sink are thus drastically reversed
following drainage. Monitoring peat properties during MFP helps planning soil
utilization and conservation.
The aim of this chapter is to present organic soil indicators of the decrease in
organic soil quality following drainage and reclamation.
II. MORPHOLOGICAL CLASSIFICATION OF GENETIC SOIL HORIZONS
With the decrease in water content after drainage, peat structure changes gradually
to a more or less crumby, granular or grainy structure (Okruszko, 1993). Throughout
the surface layer, the peat mass is fragmented into a fine, sometimes dusty material,
due to MFP. The size of moorsh particles increases with soil depth. A morphological
classification system for MFP was first proposed by Okruszko (1960, 1993, 1994)
in Poland, followed by Schmidt and Illner (1976) in Germany. A comparative nomen-
clature of moorsh horizons in grassland soils is presented in Table 2.1.
The characteristic moorsh horizons are genetically related to one another in the
soil profile as a result of gradual transformation of soil physical, chemical, and
© 2003 by CRC Press LLC
biological properties after drainage. Physical properties of the more humified horizon
Hm or M
1
differ markedly from those of the less humified Hv or M
2
. From a soil
conservation viewpoint, the Hm to Ha or M
1
to M
3
horizon sequences are indicative
of the degree of soil degradation through MFP.
III. CHANGES IN PHYSICAL PROPERTIES
A. Peat Shrinkage
Soil volume losses between 53 and 70% compared with the initial peat volume
vary with peat botanical composition and degree of decomposition (Table 2.2). Peat
shrinkage is larger the higher the degree of decomposition and the smaller the ash
Table 2.1 Symbols used in Poland and Germany for Designating the Moorsh Horizons
of Drained Organic Soils
Poland
a
Germany
b
Symbol Layer Morphology Symbol Layer Morphology
M
1
grainy
moorsh
At sod level, soil mass bound by
plant roots, structure ranging
from granular to fine-grain, dust-
like. In arable soils, the structure
is usually uniform throughout the
cultivated layer.
Hm Torf-Vermulmungshorizont (peat-
dust horizon) at the surface of
intensively drained and tilled
organic soils, high degree of
decomposition when dry; very
fine granular and dusty, high
water repellency.
M
2
humic
moorsh
Under sod, soil mass
characterized by grainy, less
frequently granular, relatively
loose structure. Soil grains
made of compacted humus.
Their size is 2–4 mm, gradually
increasing down the profile to
5–10 mm.
Hv Torf-Vererdungshorizont (peat-
earth horizon), low to moderate
humification, crumby or fine
subangular structure.
M
3
peaty
moorsh
Transitional horizon, soil mass
with a peat structure subjected
shrinkage and swelling,
producing lumps or aggregates
often visible under pressure. The
lumps are cemented by humus,
frequently leached from
overlying layers. Several
fissures.
Ha Torf-Bröckelhorizont (peat-crumb
horizon), coarse to fine-angular
blocky structure, vertical and
horizontal shrinkage cracks.
Ht Torf-Schrumpfungshorizont (peat
shrinkage horizon), vertical
cracks and coarse prismatic
structure caused by shrinkage.
T
1
peat
layer
Underlying peat horizon above
groundwater level.
Hw Horizon affected by fluctuating
groundwater or perched-water
table, partially oxidized.
T
2
peat
layer
Underlying peat horizon below
groundwater level.
Hr Torf-Horizont (peat horizon)
below groundwater table,
reduced state
a
Source: From Okruszko, H. 1993. Pol. Akad. Nauk, 406:3–75; Okruszko, H. 1994. Bibl.
Wiadomosci Instytutu Melioracji i Uzytkow Zielonych, 84:5–27. With permission.
b
Source: Sponagel, H., et al. 1996. Methods of Soil Cartography (in German). E. Schweizer-
bart’sche Verlagsbuchhandlung (Nägele u. Obermiller), Stuttgart, Germany, 392 pp.; Schäfer,
W. 1996. Proc. 10th Int. Peat Congr., 4:77–84. With permission.
© 2003 by CRC Press LLC
content. An increased moss fraction decreases peat shrinkage. A linear relationship
exists between volumes of total (Y in %) and of irreversible shrinkage (X in %) as
follows (Ilnicki, 1967):
Y = 0.83X – 4.70, R
2
= 0.67 (2.1)
Irreversible shrinkage after drainage is a characteristic of MFP. The higher the
peat decomposition and the more advanced the peat drying, the greater the structural
changes through MFP. Fissures starting to develop at 65 to 75% volumetric moisture
content become obvious at 50% moisture content (Ilnicki, 1967).
B. Peat Density
Bulk and particle densities are parameters of soil porosity. They change during
MFP due to compaction and increased ash content. Average particle density of peat
organic matter is 1.45 g cm
–3
, varying from 1.3 to 1.6 g cm
–3
(Okruszko, 1993).
Particle density (PD) depends on ash content (Table 2.3). Linear relationships
between PD (g cm
–3
) and ash content (% w/w) were described as follows for peat
materials:
PD = 0.011ash + 1.45 (2.2)
(Okruszko, 1971)
PD = 0.0086ash + 1.44 (2.3)
(TGL 31222/03, 1985)
and for mud materials:
PD = 0.0124ash + 1.35 (2.4)
(TGL 31222/03, 1985)
Table 2.2 Relationship between Peat Shrinkage and Botanical Composition
Peat Type
No. of
Samples
Shrinkage
(m
3
m
–3
)
DD
a
(%)
Ash
Content
(kg kg
–1
)
Bulk Density
(g cm
–3
)
Solid Phase
(m
3
m
–3
)
Reed 25 0.65 45 0.306 0.204 0.109
Sedge-reed 22 0.68 40 0.227 0.196 0.109
Sedge 29 0.70 40 0.176 0.156 0.090
Moss 15 0.59 29 0.144 0.121 0.071
Sedge-moss 24 0.60 28 0.135 0.132 0.077
Alder 27 0.70 53 0.260 0.212 0.117
Sphagnum 6 0.53 13 0.041 0.069 0.040
Sphagnum 13 0.66 40 0.026 0.116 0.072
a
Degree of peat decomposition in % (Russian method).
Source: From Ilnicki, 1967. Zeszyty Problemowe Postepow Nauk Rolniczych, 76: 197–311. With
permission.
© 2003 by CRC Press LLC
The volume of peat solid phase, calculated as the ratio of bulk density to particle
density (Okruszko, 1993), increases with ash content and degree of decomposition
(Tables 2.2 and 2.3). Drainage and soil drying increase bulk density and volume of
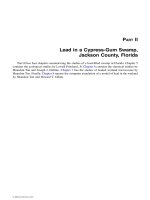
the solid phase in the upper layer (Table 2.4). The volume of solids in fen organic
soils from Germany increased by 100 to 300% in the top layer, and by 50 to 100%
in the subsoil, after 27 years of MFP (Figure 2.1). The volume of solids is thus a
useful indicator of MFP.
C. Peat Porosity
Peat porosity ranges between 78 and 93%. The higher the degree of decompo-
sition, the larger the volume of micropores, and the smaller the volume of macropores
and mesopores in peat materials will be. The MFP alters porosity, pore size distri-
bution, and soil water regime (Tables 2.5 and 2.6). The MFP in fen peats decreased
total porosity by 3% (peaty moorsh) to 9% (grainy moorsh). The volume of
macropores and micropores increased at the expense of mesopores (Table 2.6).
Transition from peat to moorsh decreased water availability to plants. Porosity of
peaty moorsh materials was similar to hemic peats, and grainy moorsh resembled
sapric peats (Okruszko, 1993). Volume of micropores (<0.2
m
m) and larger
macropores (>300
m
m) increased at the expense of smaller macropores (300–30
m
m)
Table 2.3 Properties of 1470 Organic Soil Materials from Poland with Varying
Ash Contents
Peat Material
Ash
Content
(kg kg
–1
)
Particle
Density
(g cm
–3
)
Bulk
Density
(g cm
–3
)
Solid
Phase
(m
3
m
–3
)
Pore
Volume
(m
3
m
–3
)
Unsilted 0.05–0.25 1.51–1.73 0.11–0.19 0.07–0.11 0.89–0.93
Silted 0.25–0.50 1.73–2.00 0.19–0.29 0.11–0.16 0.84–0.89
Strongly silted 0.50–0.80 2.00–2.33 0.29–0.41 0.16–0.22 0.78–0.84
Source: From Okruszko, 1976. Bibl. Wiadomosci Instytutu Melioracji i Uzytkow
Zielonych, 52:7–54. With permission.
Table 2.4
Volume of the Solid Phase in Moorsh Materials
Moorsh
Stage Horizon
Depth
(cm)
Samples
(No.)
Ash
(kg kg
–
)
Bulk Density
(g cm
–3
)
Solid Phase
(m
3
m
–3
)
MtI M
1
0–10 45 0.160 0.203 0.127
M
2
10–20 28 0.145 0.179 0.112
M
3
20–30 10 0.122 0.160 0.102
T
1
40–60 53 0.104 0.143 0.096
T
2
80–100 10 0.101 0.126 0.084
MtIII M
1
0–10 41 0.176 0.321 0.192
M
2
10–20 41 0.156 0.298 0.180
M
3
20–30 62 0.124 0.230 0.142
T
1
40–60 69 0.108 0.155 0.097
T
2
80–100 10 0.102 0.134 0.084
Source: From Okruszko, 1976. Bibl. Wiadomosci Instytutu Melioracji i Uzytkow Zielonych,
52:7–54. With permission.
© 2003 by CRC Press LLC
as MFP advanced (Burghardt and Ilnicki, 1978). Hysteresis was found to be larger
in peat than in moorsh materials, peaty soil or humic sand (Ilnicki, 1982). Suctions
varying from –1 to –3 kPa caused differences of 0.076 cm
3
cm
–3
in water content
during peat drying and rewetting cycles. Hysteresis of water retention curves was
smaller the higher the degree of peat decomposition, MFP intensity, ash content,
bulk density, and pH. Hysteresis increased with the volume of macropores (>50
m
m).
D. Hydraulic Conductivity
In the saturated zone of the peat profile, hydraulic conductivity (k
f
) generally
decreases with time and drainage intensity due to peat compaction. Preferential flow
increases with shrinkage fissures in the moorsh compared with peat layers
(Table 2.7). The more advanced the MFP, however, the lower was the hydraulic
conductivity (Zeitz, 1991; Sauerbrey and Zeitz, 1999).
Figure 2.1 Percentage volume change in the solid phase in three thick organic soils between
1959 (Titze, Water and air composition of the upper earthy layer of the Klenzer
fen and its influence on yield, Universite Rostock, 1966 in bold characters) and
1986 (Zeitz, Zeitschrift für Kulturtechnik und Landentwicklung, 32:227–234, 1992).
Table 2.5
Average Porosity of Peat and Moorsh Materials in Poland
Peat or Moorsh
Material Porosity
Macroporosity
pF < 2.0
(m
3
m
–3
)
Mesoporosity
Microporosity
pF > 4.2
(m
3
m
–3
)
pF 2.0–2.7
(m
3
m
–3
)
pF 2.7–4.2
(m
3
m
–3
)
Moss-sedge peat R
1
0.920 0.257 0.307 0.533 0.132
Alder swamp peat R
3
0.885 0.248 0.145 0.352 0.207
Peaty moorsh 0.885 0.161 0.257 0.507 0.217
Humic moorsh 0.830 0.172 0.186 0.382 0.276
Grain moorsh 0.825 0.249 0.122 0.291 0.285
Source: From Okruszko, 1993. Pol. Akad. Nauk, 406: 3–75. With permission.
0
10
20
30
40
50
60
70
80
90
100
5 10 15 20 25
Solid phase volume (%)
a
Sites a, b, c
Depth down soil profile (cm)
c
b
a
b
c
1959
1959
1986
1986
© 2003 by CRC Press LLC
Table 2.6 Properties (Mean ± Standard Deviation) of Moorsh Horizons in Oligotr
ophic Organic Soils
Horizon v. Post H
Ash
(kg kg
–1
)
Bulk Density
(g cm
–3
)
TP
a
(m
3
m
–3
)
VSP
a
(m
3
m
–3
)
FC
a
(m
3
m
–3
)
AP
a
(m
3
m
–3
)
PAW
a
(m
3
m
–3
)
nHm 7 ± na
b
0.29 ± 0.04 0.28 ± 0.2 0.82 0.18 ± 0.03
0.68 ± 0.07 0.14 ± 0.07 0.36 ± 0.16
nHv 7 ± 1.5 0.19 ± 0.20 0.03 ± 0.06
0.86 0.14 ± 0.11 0.70 ± 0.13 0.16 ± 0.07 0.46 ± 0.14
nHa nHt Not occurring in fibric peat materials
nHw H3-H4
H5-H6
H7-H8
3 ± 0.4
5 ± na
b
8 ± 0.5
0.03 ± 0.013
0.02 ± 0.005
0.02 ± 0.013
0.10 ± na
0.10 ± 0.02
0.12 ± 0.02
0.94
0.94
0.92
0.06 ± 0.012
0.06 ± 0.014
0.08 ± 0.009
0.73 ± 0.06
0.76 ± 0.07
0.80 ± 0.04
0.12 ± 0.06
0.18 ± 0.12
0.12 ± 0.05
0.57 ± 0.06
0.58 ± 0.08
0.60 ± 0.03
nHr H3-H4
H5-H6
H7-H8
3 ± 0.4
5 ± 0.4
8 ± 0.6
0.02 ± 0.001
0.01 ± 0.006
0.04 ± 0.047
0.07 ± 0.03
0.14 ± 0.02
0.13 ± 0.04
0.96
0.91
0.92
0.04 ± 0.004
0.09 ± 0.009
0.08 ± 0.021
0.67 ± 0.03
0.82 ± 0.03
0.83 ± 0.02
0.29 ± 0.04
0.08 ± 0.03
0.08 ± 0.02
0.59 ± 0.04
0.64 ± 0.03
0.62 ± 0.08
a
TP = total porosity; VSP = volume of the solid phase; FC = water at field capacity (pF > 1.8); AP = air porosity at field capacity (AP
= TP – VSP – FC); PAW = plant available water between pF 1.8 (field capacity) and 4.2 (wilting point).
b
na = not available.
Source: From Schäfer, 1996. Proc. 10th Int. Peat Congr., Bremen, Germany, 4:77–84. With permission.
© 2003 by CRC Press LLC
Capillary rise, which depends on mesopores in the peat layer underlying the
moorsh, is lower when the degree of decomposition is higher, and varies in height
from 70 to 160 cm. Rate of capillary rise for fibric peats during intensive evapo-
transpiration reaches 10 mm per day (Baden and Eggelsmann, 1963; Szuniewicz
and Szymanowski, 1977). Comparatively, capillary rise would cover 56% of the
evapotranspiration demand in hemic peats and 17 to 23% in sapric peats, depending
on the advancement of MFP. Unsaturated hydraulic conductivity decreases sharply
in moorsh compared with peat materials (Table 2.8). The height of capillary rise
would be less than 10 cm in deeper moorsh layers. Therefore, groundwater must be
maintained at a higher level for grassland grown in those deep moorsh soils (60 cm
in hemic peats and 30 to 50 cm in sapric peats, depending on MFP).
The unit water content (UWC) is a rough indicator of structural changes in peat.
The UWC is the relative volumetric water content of a disturbed peat sample before
and after consolidation under a pressure of 100 kPa. The more advanced the MFP,
the lower are water retention capacity and UWC. For organic soils in an advanced
stage of MFP, the structure is similar to a single-grain mineral soil. The UWC exceeds
2.2 for low MFP, and is less than 1.5 for high MFP. The UWC of the Hm horizon
is 20% lower than that of Hv (Zeitz and Tölle, 1996), thus indicating a higher degree
of MFP for Hm.
Table 2.7 Permeability Change in Soil Layers
across a Peat-Moorsh Soil Profile
Layer
Saturated Hydraulic Conductivity
(Average)
Vertical
(cm d
–1
)
Lateral
(cm d
–1
)
Mean
(cm d
–1
)
Moorsh M
1
160 73 104
Moorsh M
2
136 59 82
Moorsh M
3
61 31 42
Peat T
1
75 6
Peat T
2
85 7
Source: From Okruszko, 1960. Roczniki Nauk
Rolniczych, F74:5–89. With permission.
Table 2.8 Unsaturated Hydraulic Conductivity as Related to Moorsh and Peat
Layers in the Upper Rhinluch Peatland, Germany
Depth
(cm)
Horizon
(Symbol)
Unsaturated Hydraulic Conductivity
pF 1.5
(mm d
–1
)
pF 1.8
(mm d
–1
)
pF 2.0
(mm d
–1
)
pF 2.2
(mm d
–1
)
pF 2.5
(mm d
–1
)
0–10 nHm 2.010 1.394 0.294 0.059 0.008
20–30 nHv 2.934 1.573 0.323 0.077 0.015
30–40 nHa 4.715 2.078 0.468 0.144 0.037
50–60 nHt 6.324 3.114 0.828 0.227 0.056
70–80 nHt 4.874 2.810 0.540 0.142 0.004
Source: From Sauerbrey and Zeitz, 1999. Peatlands. Section 3.3.3.7, in Handbuch
der Bodenkunde. (in German). Blume, H.P., Ed., Loseblätter Ausgabe, Ecomed
Publ., Landsberg, Germany, 20 pp. With permission.
© 2003 by CRC Press LLC
IV. CHANGES IN CHEMICAL PROPERTIES
Peat drainage affects the composition of organic materials, the mineralization of
nitrogen and carbon (emission of greenhouse gases), the composition of inorganic
materials, and drainage water quality. The organic material undergoing humification
comprises bitumens, hemicellulose, lignin, and humic substances (Okruszko, 1993).
Moorsh materials are particularly enriched in humic substances and impoverished
in lignin compared with original peat materials (Table 2.9).
Luthardt (1987) and Behrendt (1995) found that:
1. Cellulose decomposition rate was smaller in MtI-MtII than in MtIII
2. Tillage promoted cellulose decomposition
3. Cellulose decomposition was correlated to volumetric soil moisture content with
maximum rate at 70%
4. Cellulose decomposition rate was higher in intensively cultivated fen soils com-
pared to unplowed areas
In moorsh materials, the ratio of humic to fulvic acids is smaller than in the
original peat materials (Okruszko, 1993). The moorsh materials are enriched in
inorganic materials such as Si, Fe, P, and Al compared with the original peat materials
(Table 2.10). Microelements, sorbed by colloidal organic matter, accumulate in the
moorsh layer (Okruszko, 1993).
More mineralizable N is present in moorsh than in peat materials. Enhanced N
mineralization by 30% in moorsh compared with peat increases N availability to
plants, nitrate leaching potential, and N loss through denitrification. Nitrate leaching
is at risk for drinking water, while denitrification may evolve NO
x
gases, which
contribute to global climate changes. The amount of N bound to fulvic acids,
hemicellulose and cellulose is increased by 30% in moorsh compared with peat
materials (Okruszko, 1993). The most easily mineralized N pool makes up 0.4 to
2.8% of total moorsh N, supplying 77 to 493 kg N ha
–1
yr
–1
as mineral N in the
0–20-cm layer, depending on moorsh stage (Table 2.11). Highest N mineralization
rate in the moorsh layers occurred 5–10 cm below soil surface in the spring, and
15–20 cm below surface in the summer (Frackowiak, 1969). Optimum volumetric
air content in the soil for N mineralization is 20–30%. There was 20% more N
mineralized under arable farming compared with grassland (Gotkiewicz et al., 1975).
The NO
3
-N to NH
4
-N ratio increased with MFP and soil aeration (Gotkiewicz and
Szuniewicz, 1987). The application of mineral fertilizer reduced N mineralization.
Very high application rates of mineral N (e.g., 480 kg N ha
–1
as calcium ammonium
nitrate) and organic N (371 kg N ha
–1
as cattle slurry) may cause a short-term increase
in NO
x
emissions (Augustin, 2001).
The rate of organic matter decomposition is usually assessed from CO
2
evolution.
Decay rate of organic C is smaller when the degree of decomposition is higher
(Kowalczyk, 1978), and is lowest for highly humified moorsh (Table 2.11). The CO
2
evolution was shown to be maximum at groundwater level of 90 cm (Table 2.12).
Lysimeter studies in drained organic soils showed losses from 2.8 to 6.7 Mg CO
2
ha
–1
yr
–1
.Considering contributions of greenhouse gases relative to CO
2
, a climatic
© 2003 by CRC Press LLC
Table 2.9 Average Concentration of Organic Substances in Two Peat-moorsh Soil Profiles in Poland
Soil Horizon
Depth
(cm)
Bitumens
kg kg
–1
dry
matter
Hemicellulose Cellulose Lignin HA
a
FA
a
HA + FA
(kg C) (kg total C)
-1
Topola-Blonie M
1
5–10 0.0404 0.0940 0.0642 0.2520 0.3952 0.1571 0.5523
M
2
15–20 0.0408 0.0869 0.0528 0.2369 0.4458 0.1290 0.5748
M
3
23–28 0.0469 0.0711 0.0502 0.2107 0.4811 0.1373 0.6184
T
1
40–45 0.0501 0.0737 0.0660 0.3835 0.3164 0.0973 0.4137
T
2
75–80 0.0568 0.0703 0.0619 0.3710 0.2982 0.1094 0.4076
Kuwasy M
1
5–10 0.0780 0.0579 0.0396 0.1428 0.4943 0.2080 0.7023
Szymany M
2
15–20 0.0809 0.0657 0.0469 0.1706 0.4960 0.1257 0.6227
M
3
25–30 0.1003 0.0528 0.0488 0.2197 0.4586 0.1198 0.5784
T
1
45–50 0.1088 0.0486 0.0439 0.2839 0.4456 0.1034 0.5490
T
2
90–95 0.0960 0.0327 0.0359 0.2496 0.4920 0.1032 0.5952
a
HA = humic acids; FA = fulvic acids.
Source: From Okruszko, 1960. Roczniki Nauk Rolniczych, F74:5–89. With permission.
© 2003 by CRC Press LLC
impact factor (CO
2
+ CH
4
+ NO
x
) was computed to be between 2.9 and 10.3 Mg
CO
2
ha
–1
yr
–1
in drained fen organic soils (Table 2.13).
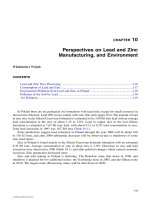
Soluble substances percolate to groundwater as well as ditches, rivers, and lakes
as a result of a positive water balance in drained organic soils. The N leaching
depends on soil type, intensity of land use, and groundwater level (Figure 2.2). Some
nitrate may reach the groundwater through macropores under intensive drainage. In
acid fen soils, the N leaching rate is small (Table 2.14). In calcareous fen soils, N
leaching rates of 40–80 kg N ha
–1
yr
–1
(Scheffer, 1994), sometimes exceeding 140
kg N ha
–1
yr
–1
with groundwater levels deeper than 2 m (Rück, 1991), have been
recorded. Solute transfer generally increases with the advancement of MFP.
V. CHANGES IN BIOLOGICAL PROPERTIES
Heterotrophic bacteria, fungi, amoeba, and microalgae are the dominant groups of
microorganisms in European peatlands. The relative importance of heterotrophic
organisms (73 to 95% of total biomass) and the predominance of testate amoeba in
the protozoan biomass are typical of Sphagnum-dominated peatlands (Mitchell et al.,
Table 2.10 Composition of Ashes in 14 Peat-Moorsh Soils of Poland
Component
Horizon (g kg
–1
)
M
1
M
2
M
3
T
1
T
2
Ash 329 ± 87 226 ± 53 174 ± 37 135 ± 32 102 ± 27
Silica – SiO
2
167 ± 75 94 ± 53 48 ± 30 32 ± 27 9 ± 4
Potassium – K
2
O 0.8 ± 0.21 0.86 ± 0.55 0.47 ± 0.20 0.42 ± 0.25 0.29 ± 0.07
Sodium – Na
2
O 1.89 ± 1.34 2.11 ± 7.12 2.54 ± 2.24 3.08 ± 3.08 2.34 ± 2.57
Calcium – CaO 46.5 ± 20.8 42.5 ± 11.7 37.8 ± 9.3 36.4 ± 9.2 32.2 ± 7.5
Magnesium — MgO 3.21 ± 1.2 3.2 ± 2.1 2.7 ± 2.2 2.2 ± 1.6 2.6 ± 3.3
Phosphorus – P
2
O
5
4.68 ± 4.0 3.21 ± 1.02 1.90 ± 0.32 1.66 ± 0.44 1.40 ± 0.32
Iron – Fe
2
O
3
44.5 ± 26.1 34.8 ± 19.1 33.5 ± 16.3 17.0 ± 8.0 15.6 ± 4.8
Source: From Okruszko, 1960. Roczniki Nauk Rolniczych, F74:5–89. With permission.
Table 2.11 Organic Matter and Nitrogen Mineralization in the 0–20 cm Arable Layer as
Related to Moorsh Stage
Moorsh Degree
OMC
a
(Mg ha
–1
)
Mineralized
OM
a
Mg ha
–1
yr
–1
)
Total N
(Mg N ha
–1
)
Mineralized N (N
min
)
(kg N ha
–1
yr
–1
) (%) (N
min
/N
total
)
MtI 275 2.2–2.8 9.60 77–98 0.8–1.0
MtII 414 6.5–11.4 17.86 281–493 1.6–2.8
MtIII 519 4.0–8.7 21.92 170–369 0.8–1.7
MtIII with a dry,
grain moorsh
468 1.8–3.3 26.00 99–186 0.4–0.7
a
OMC = Organic matter content; OM = Organic matter.
Source: From Frackowiak, 1969. Intensive nitrogen mineralization in moorsh (in Russian with
German summary), in Transformations in Organic Soils under the Influence of Drainage and
Reclamation. Anonymous. Minsk, Belarus, 182–195. With permission.
© 2003 by CRC Press LLC
1999). Actinomycetales, which are adapted to low moisture, high periodic temperature,
and lack of soluble organic compounds (Burzynska-Czekanowska, 1967), prevail (76
to 80% of total number of microbes) in ill-managed moorsh soils (Maciejewska, 1956).
They decrease abruptly to 27% in well-managed areas (water control and fertilization),
where bacteria increase in number from 12–14% to a maximum of 65% (Maciejewska,
1956). Luthardt (1987) and Behrendt (1995) found that the bacteria feeding activity
declined under intensive compared with extensive use, and that soil animals and
microbes interactions producing stable humic substances did not occur in moorsh fen
soils, thus leading to complete mineralization of organic substances.
Mites and springtails make up 90% of the peat-moorsh mesofauna. Unmanaged
grassland soils harbor 12 times more mesofauna than arable soils and four times
more than in soils under managed pasture, especially in the layer immediately below
surface (0–5 cm). Soil mesofauna was found to be 3 to 4 times less abundant in
grassland organic soils slightly affected by MFP compared to similar soils strongly
affected by MFP (Gawlik, 1971).
Table 2.12 Carbon Mineralization and Organic Soil Subsidence as
Related to Groundwater Level
Specification Unit
Groundwater Level
30 cm 60 cm 90 cm 120 cm
Peat Thickness of 50 cm: 57 kg C m
–2
C mineralization g C m
–2
286.00 398.00 490.00 374.00
Soil subsidence Cm yr
–1
0.18 0.25 0.31 0.24
Peat Thickness of 150 cm: 103 kg C m
–2
C mineralization g C m
–2
391.00 562.00 669.00 658.00
Soil subsidence Cm yr
–1
0.41 0.59 0.70 0.69
Source: From Mundel, 1976. Archiv für Acker Pflanzenbau und Bodenkunde,
20:669–679.
Table 2.13
Climatic Impact of Gas Emissions from Wet and Drained Fens in Germany
Greenhouse
Gas
Wet Fens Drained Fens
Net Emission
(kg C or
N ha
–1
yr
–1
)
Climatic
Impact
(kg C ha
–1
yr
–1
)
Net Emission
(kg C or
N ha
–1
yr
–1
)
Climatic
Impact
(kg C ha
–1
yr
–1
)
CO
2
–140 to –2.250
a
–140 to –2250 2900 to 6700 2900 to 6700
CH
4
2.7 to 521 24 to 4585 –1.4
a
to 3.3 –12
b
to 29
N
2
O 0.0 to 0.8 0 to 107 0.3 to 26.9 40 to 3605
Total impact — –2.226
b
to 4.552 — 2928 to 10,334
a
Negative number means a net sink of gases in peatland ecosystems.
b
Negative number means that the organic soil ecosystems attenuate the impact of greenhouse
gases.
Source: From Augustin, 2001. Emission, trapping and climatic importance of trace gases (in
German), in Landschaftsoekologische Moorkunde. Succow, M. and Joosten, H., Eds., E. Sch-
weizerbart’sche Verlagsbuchhandlung (Nägele u. Obermiller), Stuttgart, Germany, 28–40. With
permission.
© 2003 by CRC Press LLC
Makulec and Chmielewski (1994) examined the species, numbers, and biomass
of earthworm communities in response to drainage in the Biebrza fen region of
Poland. Mean densities and biomass of earthworms markedly increased during the
first few years after drainage. Most sites were dominated by Lumbricus rubellus,
which accounted for 60 to 80% of the earthworm population and 80 to 90% of its
biomass. In a meadow drained several decades before, earthworms deposited 40–100
Mg ha
–1
of cast dry matter during the growing season. The number of fungi increased
in earthworm casts with the advancement of MFP, but that of Actinomycetes
decreased. Earthworms reduced the number of microorganisms in soils rich in
bacteria, and increased microbial populations in soils poor in microflora.
Figure 2.2 Relationship between groundwater level and N-leaching (Drawn from: Behrendt
et al., Zeitschrift für Kulturtechnik und Landentwicklung, 35:200–208,1993. With
permission.)
Table 2.14 Mean Annual Nutrient Loss from a Peatland with 200 mm Runoff
Water per Year
Mire Type and Use N (kg ha
–1
) P (kg ha
–1
) K (kg ha
–1
) Ca (kg ha
–1
)
Raised mires
Uncultivated
Grassland
Arable
5
2–20
10–40
1.3–1.7
4–9
8–17
10–20
20–30
ND
12–20
34–45
ND
Fens
Grassland
Arable
5–20
40–80
0.1–2.0
0.1–5.0
10–50
20–50
20–150
20–150
ND = not determined.
Source: From Scheffer, 1994. Dynamics of Elements in Fen Soils (in German).
NNA-Berich+ 7 H, 2:67–73, Niedersächsische Naturschutz Akademie, Schnev-
erdingen, Lower Saxonia, Germany. With permission.
1981
1982
1980
20
15
10
5
0
50 70 90 120
N leaching (g NO
3
-N m
-2
yr
-1
)
Groundwater level below soil surface (cm)
© 2003 by CRC Press LLC
Wasilewska (1994) studied nematodes as bio-indicators of MFP in alder fens.
The critical values of four bioindicators were assessed in relation to a high degree
of MFP as follows:
• More than 5 ¥ 106 individuals m
-2
for Paratylenchus sp.,
• Less than 2% abundance for omnivores and predators in a community
• Ratios of the number of bacteria and fungivores to the number of obligatory plant
parasites less than 2
• A maturity index less than 1.7
The diversity of seven ant species in natural and drained fen soils was investigated
by Petal (1994). Nest density and frequency were lower in soils derived from alder
peat compared to sedge or sedge-moss peat materials. Number and abundance of
ant species, as well as nest frequency and density, were lower in pristine and
previously drained alder peats than in recently drained sites. The soil matrix of ant
nests contained more humic substances and exchangeable cations compared with
the surrounding soil matrix.
VI. SOIL DEGRADATION SYMPTOMS AND PREVENTION
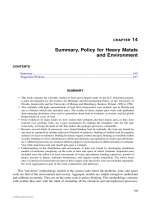
Advanced MFP in the top soil and structural damage in the subsoil are typical
features of degraded soils (Table 2.15). Shallow fen organic soils are highly degraded
when a layer with laminar structure hinders water infiltration at a depth of 15–25
cm below soil surface (Figure 2.3). Such a layer forms a physical barrier to root
penetration and capillary rise. The soil surface becomes dry and resistant to rewetting
and penetration by water. Especially in the spring, the bare soil is highly susceptible
to wind erosion. Schäfer et al. (1991) reported soil losses of 3 to 7 Mg ha
–1
d
–1
with
a wind speed of 7 to 13 m s
–1
.
The MFP is alleviated by grassland farming and groundwater level maintained
close to 30 cm below the soil surface. Mineralization and gas emissions increase
markedly when the water level is drawn below 30 cm. Maximum forage yield is
obtained at a groundwater level between 40 and 60 cm (Wessolek, 1999). More
intensive soil management practices requiring deeper water table levels are thus at
increasing risk to the environment.
VII. CONCLUSION
In drained organic soils, the moorsh-forming process is characterized by repeated
shrinkage and swelling, as well as loss of organic substances in upper soil layers.
Indicators of change in physical properties are soil morphology, volume of the solid
phase, soil porosity and water regime. Chemical indicators are the composition of
organic and inorganic materials, N and C mineralization rates, and the quality of
drainage water. Bioindicators were proposed in Europe for microorganisms and the
mesofauna. A minimum dataset for assessing soil degradation depends on require-
ments for sustainable management of soil–plant systems.
© 2003 by CRC Press LLC
Table 2.15 Trend in Soil Attributes and Functions with Advancement of the Moor
sh-forming Process
Increase Decrease
Attribute
Bulk density (0.1 Æ 0.4 g cm
–3
)
Ash content (0.10 Æ 0.70 kg kg
–1
)
Permanent wilting point (0.10 Æ 0.30 m
3
m
–3
)
Cation exchange capacity: 50 Æ 450 mmol L
–1
Total porosity: > 0.90 Æ < 0.80 m
3
m
–3
C/N ratio: 30 Æ 10, dimensionless
Macro- and mesopores: 0.25 Æ < 0.10 m
3
m
–3
Field capacity: > 0.50 Æ < 0.30 m
3
m
–3
Permeability (kf): > 100 Æ < 10 cm d
–1
Unsaturated hydraulic conductivity (ku): > 5 Æ 0.5 mm d
–1
Function
1. Medium for plant growth
Nutrient requirements
Temperature variation
Irregularity of micro relief
2. Regulation and partitioning of water flow
Risk of water-logging
Risk of drought
Risk of wind erosion
3. Environmental buffer for hazardous compounds
Nitrification: 0 Æ 1000 kg NO
3
N ha
–1
yr
–1
Total emission of greenhouse gases
Groundwater level
Denitrification potential
Emission of methane
Source: From Zeitz, 1991. Zeitschrift für Kulturtechnik und Landentwicklung, 32: 227–234; Luthardt, 1993. Naturschutz
und Landschaftspflege in Brandenburg, Sonderheft Niedermoore, 35–40; Roeschmann et al., 1993. Geologisches
Jahrbuch, F29: 3–49. With permission.
© 2003 by CRC Press LLC
REFERENCES
Augustin J. 2001. Emission, trapping and climatic importance of trace gases (in German), in
Landschaftsoekologische Moorkunde. Succow, M. and Joosten, H., Eds., E. Schweiz-
erbart’sche Verlagsbuchhandlung (Nägele u. Obermiller), Stuttgart, Germany, 28–40.
Baden, W. and Eggelsmann, R. 1963. Permeability of organic soils (in German). Zeitschrift
für Kulturtechnik und Flurbereinigung, 4:226–254.
Behrendt, A. 1995. Peat wastage in northern fen mires of Germany, a contribution to mire
conservation (in German). Dissertation, Landwirtschaftlich Gärtnische Fakultät der
Humboldt Universität zu Berlin, 179 pp.
Behrendt, A., Mundel, G., and Hölzel, D. 1993. Studies on carbon and nitrogen transforma-
tions in fen peat soils using lysimeters (in German). Zeitschrift für Kulturtechnik und
Landentwicklung, 35:200–208.
Burghardt, W. and Ilnicki, P. 1978. Subsidence in repeatedly drained bog soils in flatlands of
northwestern Germany. Report 4: Change in soil water content and pore-size distri-
bution as a result of subsidence (in German). Zeitschrift für Kulturtechnik und Flurb-
ereinigung, 19:146–157.
Burzynska-Czekanowska, E. 1967. The flora of Actinomycetes in important types of peat (in
Polish with English summary). Zeszyty Problemowe Postepow Nauk Rolniczych,
76:313–353.
Frackowiak, H. 1969. Intensive nitrogen mineralization in moorsh (in Russian with German
summary), in Transformations in Organic Soils under the Influence of Drainage and
Reclamation. Anonymous. Minsk, Belarus, 182–195.
Gawlik, J. 1971. Effect of use of moorsh soils on moisture-air conditions and soil fauna (in
Polish with English summary). Annales Universitatis Mariae Curie-Sklodowska, E
26:375–395.
Gotkiewicz, J., Kowalczyk, Z., and Okruszko, H. 1975. Mineralization of nitrogen and carbon
compounds in peat-moorsh soils under different air and moisture conditions (in Polish
with English summary). Roczniki Nauk Rolniczych, F79.1:131–150.
Gotkiewicz, J. and Szuniewicz, J. 1987. Transformation of sites and soils on agricultural
experimental areas (in Polish with English summary). Bibl. Wiadomosci Instytutu
Melioracji i Uzytkow Zielonych, 68:33–41.
Figure 2.3 Barrier layer in a degraded organic soil: a = MtII Putzar soil, b = MtIII Klein-Markow
soil; c = fen peat; d = MtI fen organic soil; e = MtII fen organic soil. (Adapted from
Zeitz et al., Feldwirtschaft, 28:211–216, 1987. With permission.)
Soil
profile
Water
table
level
Penetration
force (kPa)
Shear
strength (kPa)
20 30 40 200 600 1000
0
20
40
60
80
100
20
40
60
80
100
Depth below soil surface (cm)
Depth below soil surface (cm)
Hv
Ht
Ha
Hm
high
low
a
b
c
d
e
b
© 2003 by CRC Press LLC
Ilnicki, P. 1967. Peat shrinkage by drying as related to structure and physical properties (in
Polish with English summary). Zeszyty Problemowe Postepow Nauk Rolniczych,
76:197–311.
Ilnicki, P. 1982. Hysteresis of the water tension curve in organic soils (in German with English
summary). Zeitschrift für Pflanzenernährung und Bodenkunde, 145:363–374.
Kowalczyk, Z. 1978. Effect of moisture content in peat-muck soils on biological activity as
determined by the cellulose test (in Polish with English summary). Roczniki Nauk
Rolniczych, F79:67–78.
Luthardt, V. 1987. Ecological studies on deep fens at different developmental stage and used
in agriculture (in German). Dissertation, Akademie der Landwirtschaftwissenschaften
der DDR, Berlin, Germany, 183 pp.
Luthardt, V. 1993. Development objectives for fen regions with an example from Sernitz-
Niederung near Greiffenberg (in German). Naturschutz und Landschaftspflege in
Brandenburg, Sonderheft Niedermoore, 35–40.
Maciejewska, Z. 1956. The interactions between peat soil microflora, land use and plant cover
(in Polish). Zjazd Naukowy Polskiego Towarzystwa Gleboznawczego, IX:20–23.
Makulec, G. and Chmielewski, K. 1994. Earthworm communities and their role in hydrogenic
soils, in Proc. Int. Peat Soc. Symp., Jankowska-Huflejt, H. and Golubiewska, E., Eds.,
Warsaw-Biebrza, Poland, 417–427
Mitchell, E.A.D. et al. 1999. The microbial loop at the surface of five Sphagnum-dominated
peatlands in Europe: Structure and effects of elevated CO
2
. Proc. Int. Peat Soc. Symp.,
Finnish Peatland Society, Jokioinen, Finland, 86.
Mundel, G., 1976. Mineralization of fen peat (in German). Archiv für Acker Pflanzenbau und
Bodenkunde, 20:669–679.
Okruszko, H. 1960. Muck soils of valley peatlands and their chemical and physical properties
(in Polish with English summary). Roczniki Nauk Rolniczych, F74:5–89.
Okruszko, H. 1971. Determination of specific gravity of hydrogenic soils on the basis of their
mineral particles content (in Polish with English summary). Wiadomosci Instytutu
Melioracji i Uzytkow Zielonych, 10.1:47–54.
Okruszko, H. 1976. Keys to hydrogenic soil investigation and classification for reclamation
purposes (in Polish with English summary). Bibl. Wiadomosci Instytutu Melioracji i
Uzytkow Zielonych, 52:7–54.
Okruszko, H. 1985. Decession in the natural evolution of low peatlands. Intecol. Bull.,
12:89–94.
Okruszko, H. 1993. Transformation of fen-peat soil under the impact of draining. Pol. Akad.
Nauk, 406:3–75.
Okruszko, H. 1994. System of hydrogenic soil classification used in Poland. Bibl. Wiadomosci
Instytutu Melioracji i Uzytkow Zielonych, 84:5–27.
Petal, J. 1994. Ant communities in Biebrza marshland, in Proc. Int. Peat Soc. Symp. Jan-
kowska-Huflejt, H. and Golubiewska, E., Eds., Warsaw-Biebrza, Poland, 399–406.
Roeschmann, G. et al. 1993. Mires in soil classification (in German). Geologisches Jahrbuch,
F29:3–49.
Rück, F. 1991. Nitrogen content and nitrate leaching in calcareous fen soils under arable
farming and abandoned land (in German), in VDLUFA Soil Excursion in Ulm,
Verband Deutscher Landwirtschaftlicher Untersuchungs und Forschungsanstalten,
Darmstadt, Germany, 51–55.
Sauerbrey, R. and Zeitz, J. 1999. Peatlands. Section 3.3.3.7, in Handbuch der Bodenkunde.
(in German). Blume, H.P., Ed., Loseblätter Ausgabe, Ecomed Publ., Landsberg,
Germany, 20 pp.
© 2003 by CRC Press LLC
Schäfer, W., Neemann, W., and Kuntze, H. 1991. Wind erosion on calcareous fenlands in
North Germany. Fenland Symp., Cambridge, England.
Schäfer, W. 1996. Changes in physical properties of organic soils induced by land use. Proc.
10th Int. Peat Congr., 4:77–84.
Scheffer, B. 1994. Dynamics of elements in fen soils (in German). NNA-Berich+ 7 H, 2:67–73,
Niedersächsische Naturschutz Akademie, Schneverdingen, Lower Saxonia, Germany.
Schmidt, W. and Illner, K. 1976. Soil formation in fen soils used in agriculture (in German).
Melioration Landwirtschaftsbau, 10:166–168.
Sponagel, H. et al. 1996. Methods of Soil Cartography (in German). E. Schweizerbart’sche
Verlagsbuchhandlung (Nägele u. Obermiller), Stuttgart, Germany, 392 pp.
Szuniewicz, J. and Szymanowski, M. 1977. Physico-hydrological properties and the formation
of air-water conditions on distinguished sites of the Wizna fen. Polish Ecol. Stud.,
3(3):17–31.
Titze, E. 1966. Water and air composition of the upper earthy layer of the Klenzer fen and
its influence on yield (in German). Dissertation, Universität Rostock, 112 pp.
TGL 31222/03. 1985. Standard methods in soil physics — Density and porosity (in German).
Staatlich Technische Normen, Gütevorschriften und Lieferbedingungen Standards der
DDR, Berlin.
Wasilewska, L. 1994. Changes in biotic indices in meadow ecosystems after drainage of fens,
in Proc. Int. Peat Soc. Symp. Jankowska-Huflejt, H. and Golubiewska E., Eds.,
Warsaw-Biebrza, Poland, 407–416
Wessolek, G. 1999. Processes of soil formation in fen mires (in German). Ökologische Hefte,
Landwirtschaftlich Gärtnische Fakultät der Humboldt Universität zu Berlin,
11:96–122.
Zeitz, J. 1991. Determination of the permeability of fen soils across soil formation stages (in
German). Zeitschrift für Kulturtechnik und Landentwicklung, 32:227–234.
Zeitz, J. 1992. Physical properties of soil horizons in fen peat soils used in agriculture (in
German). Zeitschrift für Kulturtechnik und Landentwicklung, 33:301–307.
Zeitz, J., Titze, E., and Kosov, W. 1987. Influence of excessive drainage on soil condition and
yield in deep fen peat (in German). Feldwirtschaft, 28:211–216.
Zeitz, J. and Tölle, R. 1996. Soil properties of genetically originated peat horizons in drained
fens. Proc. 10th Int. Peat Congr., 2:198–206.
© 2003 by CRC Press LLC