ORGANIC SOILS and PEAT MATERIALS for SUSTAINABLE AGRICULTURE - CHAPTER 3 ppsx
Bạn đang xem bản rút gọn của tài liệu. Xem và tải ngay bản đầy đủ của tài liệu tại đây (1.17 MB, 34 trang )
CHAPTER
3
Water-Related Physical Attributes
of Organic Soils
Tomasz Brandyk, Jan Szatylowicz, Ryszard Oleszczuk, and Tomasz Gnatowski
CONTENTS
Abstract
I. Introduction
II. Basic Physical Properties
III. Soil Water Characteristic
A. Methods of Determination
B. Water Retention of Peat and Moorsh Materials
IV. Saturated Hydraulic Conductivity
A. Methods of Determination
B. Anisotropy
C. Seasonal Variation
V. Unsaturated Hydraulic Conductivity
VI. Shrinkage Characteristic
VII. Water Repellency
A. Methods of Determination
B. Water Repellency of Organic Soils
VIII. Spatial Variability
IX. Conclusion
References
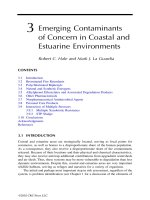
ABSTRACT
Conservation of organic soils used for agriculture requires proper regulation and
partitioning of water flow in the environment. This chapter reviews the physical
© 2003 by CRC Press LLC
properties involved in water retention and transfer in drained organic soils. Basic
physical properties are bulk density, specific density, porosity, and ash content. Water
retention characteristics of organic soils are influenced by the degree of peat decom-
position. Water retention characteristics can be derived from other soil properties
using pedotransfer functions. The results of saturated and unsaturated hydraulic
conductivity measurements must be interpreted in reference to factors influencing
their determination. Relationships between concomitant changes in soil moisture
and volume during shrinkage are illustrated by characteristic curves. For converting
volume changes into crack volume and subsidence, a dimensionless shrinkage geom-
etry factor can be used. The authors investigated:
1. The influence of moisture content on water repellency
2. The effect of repellency on field moisture distribution patterns
3. The spatial variability of bulk density, hydraulic conductivity, moisture retention
characteristics, and moisture content at plot scale
Shrinkage characteristics, the shrinkage geometry factor, and parameters describ-
ing water repellency should be incorporated into hydrological models examining
simultaneously water transport and the subsidence of organic soils.
I. INTRODUCTION
Peatland hydrology is fundamental to understanding, quantifying, and evaluating
the key soil function of water regulation and partitioning in the environment. Water
is the driving force for peatland formation (carbon sink) and maintenance (biodi-
versity and productivity). This is why peatland hydrology has become a research
area of high priority worldwide. To evaluate hydrological phenomena, such as water
storage, water table fluctuation, and evapotranspiration in peatlands, water-related
physical properties of organic soils must be quantified. A peculiar property of organic
soils is that they originate in situ and undergo transformations in response to changes
in water conditions.
The main purpose of this chapter is to review soil properties important for water
retention and conduction in organic soils. Special attention is also given to the
shrinkage process, water repellency, and spatial variability of organic soil properties.
II. BASIC PHYSICAL PROPERTIES
Soil consists of solid, liquid, and gaseous phases. The solid phase of organic
soils is made of plant fibers, humus, and mineral matter such as grains of different
sizes (from sand to clay) as well as amorphous substances in the form of carbon-
ates, phosphates, and hydroxides. The rate at which plant materials in mires are
decomposed depends on many factors such as acidity, temperature, moisture,
oxygen supply, biochemical makeup, as well as peat organisms in terms of com-
position and number. The most widely used method to determine the degree of
© 2003 by CRC Press LLC
peat decomposition is the Von Post method (Von Post, 1922) with its 10 classes
of humification (i.e., H1 referring to undecomposed peat and H10 to completely
decomposed peat).
Soil bulk density is soil mass per unit volume. Peat bulk density is determined
by dividing the oven dry (105°C) peat mass by the volume of a core of undisturbed
peat samples. The bulk density of peat deposits varies according to botanical com-
position and degree of peat decomposition. Moss peat generally shows a smaller
bulk density than fen peat, mainly due to a lower degree of decomposition and
smaller ash content. With an increasing degree of decomposition, an increase in bulk
density is often observed. Päivänen (1973) reported a positive and approximately
linear relationship between bulk density and the Von Post humification scale for
Sphagnum and Carex peats. Increase in bulk density with increasing degree of
decomposition was smallest with Sphagnum peat and largest with sedge peat. In
peat deposits, bulk density increases with depth, primarily due to the burden of
overlying peat layers. Bulk density values of Finnish peats from undisturbed and
drained areas varied from 0.04 to 0.20 g cm
–3
(Päivänen, 1973). Values for Minnesota
peats ranged from 0.02 to 0.26 g cm
–3
(Boelter, 1969). Values as high as 0.2 to 0.4
g cm
–3
have been reported for fen peats of Central Europe (Okruszko, 1993).
Particle density is the dry mass of solids divided by solid volume. Average
particle density of the organic soil mass is 1.45 g cm
–3
, varying slightly from 1.3 to
1.6 g cm
–3
, depending on degree of decomposition (Okruszko, 1971). Such variations
in particle density are small compared with bulk density. For peat materials in an
advanced stage of decomposition, particle gravity is greatest for woody peat. Peat
particle density depends largely on ash content.
Ash content is determined by igniting dried peat in a muffle furnace at about
550∞C until constant weight. Ash content is expressed as the percentage of ignited
residue to the quantity of dry matter. Ash content of sedge and woody peats is
considerably higher than that of Sphagnum peat. In general, ash content is higher
in fen peat than in bog peat. Okruszko (1971) obtained a linear relationship between
particle density (
rr
rr
p
in g cm
–3
) and ash content or loss on ignition (M in %) from
2996 peat samples containing 0.7 to 99.5% ash (7 to 995 g kg
–1
), as follows:
r
p
= 0.011M + 1.451, r = 0.96 (3.1)
Peat particle density thus increases by 0.011 g cm
–3
for each 1% or 10 g kg
–1
increase
in ash content above 1.451 g cm
–3
.
Peat is a highly porous material. The pores differ in size and shape, depending
on the geometry of plant residues and on degree of peat decomposition. Total porosity
can be assessed from bulk density and particle density. Total porosity of peat is
about 0.97 m
3
m
–3
for undecomposed peats and 0.81–0.85 m
3
m
–3
for highly decom-
posed peats (Boelter, 1969; Päivänen, 1973). Peat is also characterized by its volume
percentage of the solid phase, computed as the ratio of bulk density to particle
density. According to Okruszko (1993), the mean volume of the solid phase is 0.08
m
3
m
–3
for slightly decomposed peat, 0.10 m
3
m
–3
for moderately decomposed peat,
and 0.11 m
3
m
–3
for highly decomposed peat.
© 2003 by CRC Press LLC
III. SOIL WATER CHARACTERISTIC
A. Methods of Determination
The water retention curve refers to the relationship between soil water content
and matric potential. The exact relationship can be determined in the laboratory
using undisturbed soil samples, a sand table, and pressure chambers (Klute, 1986),
or directly in the field using tensiometers and time-domain reflectometers (TDR).
From this curve, we obtain plant-available water, defined as the amount of water
held by a soil between field capacity and wilting point. In the literature, soil water
matric potential at field capacity ranges from about 50 to 500 cm (pF 0.7 to 2.7 or
–5 to –50 kPa). Water content at pF 4.2 has been usually considered as the permanent
wilting point or the lower limit of plant-available water.
Determining the water retention curve directly can be expensive and time con-
suming. For mineral soils, many attempts have been made from easily measured
standard soil properties (Tietje and Tapkenhinrichs, 1993). Pedotransfer functions
for predicting the water retention curve can be divided into two main types: point
estimation and parametric estimation. Point estimation is an empirical function that
predicts water content at a predefined potential. It provides data in a tabular form,
which complicates mathematical and statistical operations. Parametric estimation of
pedotransfer functions is based on the assumption that the relationship between water
content (
) and matric potential (h) can be described adequately by a hydraulic
model (e.g., Van Genuchten, 1980). Empirical functions were developed to estimate
parameters of the hydraulic model from easily measured properties. It yields a
continuous function for
(h), thus facilitating mathematical and statistical operations.
For organic soils, very few attempts have been made to estimate water content
at a predefined potential from certain peat properties. Boelter (1969), Päivänen
(1973) and Szymanowski (1993a) used regression equations to relate water content
at certain pressure head values to peat bulk density. Boelter (1969) developed
empirical equations for Minnesota moss and herbaceous peats, as well as peats with
a high wood content. Bulk density of peat samples ranged from 0.02 to 0.25 g cm
–3
.
Equations developed by Boelter (1969) are listed in Table 3.1. In Finland, Päivänen
(1973) studied Sphagnum-dominated peat materials varying in degree of humifica-
Table 3.1 Regression Equations Relating Volumetric Moisture
Content (q in %) to Bulk Density (r
b
in g cm
–3
)
at Different Soil Water Matric Potentials
Matric Potential
(pF) Regression Equations R
2
0.7 0.70
2.0 0.88
4.2 0.82
Source: From Boelter, D.H. 1969. Soil Sci. Soc. Am. Proc.,
33:606–609. With permission.
qrr=+ -39 67 638 29 2010 89
2
.
bb
‡
qrr=+ -2 06 719 35 1809 68
2
.
bb
qrr=+ -1 57 115 28 107 77
2
.
bb
© 2003 by CRC Press LLC
tion. Bulk density was in the range between 0.037 and 0.207 g cm
–3
and regression
equations were similar. Szymanowski (1993a) analyzed 1588 fen peat samples from
the Biebrza River Valley and proposed empirical regression equations relating bulk
density to moisture contents at pF values of 2.7 and 4.2. Bulk density ranged from
0.136 g cm
–3
for moss peat up to 0.233 g cm
–3
for moorsh layers. The regression
equations developed by Szymanowski (1993a) are presented in Table 3.2.
Weiss et al. (1998) tested continuous moisture retention models for organic soils
and found that the Van Genuchten’s model (1980) was most suitable if residual water
content was omitted. The model was presented in the following form:
(3.2)
where
is moisture content (m
3
m
–3
s
is saturated moisture content (m
3
m
–3
), h
is pressure head in cm H
2
O, aa
aa
(cm
–1
) and n (dimensionless) are parameters defining
the Van Genuchten curve shape. Weiss et al. (1998) proposed to evaluate shape
parameters required in Equation 3.2 as follows:
(3.3)
where
rr
rr
is bulk density (g cm
–3
), C and S are Carex and Sphagnum content as
percentages, respectively, Layer 1 is the layer located 0–10 cm below peat surface
and is a qualitative variable having a value of 1 or 0. Moisture content at saturation
(
s
) was obtained from sample porosity. The percentage of botanical components
was included in Equation 3.3 because the difference in water retention between
different peat types can be explained not only by differences in peat characteristics
Table 3.2 Regression Equations Relating Volumetric Moisture Content (q in
%) to Bulk Density (r
b
in g cm
–3
) in Fen Peat at Different Soil Water
Matric Potentials
Matric Potential
(pF) Type of Peat Regression Equation
No. of
Samples r
2
2.7 Sedge moss
q = 18.43 + 189.46r
b
232 0.576
Tall sedge
q = 28.98 + 143.90r
b
264 0.295
Reed
q = 38.63 + 94.19r
b
207 0.237
Alder
q = 48.22 + 65.35r
b
201 0.170
Moorsh
q = 40.52 + 38.10r
b
552 0.045
4.2 Sedge moss
q = –4.43 + 160.29r
b
232 0.773
Tall sedge
q = 2.10 + 128.16r
b
264 0.456
Reed
q = 2.38 + 128.76r
b
207 0.527
Alder
q = 8.07 + 97.29r
b
201 0.404
Moorsh
q = 10.75 + 66.66r
b
552 0.441
Source: From Szymanowski, M. 1993a. Wiadomosci Instytutu Melioracji i Uzytkow
Zielonych, XVII(3):153–174. With permission.
θθ α=+
−+
s
nn
h[()]1
11/
n C Layer
C S Layer
=− + + −
=− − − +
1 49 3 56 13 2 0 00027 0 037 1
51 8 0 0057 0 01 0 53 1
2
10
2
. . .
() . . . .
ρρ
αρlog
© 2003 by CRC Press LLC
related to bulk density, but also by differences in plant residues, cell structure, and
peat pore geometry. The pedotransfer functions developed by Weiss et al. (1998)
were based on 152 peat samples collected from 38 undrained and drained pine mires
in Finland with soil bulk density ranging from 0.04 g cm
–3
to 0.18 g cm
–3
. Pedo-
transfer functions for predicting the water retention curve of organic soils were also
developed by Wösten et al. (1999), who used the Food and Agriculture Organization
(FAO) definition of histic horizons. Moisture retention curves used in the previously
described models were based on desorption curves, and hysteresis effects were not
taken into account. Effects of swelling and shrinkage were also neglected.
B. Water Retention of Peat and Moorsh Materials
The relationship between matric potential and soil moisture content in organic
soils depends on degree of decomposition and botanical composition of peat resi-
dues. Soil water characteristics of slightly, partially, or highly decomposed Sphag-
num peat (high bog peat) and reed peat (fen peat) materials corresponding to the
Von Post humification scale of H1–2, H5–6, and H9–10, respectively, are presented
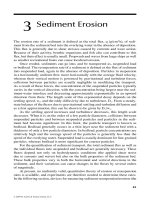
in Figure 3.1. Curves for Sphagnum peat were derived from measurements performed
by Päivänen (1973). The curve for slightly decomposed Sphagnum peat (Figure 3.1a)
shows a loss of more than 54% of its volumetric moisture content at a matric potential
of 50 cm (pF 1.7), while the curve for slightly decomposed reed peat (Figure 3.1b)
shows a loss of about 15% of moisture content. The partially or highly decomposed
Sphagnum peat lost 11–19% of its moisture content at the same matric potential,
whereas partially or highly decomposed reed peat lost 4–6%. The content in plant-
available water, computed by difference in moisture content between pF values of
1.7 and 4.2, increased from 0.25 to 0.55 m
3
m
–3
in Sphagnum peat and decreased
from 0.65 to 0.50 m
3
m
–3
in reed peat materials with increasing peat decomposition.
Figure 3.1 Water retention curves for Sphagnum (a) and reed (b) peats by degree of decom-
position. (Data for Sphagnum peats from Päivänen, J. 1973. Acta For. Fenn.,
129:1–70. With permission.)
0.0 0.2 0.4 0.6 0.8 1 .0
0.0
0.5
1.0
1.5
2.0
2.5
3.0
3.5
4.0
4.5
5.0
0.0 0.2 0.4 0.6 0.8 1 .0
un de co mp os ed
partially decomposed
de co mp os ed
slightly decomposed
partially decomposed
highly decomposed
Sphagnum peat
Reed peat
Soil water matric potential (pF)
Moisture content (m
3
m
-3
)
Moisture content (m
3
m
-3
)
a)
b)
© 2003 by CRC Press LLC
In both cases, an increase in degree of decomposition was associated with an increase
in moisture content at wilting point.
Drainage and intensive use of peatlands lead to the moorsh-forming process
(MFP) (Okruszko, 1976). The moorshing of organic soils comprises biological,
chemical, and physical changes driven by a decrease in water content and an increase
in air content. A moorsh is formed in the top layers. The basic feature differentiating
the moorsh from the peat layers is soil structure: the moorsh is usually grainy, while
the peat ranges from fibrous to amorphous depending on the degree of humification.
Okruszko (1976, 1993) divided moorsh formations into three types:
1. The peaty moorsh has plant residues that are macroscopically visible.
2. The humic moorsh shows a crumbly structure.
3. The grainy moorsh has a grainy structure with frequent hard grains formed by
humus condensation.
The amount of plant-available water may decline from 0.67 m
3
m
–3
in peaty moorsh
to 0.31 m
3
m
–3
in grainy moorsh (Figure 3.2). The moisture content corresponding
to the permanent wilting point rises with the advancement of MFP. The MFP
decreases total porosity up to 0.09% in the moorsh compared with the original peat
material (Okruszko, 1993).
IV. SATURATED HYDRAULIC CONDUCTIVITY
A. Methods of Determination
Hydraulic conductivity controls infiltration rate through soil surface as well as
capillary flux from the groundwater table. Hydraulic conductivity of saturated soils
Figure 3.2 Water retention curves of moorsh materials.
0.0 0.2 0.4 0.6 0.8 1.0
0.0
0.5
1.0
1.5
2.0
2.5
3.0
3.5
4.0
4.5
5.0
grainy
humic
peaty
Soil water matric potential (pF)
Moisture content (m
3
m
-3
)
© 2003 by CRC Press LLC
may be measured either in the laboratory (Klute and Dirksen, 1986) or in the field
(Amoozegar and Warrick, 1986). Laboratory methods establish rectilinear flow
through a sample, and to control not only temperature or solute and gas content in
soil water, but also boundary conditions. Field methods minimize loss of structure
or change in soil porosity using much larger samples. Hydraulic conductivity of
saturated peat layers located below the groundwater table has been measured using
the piezometer method and the auger hole method (Rycroft et al., 1975a). The auger
hole method assesses saturated hydraulic conductivity in the horizontal direction.
The piezometer method can be used to determine the hydraulic conductivity in the
vertical direction. The auger hole method gives the average peat hydraulic conduc-
tivity between groundwater level and the bottom of the hole.
Hydraulic conductivity is defined by Darcy’s law. According to Ingram et al.
(1974) and Rycroft et al. (1975b), peat behavior, especially highly decomposed peat,
may depart substantially from Darcy’s law. The “non-Darcian” behavior was attrib-
uted to elastic properties of peat under compression and to the effective stress
principle (Hemond and Goldman, 1985). Nevertheless, Hemond and Goldman
(1985) argued that Darcy’s law remained an appropriate tool for use in wetland
hydrological modeling.
In organic soils, a decrease in hydraulic conductivity values with time of mea-
surement was observed by Ivanov (1953) and Bondarenko et al. (1975). Changes
with time of hydraulic conductivity in moderately decomposed fen organic soil
materials are illustrated in Figure 3.3. After 650 h of laboratory measurements,
saturated hydraulic conductivity declined to 70% of its initial value. Such variation
Figure 3.3 Variation with time in saturated hydraulic conductivity of a fen organic soil.
0
50
100
150
200
250
300
350
400
sample 1
sample 2
sample 3
sample 4
0
50
100
150
200
250
300
350
400
sample 1
sample 2
sample 3
sample 4
0 72 144 216 288 360 432 504 576 648 720
Time (h)
Saturated hydraulic conductivity (cm d
-1
)
© 2003 by CRC Press LLC
in hydraulic conductivity was explained by the swelling of peat colloids as well as
by peat particle migration induced by fluid flow (Ivanov, 1953). Both processes lead
to pore blocking, thus reducing local porosity. Bondarenko et al. (1975) found that
the decrease in hydraulic conductivity was connected with a change in pore space
geometry due to colmatation of soil pores by gas bubbles and other by-products of
organic matter decomposition through anaerobic microbiological processes.
Boelter (1965) and Päivänen (1973) found that laboratory evaluation of peat
hydraulic conductivity yielded higher values than field evaluation, probably caused
by nonconstant flow due to leakage and soil disturbance. Chason and Siegel (1986)
also found a general trend for laboratory data to show larger ranges than field data.
The smaller ranges of field values may reflect measurements in much larger and
thus more representative samples. Laboratory tests may be more affected by peat
heterogeneity within the column at a smaller scale.
B. Anisotropy
Peat layers are commonly anisotropic, therefore, hydraulic conductivity is dif-
ferent in the vertical than in the horizontal direction. Ostromecki (1936) found that
vertical hydraulic conductivity values (K
v
) of fen peat were on average two times
larger than horizontal hydraulic conductivity values (K
h
), and that the K
v
/K
h
ratio
depended on degree of decomposition. For slightly decomposed fen peat materials,
the ratio was greater than 2; for highly decomposed materials, it was equal to 1.
Lundin (1964) found higher values for vertical than horizontal hydraulic conductivity
in Belorussian fen peat; the K
v
/K
h
ratio was highest in reed peat and lowest in alder
peat. Boelter (1965) found no significant difference between horizontal (measured
by the piezometer method) and vertical (measured by the tube method) hydraulic
conductivities in slightly to highly decomposed peat materials. Korpijaakko and
Radforth (1972) found horizontal saturated hydraulic conductivity value to be greater
than the vertical one only close to the surface of a high bog soil. Chason and Siegel
(1986) reported that the K
v
/K
h
ratio was highly variable across peat columns, but
that K
h
was generally one to two orders of magnitude greater than K
v
. They explained
their results by the stratification of Sphagnum peat. When Sphagnum was alive, stem
orientation was mainly vertical, thus creating vertical passageways for water. After
the plants died, the stems fell over and the decaying process began, thus creating
more horizontal planar passageways for water.
The decrease in hydraulic conductivity with increasing depth of Sphagnum peat
has been observed by Ivanov (1953). This phenomenon was attributed to the acrotelm
or “active layer” usually present at the surface of developing mires, characterized
by a very loose, open, and porous structure associated with high hydraulic conduc-
tivity values. Päivänen (1973) also observed a decrease in hydraulic conductivity
with increasing depth in forested Finnish peatlands. Preferential water flow may also
be induced by channels resulting from decaying rhizosphere roots or activities of
soil invertebrates. In fen peat materials, marked dependence of saturated hydraulic
conductivity on depth occurred (Figure 3.4). The values for drained fen organic soils
were generally lower compared with undrained soils.
© 2003 by CRC Press LLC
Hydraulic conductivity of peat deposits varies with degree of peat decomposition
(Rycroft et al., 1975a, 1975b). Slightly decomposed peat shows values of the order
of 10
–3
to 10
–5
m s
–1
, compared with 10
–8
m s
–1
for highly decomposed peat. A
negative hyperbolic relationship between saturated hydraulic conductivity and degree
of decomposition was obtained by Baden and Eggelsmann (1963) for Sphagnum,
Carex or Phragmites peat deposits. The relationship was more pronounced for
Sphagnum than for Phragmites or Carex peat deposits. In Sphagnum peat, saturated
hydraulic conductivity was considerably lower compared with fen peat. In laboratory
and field experiments by Korpijaakko (1988), hydraulic conductivity of Carex peat
was not correlated with degree of decomposition because the structure of the Carex
peat was already dense even at low degree of decomposition. Table 3.3 presents
some field measured values of saturated hydraulic conductivity. Because laboratory
methods to determine decomposition are time-consuming and not recommended for
routine application, many authors investigated the simple relationship between
hydraulic conductivity and easily measured physical properties such as bulk density
and volume of solids (Figure 3.5).
C. Seasonal Variation
Seasonal variations of saturated hydraulic conductivity are often observed in
swelling clay soils. Water flow through a clay soil is influenced by structural and
porosity changes caused by swelling–shrinkage and freezing–thawing cycles during
early spring (Messing and Jarvis, 1990). Similar processes were observed by Ole-
Figure 3.4 Variation in saturated hydraulic conductivity in the profile of a fen organic soil.
(Based on data from Lundin, K.P. 1964. Water Properties of Peat Deposits (in
Russian). Urozaj Press, Minsk, Belarus.)
0
30
60
90
120
150
Depth (cm)
Saturated hydraulic conductivity (cm d
-1
)
10 100 1000
undrained peatlands
drained peatlands
© 2003 by CRC Press LLC
Table 3.3 Values of Field-Measured Saturated Hydraulic Conductivity of Or
ganic Soils
Source Method Material and Location
Saturated Hydraulic
Conductivity (cm d
–1
)
Lundin (1964) Auger hole High bog, Belorussia, H1 250.0
High bog, Belorussia, H3 50.0
High bog, Belorussia, H5 5.0
Sedge-reed fen peat, Belorussia, H3 150.0
Woody-reed fen peat, Belorussia, H3 1500.0
Reed fen with channel roots, Belorussia, H3 6000.0
Boelter (1965) Seepage tube Slightly decomposed
Sphagnum peat, Minnesota 3456.0
Moderately decomposed herbaceous, Minnesota 0.648
Päivänen (1973) Seepage tube Sphagnum peat, Finland, H1 190.08
Sedge peat, Finland, H3 181.44
Sphagnum peat, Finland, H10 0.864
Sedge peat, Finland, H8 7.344
Lishtvan et al. (1989) Information
not available
Sphagnum fuscum, Belorussia, H2
Sphagnum magellanicum, Belorussia, H2
0.0127
0.0064
Brandyk et al. (1996) Auger hole Moderately decomposed sedge-reed f
en, Poland 104.0
© 2003 by CRC Press LLC
szczuk et al. (1995) in organic soils. Seasonal changes occurred in field-measured
hydraulic conductivity values using the auger hole method along a 150 m transect
in a fen organic soil in summer and autumn (Figure 3.6). Smallest values of saturated
hydraulic conductivity were observed in autumn when the soil was swollen, and
highest values were shown during summer when soil shrinkage took place.
Figure 3.5 Relationships between (a) bulk density and saturated hydraulic conductivity, and
(b) volume of solid matter and saturated hydraulic conductivity in organic soils.
Figure 3.6 Comparison of saturated hydraulic conductivity values in a fen peat measured in
summer and autumn along a transect. (From Oleszczuk, R., Szatylowicz, J., and
Brandyk, T. 1995. Przeglad Naukowy Wydzialu Melioracji i Inzynierii Srodowiska,
7:11–20. With permission.)
0.0 0.1 0.2 0.3 0.4
Bloemen, 1983 (fen peat)
Bloemen, 1983 (bog peat)
Boelter, 1969
Korpijaako (1988)
Paivanen (1973)
3.0 4.0 5.0 6.0 7.0 8.0 9.0 10.0
Bloemen, 1983 (fen peat)
Bloemen, 1983 (boog peat)
Lundin, 1964 (fen peat)
Lundin, 1964 (bog peat)
a) b)
Saturated hydraulic conductivity (cm d
-1
)
Volume of solid matter (%)Bulk density (g cm
-3
)
10.0
0.1
1.0
100.0
1000.0
10000.0
10.0
0.1
1.0
100.0
1000.0
10000.0
Log of hydraulic conductivity (cm d
-1
)
1.5
1.0
0 15 30 45 60 75 90 105 120 135 150
Distance (m)
Autumn
Summer
4.0
2.0
2.5
3.0
3.5
© 2003 by CRC Press LLC
V. UNSATURATED HYDRAULIC CONDUCTIVITY
Unsaturated hydraulic conductivity is the ability of a porous medium to transmit
water when the cross section of the pores is not totally filled with water. To separate
this term from the saturated condition, unsaturated hydraulic conductivity is often
called capillary conductivity. Hydraulic conductivity of unsaturated soils depends
on moisture content and matric potential. Many methods have been reported in the
literature for the determination of unsaturated hydraulic conductivity (Dirksen,
1991). No universal method is best suited to measure this parameter.
Richards and Wilson (1936) were the first to measure unsaturated hydraulic
conductivity as a function of matric potential in pristine and cultivated organic soils.
Organic soils showed unsaturated conductivities greater than those observed in
mineral soils at low pressure heads, and reached zero values at lower pressure heads
compared to mineral soils. Values were presented by Rijtema (1969), Wind (1969),
Bartels and Kuntze (1973), Renger et al. (1976), and Illner and Raasch (1977).
Unsaturated hydraulic conductivity values determined by Bartels and Kuntze (1973)
and Illner and Raasch (1977) using a double-membrane apparatus (Kramer and
Meyer, 1968) indicated negative slopes for log–log relationships between unsaturated
hydraulic conductivity and pressure head, which depended on degree of peat decom-
position (Figure 3.7). Renger et al. (1976) obtained similar results with 11 organic
soils that varied in degree of peat decomposition and volume of solids. Bloemen
(1983) obtained linear relationships between slopes of unsaturated hydraulic con-
ductivity functions and both bulk density and volume of solids (Figure 3.8). For the
same volume of solids, the slope was higher for high bog peat than for fen peat.
Equations are often used to describe unsaturated hydraulic conductivity func-
tions. Such expressions provide a method for interpolating or extrapolating hydraulic
conductivity curves using limited data, and an efficient data handling procedure for
Figure 3.7 Unsaturated hydraulic conductivity of (a) high bog and (b) fen peats with different
degrees of decomposition as a function of matric potential.
Hydraulic conductivity (cm d
-1
)
1.0E+1
1.0E+0
1.0E-1
1.0E-2
1.0E-3
1.0E-4
1.0E+2
1.0E+1
1.0E+0
1.0E-1
1.0E-2
1.0E-3
1.0E-4
1.0E+2
Pressure head (cm)
Pressure head (cm)
1 10 100 1000 1 10 100 1000
a)
b)
H8-9 (Bartels and Kuntze, 1973)
H8-9 (Bartels and Kuntze, 1973)
H2-3 (Illner and Raasch, 1977)
H7-8 (Illner and Raasch, 1977)
H2-3 (Bartels and Kuntze, 1973)
H3-4 (Bartels and Kuntze, 1973)
© 2003 by CRC Press LLC
unsaturated flow studies. One of the commonly used equations is the Mualem–Van
Genuchten model in the following form:
(3.4)
where h is pressure head, and K and K
s
are unsaturated and saturated hydraulic
conductivity values, respectively;
aa
aa
, n and ll
ll
are empirical parameters; and m =
(1–1/n). This equation combines the description of soil water retention characteristic
proposed by Van Genuchten (1980) and the pore size distribution model of Mualem
(1976). The coefficients in Equation 3.4 are estimated simultaneously from measured
soil water retention (
aa
aa
, n) and hydraulic conductivity data (K
s
, ll
ll
). According to
Mualem (1976), the pore connectivity parameter
ll
ll
averaged about 0.5 across many
soils.
Wösten et al. (1999) developed pedotransfer functions to estimate parameters of
Equation 3.4 for mineral and organic soils defined according to the FAO soil clas-
sification. For organic soils, Wösten et al. (1999) obtained
aa
aa
= 0.0130 cm
–1
, n =
1.2039,
ll
ll
= 0.40, and K
s
= 8.0 cm d
–1
. Calculated unsaturated hydraulic conductivity
values using Equation 3.4 and average values for parameters are plotted in Figure
3.9. Measured unsaturated hydraulic conductivity by an evaporation method for fen
organic soils as well as functions from Wösten et al. (1999) for mineral soils (coarse
and very fine) are also shown. Fen organic soils show high variation in unsaturated
hydraulic conductivity: some are close to the curve representing coarse-textured
mineral soils, while others are close to the curve representing fine-textured mineral
soils. Lundin et al. (1973) examined unsaturated hydraulic conductivity measured
by evaporation methods (Korcunov et al., 1961) for several reed-sedge peat samples
with similar physical properties (Table 3.4). Data plotted in Figure 3.10 indicate a
large range of values of one to two orders of magnitude for peat materials with
similar physical properties. A direct measurement of unsaturated hydraulic conduc-
Figure 3.8 Relationship between the slope factor and (a) bulk density and (b) solid matter
volume for high bog and fen peats. (Based on data from Bloemen, G.W. 1983.
Zeitschrift für Pflanzenernährung und Bodenkunde, 146(4):460–473.)
0.05 0.10 0.15 0.20 0.25
1.8
1.9
2.0
2.1
2.2
2.3
2.4
2.5
0 5 10 15 20 25
a)
b)
Bulk density (g cm
-3
) Solid matter volume (%)
Slope factor (-)
fen peat
high bog peat
Kh K h h h
s
nm n nm
( ) {[ | | ] | | | /[ | | ]
()
=+ − +
−+
11
12 2
αα α
λ
© 2003 by CRC Press LLC
tivity in the field or in the laboratory requires time as well as very precise and
expensive equipment. Thus, Bloemen (1983) developed empirical equations relating
unsaturated hydraulic conductivity to easily measured peat properties.
Unsaturated hydraulic conductivity can also be derived from parameter identi-
fication methods, assuming the reliability of relatively simple experiments. Further
assuming algebraic forms of the hydraulic property functions, the water transport
Figure 3.9 Unsaturated hydraulic conductivity of fen peats and mineral soils.
Table 3.4
Physical Properties of Reed-Sedge Peat
Sample
Degree of
Decomposition
(%)
Sampling
Depth
(cm)
Bulk
density
(g cm
–3
)
Ash
Content
(g kg
–1
)
Saturated
Moisture
Content
(m
3
m
-3
)
Saturated
Hydraulic
Conductivity
(cm d
–1
)
1 40 50 0.145 75 0.904 103.0
2 40–45 50 0.136 86 0.911 244.0
3 40–45 30 0.158 80 0.897 150.0
4 40–45 40 0.130 78 0.915 350.0
5 40–45 40 0.139 63 0.908 55.0
Source: Based on data from Lundin, K.P., Goncarik, V.M., and Papkievic, I.A. 1973. Examination
of water conductivity of unsaturated soil (in Russian), in Proc. Scientific Research Institute of
Land Reclamation and Water Management, XXI:96–119. Urozaj Press, Minsk, Belarus.
1.0 10.0 100.0 1000.
0
Pressure head
(
cm
)
1.0E-5
1.0E-4
1.0E-3
1.0E-2
1.0E-1
1.0E+0
1.0E+1
1.0E+2
Unsaturated hydraulic conductivity (cm d )
Olszta (1981)
Brandyk (UNSODA - Leij et al., 1996)
Schindler (UNSODA - Leij et al., 1996)
Gnatowski et al. (1999)
organic soil - Wosten et al. (1999)
coarse soil - Wosten et al. (1999)
very fine soil - Wosten et al. (1999)
-1
© 2003 by CRC Press LLC
process is simulated and repeated until the simulated results agree with experimental
results at the desired degree of accuracy. The inverse parameter estimation method
is applied to one-step and multi-step experiments (Van Dam et al., 1994). The one-
step and multistep experiments for determining soil moisture retention characteristics
and unsaturated hydraulic conductivity functions were investigated in organic soils
by Gnatowski et al. (1999). They compared results obtained by one-step and mul-
tistep methods with independent measurements using evaporation methods and
concluded that the indirect methods yielded satisfactory results in organic soils when
the appropriate parameter optimization procedure was used.
VI. SHRINKAGE CHARACTERISTIC
The mechanism and magnitude of volume changes in organic soils due to
swelling and shrinkage upon wetting and drying is the result of several forces acting
at microscale and leading to soil subsidence and the occurrence of shrinkage cracks
(Millette and Broughton, 1984; Szuniewicz, 1989; Gilman, 1994). Subsidence
occurs primarily in upper horizons and is most active during the first years following
Figure 3.10 Unsaturated hydraulic conductivity functions for reed-sedge peat. (Based on data
from Lundin, K.P., Goncarik, V.M., and Papkievic, I.A. 1973. Examination of water
conductivity of unsaturated soil (in Russian), in Proc. Scientific Research Institute
of Land Reclamation and Water Management, XXI:96–119. Urozaj Press, Minsk,
Belarus.)
1.0E-1
1.0E-3
1.0E-2
1.0E+0
1.0E+1
1.0E+2
1.0E+3
Hydraulic conductivity (cm d
-1
)
Volumetric moisture content (%)
95 90 85 80 75 70 65 60 55 50 45
K (
θ
)
K
s
(
θ
s
)
peat 1 peat 1
peat 5 peat 5
peat 4 peat 4
peat 3 peat 3
peat 2 peat 2
© 2003 by CRC Press LLC
drainage. Subsidence can also be caused by loss of buoyancy as a consequence of
water removal, and by peat mineralization following soil aeration (Ilnicki, 1973;
Gotkiewicz, 1987). Excessive groundwater table drawdown to several meters can
generate cracks up to 70 cm wide and 1.3 m deep (Frackowiak and Felinski, 1994).
Upon wetting, as cracks close, soil surface rises again. Swelling–shrinkage pro-
cesses resulting in moorshing and cracking increase water and air conductivity
(Okruszko, 1993).
The relationship between water content and volume change in organic soils has
been examined in the laboratory (Ilnicki, 1967; Graham and Hicks, 1980; Päivänen,
1982; Szymanowski, 1993b) and in the field (Szuniewicz, 1989; Gilman, 1994;
Oleszczuk et al., 1999). Shrinkage as volume change is often expressed as a shrink-
age percentage of initial sample volume. Volumetric shrinkage of Polish fen peat
materials investigated by Ilnicki (1967) is presented in Table 3.5. The largest shrink-
age percentage was observed in sedge and alder peat materials, and the lowest was
observed in moss peat. Shrinkage increased with degree of decomposition and
decreased with ash content. Shrinkage increased with sampling depth (Päivänen,
1982). The trend for compaction and shrinkage in peat was promoted by the humus
component and mitigated by the fiber component (Okruszko, 1960). According to
Ilnicki (1967), sapric peat with degree of decomposition over 45% is very susceptible
to shrinkage upon drying. Crack formations start at about 0.70 m
3
m
–3
moisture
content, and are well developed at 0.50 m
3
m
–3
. Woody peat is most susceptible to
cracking, followed by sedge peat. Moss peat is the least vulnerable.
Soil moisture and volume relationships have been examined using shrinkage
characteristic curves (Stirk, 1954; McGarry and Malafant, 1987), usually by relating
void ratio (volume of voids per unit volume of solids) to moisture ratio (volume of
water per volume of solids). The curve for heavy clay soils presented in Figure 3.11
shows structural, normal, residual and zero shrinkage phases (Tariq and Durnford,
1993). Structural shrinkage occurs in the wetter range where any soil volume change
yields less than water loss by the drainage of large pores, allowing air to enter.
Normal shrinkage takes place when the soil volume decrease is equal to water loss
as air volume remains constant. In the residual shrinkage phase, water loss exceeds
soil volume loss, resulting in more air-filled porosity. In the zero-shrinkage phase,
soil volume remains constant, but moisture loss occurs due to pore drainage.
Table 3.5 Relationship between Shrinkage and Botanical Composition of Fen Peat
Peat Type
No. of
Samples
Degree of
Decomposition
(%)
Bulk
Density
(g cm
–3
)
Volume of
Solid Phase
(m
3
m
–3
)
Ash Content
(g kg
–1
)
Shrinkage
(m
3
m
–3
)
Reed 25 45 0.204 0.109 306 0.65
Sedge-reed 22 40 0.196 0.109 227 0.68
Sedge 29 40 0.156 0.090 176 0.70
Mossy 15 29 0.121 0.071 144 0.59
Sedge-mossy 24 28 0.132 0.077 135 0.60
Alder swamp 27 53 0.212 0.117 260 0.70
Source: Based on data from Ilnicki, P. 1967. Zeszyty Problemowe Postepow Nauk Rolniczych,
76:197–311.
© 2003 by CRC Press LLC
Shrinkage data obtained by Szatylowicz et al. (1996) using the saran resin
method (Brasher et al., 1966) for hemic peat are shown in Figure 3.12a. The curve
fit to three straight lines shows a sudden change in void ratio. Shrinkage is small
near saturation, starts with the first water extraction, and increases as soil gets dryer.
For segment c, the slope is greater than 1 (Figure 3.12a), and volume change is
greater than water loss. The apparent wet specific gravity as related to moisture ratio
(Figure 3.12b) has one minimum, compared with one maximum for clay soils (Philip,
1969). Similar shapes for shrinkage characteristic curves of organic soils were
reported by Van den Akker and Hendriks (1997).
Conversion of soil volume changes into fissuring and subsidence is very important
in organic soils because of the large impact of cracks on water and oxygen transport.
For converting volume changes into crack volume and subsidence, a dimensionless
shrinkage geometry factor (r
s
) has been defined as follows (Kim et al., 1992):
(3.5)
where r
s
is the shrinkage geometry factor from the initial stage 0 to the k-th stage
of dryness; V
k
and V
0
are soil volumes at stages k and 0, respectively; H
k
and H
0
are heights of the soil sample at stages k and 0, respectively. The r
s
is equal to 3
for soils with isotropic three-dimensional shrinkage, exceeds 3 when fissuring pre-
dominates, is between 1 and 3 for a predominance of subsidence, and is equal to 1
for subsidence only (Bronswijk, 1990).
Examples of shrinkage geometry factors together with corresponding shrinkage
characteristic and moisture retention curves are presented in Figure 3.13. Three
phases are distinguished from patterns relating the shrinkage geometry factor to
Figure 3.11 Shrinkage curve of a heavy clay soil. (From Tariq, A. and Durnford, D.S. 1993.
Soil Sci. Soc. Am. J., 57:1183–1187. With permission.)
0.0 0.4 0.8 1.2 1.6 2.0
0.0
0.4
0.8
1.2
1.6
2.0
Moisture ratio (m
3
m
-3
)
Void ratio (m
3
m
-3
)
Zero Residual Normal Structural
Shrinkage
Saturation line 1:1
Air
rk VV HH
s
k
o
k
o
( , ) log( / ) / log( / )0 =
© 2003 by CRC Press LLC
moisture ratio. The first phase occurs when soil starts drying from saturation, and
the shrinkage geometry factor is equal to 1. The second phase is transitory, and r
s
increases as moisture content decreases. In the third phase, r
s
is equal to about 3.
Cracks may appear when r
s
is greater than 1. Bronswijk (1988) applied shrinkage
characteristics of heavy clays and the geometry factor to develop equations quanti-
fying the contribution of shrinkage to soil subsidence and estimating crack volume.
The model was validated by Oleszczuk et al. (1999) for predicting the thickness and
volume change of a peaty moorsh soil under field conditions.
VII. WATER REPELLENCY
A. Methods of Determination
Water repellency has been reported to occur under a wide variety of soil and
climatic conditions (Wallis and Horne, 1992). Soil wettability depends on several
Figure 3.12 Shrinkage curve (a) and the relationship between apparent wet specific gravity
and moisture ratio (b) for a mesic tall sedge peat. (From Szatylowicz, J., Oleszczuk,
R., and Brandyk, T. 1996. Shrinkage characteristics of some fen peat soils, in
Proc. 10th Int. Peat Congr., Bremen, Germany, 2:327–338, With permission.)
0.0 2.0 4.0 6.0 8.
0
0.0
2.0
4.0
6.0
8.0
pF=4.2
pF=3.0
pF=2.0
pF=1.0
c
b
a
0.0 2.0 4.0 6.0 8.
0
0.5
0.6
0.7
0.8
0.9
1.0
1.1
⇒
=
⇒
=
⇒
=
a
b
c
e
e
e
Moisture ratio;ϑ(m
3
m
-3
)
Apparent wet
specific gravity (g cm
-3
)
Void ratio; e (m
3
m
-3
)
a)
b)
0.387ϑ+4.265
0.664ϑ+3.229
1.639ϑ+1.326
© 2003 by CRC Press LLC
Figure 3.13 Shrinkage curve (a) shrinkage geometry factor (b) and soil moisture retention
curve (c) of a sedge peat.
0
1
2
3
4
5
6
7
8
9
1
2
3
4
012345678
9
0
1
2
3
4
5
Moisture ratio (m
3
m
-3
)
Pressure head (pF)
Geometry factor (-)
Void ratio (m
3
m
-3
)
c)
b)
a)
© 2003 by CRC Press LLC
factors mainly related to the quality of organic matter (Ma’shum and Farmer, 1985).
In water-repellent soils, water infiltration is reduced, thus accelerating runoff and
erosion and impacting plant establishment and growth (DeBano, 1969). Considerable
variation in soil water content and irregular moisture patterns were observed in water-
repellent mineral soils (Dekker and Ritsema, 1995; Ritsema and Dekker, 1994).
The severity of water repellency is often determined by using two tests: the water
drop penetration time (Watson and Letey, 1970) and the alcohol percentage (Dekker
and Ritsema, 1994). The water drop penetration time test (WDPT) consists of placing
a water drop onto the soil surface, then recording the time for the water drop to
penetrate into the sample. The alcohol volume percentage test records the infiltration
time of ethanol drops of varying concentrations placed onto the soil surface using
a standard medicine dropper. The degree of repellency is the lowest alcohol percent-
age in the solution penetrating the soil surface within 5 s (Dekker and Ritsema,
1994). These tests can be performed on dried or field-moist samples. Water repel-
lency measured on field-moist samples has been referred to as “actual water repel-
lency,” while that measured on dried samples has been called “potential water
repellency” (Dekker and Ritsema, 1994).
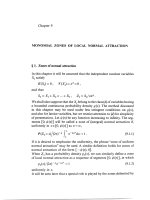
Water repellency depends on soil moisture content (Berglund and Persson, 1996;
De Jonge et al., 1999). The influence of soil moisture content on WDPT of a peat-
moorsh soil is presented in Figure 3.14 (Waniek et al., 1999). Dekker and Jungerius
(1990) proposed five classes of water repellency: wettable or non-water repellent
(WDPT<5 s), slightly (5–60 s), strongly (60–600 s), severely (600–3600 s),
extremely water repellent (>3600 s). The WDPT test was sensitive to changes in
water content. Moisture content corresponding to pF 2.0, pF 2.7, and pF 4.2 are
shown in Figure 3.14. Almost no repellency occurred at soil saturation. Repellency
increased rapidly with decreasing water content. Maximum WDPT occurred with
dried peat materials in the turf and moorsh layers. The turf layer, or mat, is the top
of the moorsh layer densely colonized by plant roots. The WDPT function of soil
water content peaked in the alder (40–50 cm) and reed (50–80 cm) peat layers.
Highest WDPT occurred near the permanent wilting point (pF 4.2). Under field
conditions, where moisture content seldom decreased below the permanent wilting
point, the turf layer was classified as nonrepellent, the moorsh layer as slightly
repellent, and the alder and reed peat layers as strongly repellent. The persisting
potential water repellency of dried samples is presented in Figure 3.15. Generally,
peat-moorsh soils present relatively high potential water repellency with up to 0.325
m
3
m
–3
of ethanol, a level higher than in most mineral soils (Watson and Letey,
1970; McGhie and Posner, 1980).
The liquid–solid contact angle indicates the wettability of a soil (Watson and
Letey, 1970). If a drop of water is placed on a hydrophobic or non-wettable surface,
it balls up, conferring a large liquid-solid contact angle. In contrast, a water drop
placed on a wettable surface spreads over and has a small contact angle. The contact
angle for wettable soils is often assumed to be 0°, but for water repellent soils the
angle may be larger than 90°. The contact angle is assessed by direct and indirect
methods (Wallis and Horne, 1992). Direct methods, the most common, are conducted
by placing of a drop of water on the material. The contact angle between a liquid
and a solid surface is measured either from droplet profile using an optical goniom-
© 2003 by CRC Press LLC
eter, or from droplet geometry (i.e., volume, height, and length). Indirect methods
are based on the rate of water movement or the height of capillary rise, which are
influenced by liquid–solid contact angles. Equations have been developed for cap-
illary rise (Letey et al., 1962) or rate of water flow through soils (Emerson and Bond,
1963; Hammond and Yuan, 1969), where contact angle is a variable. A contact angle
measured by indirect methods is therefore an apparent contact angle.
B. Water Repellency of Organic Soils
Contact angles of organic soil materials were measured by Valat et al. (1991),
Lambert and Vanderdeelen (1996), and Holden (1998) using direct methods, and by
Waniek et al. (2000) using indirect methods. According to Valat et al. (1991), the
solid–liquid contact angle for air-dried peat materials reached 122.1∞ for woody
peat, 116.8∞ for herbaceous peat and 110.9∞ for Sphagnum peat. Waniek et al. (2000)
reported contact angles ranging from 64.2 to 83.1∞ in peaty moorsh soils developed
from fen, using the equilibrium height of capillary rise method; values ranged from
Figure 3.14 Dependence of water repellency on water content at different soil depths across
a peat-moorsh soil profile. (From Waniek, E., Szatylowicz, J., and Brandyk, T.
1999. Roczniki Akademii Rolniczej w Poznaniu CCCX, Melioracje i Inzynieria
Srodowiska, 20(1):199–209. With permission.)
© 2003 by CRC Press LLC
86.3 to 89.8∞ using the dynamic capillary rise approach. Contact angles presented
in the literature for organic soils confirm their hydrophobicities or water repellencies.
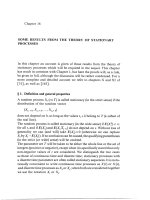
The influence of water repellency on the variation in soil water content in a field
peaty moorsh soil profile was studied by Waniek et al. (1999). Volumetric water
content was determined by sampling the soil profile at different depths using steel
cylinders (100 cm
3
and 5 cm in height). Thirty-one samples were taken from each
of the following depths: 5–10, 15–20, 25–30, and 45–50 cm, at close intervals along
transects 300 cm in length. Wet soil samples were weighed before oven-drying for
24 h at 105∞C, and weighed again to determine water content and bulk density. The
soils were sampled on 11 September, 1998 and 19 October, 1998. The spatial
distribution of volumetric moisture content is shown in Figure 3.16. The soil moisture
profile on September 11 showed a vertically oriented moisture pattern at depths
between 10 and 30 cm, and isolated dry spots at 10–30 cm intervals with soil water
content less than 40%. In October, the soil was wetter, but the vertical moisture
pattern was still present. Presumably, a strongly repellent soil layer at depth of 40–50
cm, as shown in Figure 3.14, restricted capillary rise from groundwater to upper
layers. The irregular pattern of spatial distribution of moisture content was typical
for soils where preferential water flow occurred (Ritsema et al., 1993).
VIII. SPATIAL VARIABILITY
Gnatowski et al. (1996) examined the spatial variability of bulk density, saturated
hydraulic conductivity and moisture content in a peaty moorsh soil covering 5 ha.
Figure 3.15 Relative frequency of the degree of potential water repellency for dry peat samples
at several soil depths. (From Waniek, E., Szatylowicz, J., and Brandyk, T. 1999.
Roczniki Akademii Rolniczej w Poznaniu CCCX, Melioracje i Inzynieria Srodow-
iska, 20(1):199–209. With permission.)
0 10 20 30 40 50 60 70 80 90 100
15-20
45-50
32.5%
30.0%
27.5%
25.0%
22.5%
20.0%
17.5%
25-30
5-10
Frequency (%)
Depth (cm)
Alcohol percentage:
© 2003 by CRC Press LLC
Sampling was performed along a 10 m ¥ 10 m grid, totaling 517 nodal points. The
results were analyzed using conventional statistics such as mean, maximum, average,
median, variance and coefficient of variation (Table 3.6). Coefficients of variation
(CV) were lowest for saturated and in situ moisture contents, intermediate for bulk
density and largest for hydraulic conductivity. The ranges of coefficient of variation
were similar to those reported for mineral soils (Warrick and Nielsen, 1980). Several
soil properties were spatially autocorrelated, thus requiring geostatistical analysis
(Webster and Oliver, 1990). The variance of spatially dependent soil parameters was
estimated from the semivariogram as follows:
(3.6)
Figure 3.16 Contour plots showing the spatial distribution of volumetric soil water content on
September 11 and October 19, 1998 in a Polish peat-moorsh soil. (From Waniek,
E., Szatylowicz, J., and Brandyk, T. 1999. Roczniki Akademii Rolniczej w Poznaniu
CCCX, Melioracje i Inzynieria Srodowiska, 20(1):199–209. With permission.)
300
γ()
()
[( ) ( )]
()
h
Nh
zx h zx
ii
i
Nh
=+−
⎧
⎨
⎪
⎩
⎪
⎫
⎬
⎪
⎭
⎪
=
∑
1
2
2
1
© 2003 by CRC Press LLC
where gg
gg
is the semivariance, N(h) the number of data pairs separated by lag distance
h, and z(x
1
), z(x
2
), …, z(x
n
) are data for spatial locations x
1
, x
2
,…,x
n
.
The semivariance computed in Equation 3.6 increases with increasing lag, then
levels off. The lag at which a plateau is achieved is the range. The semivariance on
the plateau is the sill. Points within the range are considered spatially correlated;
points outside the range are declared spatially independent. Empirical semivario-
grams seldom cross the origin. The semivariance at zero lag is the nugget, composed
of two sources of variance: the spatial variance of specimens, at scales less than
minimum sampling distance, and local sampling error. The spherical model fits
several semivariograms of soil properties and is defined as follows (Webster and
Oliver, 1990):
(3.7)
where C
0
is the nugget effect, C
s
is the structural component, a is the range of spatial
dependence, and (C
0
+ C
s
) is total variance (the sill). The linear model without sill
is defined as follows:
(3.8)
where w is the slope and all other symbols are as defined previously.
Gnatowski et al. (1996) applied spatial statistics to assess correlations among
peat properties (bulk density, moisture content, and saturated hydraulic conductivity)
across a field of 5 ha (Figure 3.17) in a peaty moorsh soil. For saturated and in situ
Table 3.6 Statistical Analysis of Some Physical Peaty Moorsh Properties
Property
Value
Variance
CV
a
(%)Minimum Maximum Average Median
Bulk density (g cm
–3
) 0.206 0.559 0.274 0.263 0.0021 16.1
Saturated volumetric
moisture content
(m
3
m
–3
)
0.738 0.938 0.841 0.841 8.27 3.4
In situ volumetric
moisture content
(m
3
m
–3
)
0.538 0.852 0.748 0.753 19.59 5.9
Saturated hydraulic
conductivity (m d
–1
)
0.01 2.59 0.26 0.13 0.142 142.4
a
Coefficient of variation.
Source: From Gnatowski, T., Brandyk, T., and Szatylowicz, J. 1996. Przeglad Naukowy Wydzialu
Melioracji i Inzynierii Srodowiska, 11:129–136. With permission.)
γ
γ
γ
()
()
()
hCC
h
a
h
a
ha
hCC ha
s
s
=+ −
⎛
⎝
⎞
⎠
⎡
⎣
⎢
⎤
⎦
⎥
<≤
=+ >
=
0
3
0
3
2
1
2
0
00
γ
γ
()
()
h C wh h=+ <
=
0
0
00
© 2003 by CRC Press LLC