RESTORATION AND MANAGEMENT OF LAKES AND RESERVOIRS - CHAPTER 2 ppt
Bạn đang xem bản rút gọn của tài liệu. Xem và tải ngay bản đầy đủ của tài liệu tại đây (484.29 KB, 23 trang )
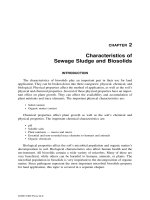
2
Basic Limnology
2.1 INTRODUCTION
Lake managers, students, consultants, and others interested in lake and reservoir restoration should
have a thorough understanding of limnology. The next two chapters outline some basic principles
of limnology that are significant to restoration and management decisions. A brief comparison of
lakes and reservoirs is presented in this chapter, along with a description of regional lake conditions
and the forces, both external and internal, that promote lake and reservoir problems. Procedures to
obtain the data necessary to diagnose lake condition, select a restoration alternative, and prepare a
project report are described in the next chapter.
Readers familiar with the fundamentals of limnology could go directly to sections on restoration
methods. While these next two chapters cannot substitute for the in-depth understanding of lim-
nology required to make competent and effective decisions, they do provide a review or guide to
some basic principles. The reader is referred to Hutchinson (1957, 1967, 1975), Cole (1994), Horne
and Goldman (1994), Lampert and Sommer (1997) and Scheffer (1998) for thorough discussions
of limnology. Welch and Jacoby (2004), Wetzel (2001), and Kalff (2002) are especially useful for
their holistic viewpoints, and for their coverage of macrophyte biology and stream and reservoir
ecology.
2.2 LAKES AND RESERVOIRS
The physics, chemistry, and biology of dimictic (deeper lakes that thermally stratify in summer
and winter) natural lakes have dominated limnological literature and the training of many limnol-
ogists. This bias reflects the fact that there are many of these lakes in North America and Europe.
It is also a result of the emergence of “limnology schools” located primarily in North American
and European areas dominated by deep lakes. But, shallow lakes are far more common than deep
lakes (Wetzel, 1992), and limnology programs emphasizing them are now emerging, particularly
in Europe.
Reservoirs are as important as natural lakes for recreation, but have additional values for flood
control, hydropower generation, and water supply. While both lakes and reservoirs are subject to
silt, organic, and nutrient loadings, reservoirs are more likely to have water quality problems due
to their usually large watersheds and their morphometric configurations. Reservoirs are a vital part
of the economy of many nations. The U.S. Army Corps of Engineers (USCOE) manages approx-
imately 783 reservoirs with a combined surface area of 27,000 km
2
(Kennedy and Gaugush, 1988).
Despite their abundance and importance, most limnology texts only mention them, or incorrectly
imply that they are functionally equivalent to natural lakes and that no distinction is necessary.
While natural lakes and reservoirs have biotic and abiotic processes in common, they have
important differences. Both have similar habitats (pelagic, benthic, profundal, and littoral zones),
organisms, and processes, but it is their differences, summarized by Thornton et al. (1980), Walker
(1981), Kennedy et al. (1982, 1985), Søballe and Kimmel (1987), Thornton et al. (1990), and
Kennedy (1999, 2001) (Table 2.1), that also must be understood to successfully manage them.
These fundamental reports are important supplements to most texts in limnology. A brief compar-
ison of lakes and reservoirs is presented here.
Copyright © 2005 by Taylor & Francis
Reservoirs differ from lakes in their geologic history and setting, basin morphology, and
hydrologic factors (Kennedy et al., 1985; Kennedy, 2001). When natural lakes and USCOE reser-
voirs are compared, it is apparent that reservoirs are located primarily where flooding may occur
or where water shortages require water storage. Reservoirs thus dominate the middle latitudes of
the U.S. (Walker, 1981). Reservoirs are also used for hydropower generation. Very small reservoirs
for recreation and farming operations are found at all latitudes.
Lakes of North America are also located in distinct regions. They are: (1) the continental glacial
lakes in the mesic northeast, Canada and upper midwest, (2) the mostly alpine glacial lakes in
Alaska and the mountainous west, (3) the coastal plain and karst (solution) lakes of the southeast,
especially Florida, and (4) scattered small regions of playas, potholes and sandhill lakes in arid
and semi arid areas (J.M. Omernik, USEPA, personal communication). Further discussions of these
lake distributions are found in Hutchinson (1957) and Frey (1966).
Latitudinal differences in climate and geology have a major influence on the quality and rates
of materials loaded to lakes and reservoirs, and on their degree of thermal stratification and mixing.
The average reservoir watershed area is nearly an order of magnitude greater than the average
lake’s watershed, a factor accounting for the much higher average areal water (and contaminant)
loadings to reservoirs (Table 2.1). Some lakes also have large watersheds and thus, like reservoirs,
have high water loads. Reservoirs can become distinctly “lake-like“ during summer low flow
periods. Therefore, it should be noted that the values in Table 2.1 are averages, and that the ranges
of lake and reservoir characteristics overlap.
Natural lakes are more likely to be located centrally in a fairly symmetrical drainage area,
whereas reservoirs are elongated and dendritic, and usually at the downstream boundary of the
watershed. The deep zone of a reservoir is normally at the dam; in lakes there may be several
“deep holes.”
Average nutrient and sediment loads are much higher for reservoirs and this material may have
undergone a far longer period of in-stream processing than material loaded to natural lakes. Water
often enters lakes via smaller streams that are likely to traverse wetland or littoral areas, whereas
reservoirs may have characteristics of a river for long distances into the reservoir.
While natural lake outflows are at the surface, or occasionally through the ground, reservoirs
usually have multiple depth, constructed outlets, leading to in-reservoir mixing processes and to
discharge of water that might be anoxic, enriched with soluble nutrients, or high in hydrogen sulfide,
TABLE 2.1
Comparison of Geometric Means (Probability That Means for
Each Comparison Are < 0.0001) of Selected Variables of Natural
Lakes and Army Corps of Engineers Reservoirs
Variable Natural Lakes (N = 309) Reservoirs (N = 107)
Drainage area (km
2
) 222.00 3228.00
Surface area (km
2
) 5.60 34.50
Maximum depth (m) 10.70 19.80
Mean depth (m) 4.50 6.90
Hydraulic residence time (yr) 0.74 0.37
Areal water load (m/yr) 6.50 19.00
Drainage/surface area 33.00 93.00
P loading (gm/m
2
/yr) 0.87 1.70
N loading (gm/m
2
/yr) 18.00 28.00
Source: Modified from Thornton, K.W. et al., 1980. Symposium on Surface Water
Impoundments. Proceedings Am. Soc. Civil Eng. pp. 654–661. With permission.
Copyright © 2005 by Taylor & Francis
methane, and reduced metals. Lake levels vary with precipitation, evaporation, and surface outflows,
but it is uncommon for the amplitude to be large or to change quickly. An exception is the wind-
induced displacement of some of the water mass, creating a to and fro “sloshing” of water in the
lake basin, sometimes with amplitudes of one meter or more (surface and internal seiches). A well-
known example is the occasional seiche in Lake Erie (U.S Canada). Reservoirs, however, can have
rapid and significant changes in levels due to management decisions and these changes in level
may eliminate or greatly reduce the littoral community of rooted aquatic plants.
Unlike lakes, reservoirs are operated to store and release water, and these operations profoundly
influence their limnological characteristics (Kennedy, 2001; Cooke and Kennedy, 2001). For exam-
ple, when deep waters are released, heat is stored. When surface waters are released heat is
dissipated. These actions greatly alter thermal structure, including depth of the metalimnion (layer
of water with a sharp thermal gradient) and retention or loss of materials.
Lakes and reservoirs represent a continuum of ecological conditions (Canfield and Bachmann,
1981). Kimmel and Groeger (1984) and Søballe and Kimmel (1987) viewed this continuum as one
ordered by water residence time (volume divided by outflow rate), and indicated that reservoirs
and natural lakes with similar residence times have similar ecological attributes. In rapidly flushed
systems, for example, algal abundance is less likely to depend on nutrient concentrations than on
flushing rate (Chapter 6). Therefore, despite features that might separate lakes and reservoirs as
classes of aquatic habitats, convergence can occur when water residence times are similar.
Geographic location of a reservoir determines the quantity and timing of inflow. For example,
inflows in some areas of California are in spring to mid-summer, whereas peak inflows in the
Pacific Northwest and southeastern U.S. are in winter to early spring. Similarities and differences
between lakes and reservoirs based on water residence times are thus modified by location (Kennedy,
1999).
Figure 2.1 illustrates the expected gradient in reservoir characteristics of a main-stem reservoir
(dam on the stream) from the river entrance to the dam. Unlike many natural lakes where water
enters from several smaller tributaries draining comparatively small sub-watersheds, reservoirs have
a distinct riverine zone dominated by flow and mixing, followed by a transition zone where inflow
velocity slows, rapid sedimentation begins, and water clarity increases. When inflowing river water
is colder than surface water of the reservoir, a “plunge point” is found where the colder, heavier
water loses velocity and descends to a depth equal to its density, creating a distinct inter- or
underflow (Figure 2.2). Unlike lakes, where it is often assumed that nutrient loads are completely
mixed with lake waters, loading to a reservoir might not mix with upper waters at all, but instead
might be carried through the reservoir via an inter- or underflow, greatly altering standard loading
model assumptions (Chapter 3) (Kimmel and Groeger, 1984; Gaugush, 1986; Walker, 1987). The
lacustrine zone near the dam is the most lake-like, with thermal stratification and a higher probability
that algae growth is nutrient limited. Some natural lakes in narrow valleys, with large inflow rivers
and low water residence times, have many reservoir characteristics. This gradient of conditions
along the length of a reservoir means that reservoir characterization requires multiple sampling
stations. The same is true for large natural lakes, and lakes with distinct pelagic and littoral zones.
Reservoir basin design also influences hydrodynamic features. For example, a tributary reservoir
and a main stem reservoir receiving identical water loads and having identical basin volumes are
likely to have different responses. Main stem reservoirs have low capacity to store excess volume
and thus have water residence times that fluctuate with water loading events, whereas tributary
reservoirs have much higher storage capacity and are used for flood control. In these reservoirs,
the hypolimnion may be large whereas the main stem reservoir may be longer and shallower and
greatly influenced by interactions between sediments and overlying water (Kennedy, 1999).
Reservoirs are important sources of fresh water for potable, irrigation, and industrial purposes.
Their protection and management requires that more traditional views of sampling, correlations
between loading and responses of biota, and choice of restoration techniques be modified to take
these, and the basic differences between natural lakes and reservoirs, into account.
Copyright © 2005 by Taylor & Francis
2.3 BASIC LIMNOLOGY
2.3.1 P
HYSICAL–CHEMICAL LIMNOLOGY
Some lakes and reservoirs stratify thermally during summer months into an upper warm, well-
mixed zone termed the epilimnion. Below this is a zone of rapidly decreasing temperature with
depth, the metalimnion, followed by a deep, colder, often dark bottom layer, the hypolimnion. This
phenomenon, brought about by wind mixing, solar input, and by large differences in water density
between cold and warm waters, is a primary determinant of summer physical, chemical, and
biological interactions. During ice cover lake water temperature inversely stratifies, with colder
water at the surface. This happens because water’s maximum density is at 4°C, and water colder
than this temperature, including ice, is lighter and floats above this slightly warmer layer. Lakes
with two mixing periods (spring and fall) and two stratified periods (summer, winter) are dimictic
and are typical of deep lakes and reservoirs of north temperate latitudes (Wetzel, 2001). Details of
mechanisms leading to this and other types of thermal stratification are found in all basic limnology
texts. Figure 2.3 illustrates the characteristics of the three thermal layers in a dimictic lake, or in
the lacustrine zone (Figure 2.1) of a reservoir during summer months. The figure also illustrates
typical summer temperature and dissolved oxygen (DO) profiles with depth in a stratified eutrophic
lake or reservoir.
Polymictic lakes are more common than dimictic lakes. Because polymictic lakes are shallow,
they may mix continuously, or stratify briefly (hours, days) in calm, hot weather, followed by
renewed complete mixing. Polymictic lakes are found at all latitudes.
FIGURE 2.1 Longitudinal zonation in environmental factors that control primary productivity, phytoplankton
biomass, and trophic state within reservoir basins. Changes in shading indicate decline in turbidity. (From
Kimmel, B.C. and A.W. Groeger, 1984. Lake and Reservoir Management. USEPA 440/5-84-001. pp. 277–281.
Riverine zone Transitional zone
• Broader, deeper basin
Lacustrine zone
• Broad, deep, lake-like• Narrow basin
• High flow
• High susp. solids,
low light
• High nutrients,
advective supply
• Light limited
photosynthesis
• Algal cell loss
by sedimentation
• Organic matter supply
allochthonous
• More “eutrophic”
• Reduced flow
• Lower susp. solids,
more light
• Advective nutrient
supply reduced
• High photosynthesis
• Algal cell loss by
sedimentation, grazing
• Intermediate
• Little flow
• Clearer
• Internal nutrient recycling,
low nutrients
• Nutrient limited
Photosynthesis
• Algal cell loss by grazing
• Organic matter supply
autochthonous
• More “oligotrophic”
Copyright © 2005 by Taylor & Francis
There can be significant modifications of temperature regimes, particularly in reservoirs. River
inflows to reservoirs may have very different temperatures than reservoir waters, producing under-
inter-, or overflows of incoming water (Figure 2.2). The upper reaches of the reservoir, like the
wave washed littoral zone of a lake, may exhibit little thermal stratification except during hot, calm,
low-flow periods. In the transition zone (Figure 2.1), where mixing and sedimentation processes
are dominant, the volume of a reservoir’s hypolimnion may be small. Only in the deep lacustrine
zone is the temperature stratification similar to natural lakes, though the hypolimnion is likely to
be less stable due to underflows and withdrawals of deep water at the dam.
The shape of a reservoir or lake’s basin affects its productivity, kinds of organisms, water
chemistry, and the choices available to manage and restore it. Most natural lakes are small in area
and shallow (mean depth ≤ 3 m). Rooted plants, and algae associated with leaf and sediment
surfaces, can have very high primary productivity, biomass, and areal distribution, unless the lake
is turbid from silt loading, wind mixing, or algal blooms that cause rooted plants to be light-limited.
Also, as noted in later sections and other chapters, the large area of shallow, warm sediments and
the small hypolimnetic volumes associated with (mainly) polymictic shallow lakes and reservoirs
provide ideal circumstances for processes that allow sediment nutrient release (actually recycling
or “internal loading”) and transport to the water column. This can greatly stimulate algal produc-
tivity. Internal loading processes may be biological (e.g., microbial activities and temporary anoxia,
and sediment disturbance by methane release or by burrowing animals), chemical (e.g., high pH
from photosynthesis), and physical (e.g., turbulence from the wind) in nature (Chapter 3). Because
of these processes, lake productivity is often negatively correlated with mean depth (Wetzel, 2001)
and with the ratio of mean to maximum depth (Carpenter, 1983). Therefore, many shallow water
bodies will have more algae or rooted plants than the less common steep-sided, deep lakes and
reservoirs.
High macrophyte growth is to be expected in shallow lakes. A hypsograph (a representation
describing the relationship between lake area and depth) is useful in explaining this. Figure 2.4
compares the area–depth relationship for two hypothetical lakes with different areas of shallow
FIGURE 2.2 Density flows in reservoirs. The upper panel illustrates an “overflow“ of warm incoming waters,
the middle panel illustrates an “interflow,“ and the bottom panel shows an “underflow.“ (From Moore, L. and
K. Thornton (Eds.). 1988. Lake and Reservoir Restoration Guidance Manual. USEPA 440/5-88-002.
Dam
Outflow
Dam
Outflow
Dam
Outflow
Inflow
Inflow
Inflow
Overflow
Interflow
Plunge point
Plunge point
Underflow
Copyright © 2005 by Taylor & Francis
water. Both lakes could have nuisance algal blooms if nutrient concentrations were high. Only the
shallow one has the potential to have a large area with rooted plants because of the extensive
shallow, well-lighted sediment area. Physical factors, particularly waves, transparency, and the slope
of the littoral zone (amount of stable sediment area exposed to light) are among the determinants
of maximum macrophyte biomass and maximum depth of plant colonization (Canfield et al., 1985;
Duarte and Kalff, 1986, 1988) (Chapter 11). The development of a hypsograph is an important first
step in lake and reservoir problem diagnosis.
2.4 BIOLOGICAL LIMNOLOGY
Lakes and reservoirs have three distinct and interacting biotic communities (Figure 2.5): (1) the
wetland-littoral zone, and its sediments, (2) the open water pelagic zone, and (3) the benthic or
deep water (profundal) zone and sediments. Problems or characteristics appearing in one zone (e.g.,
deep water oxygen depletions, littoral zone aquatic plants, pelagic zone algal blooms) directly or
indirectly affect other zones, meaning that successful lake restoration requires a holistic view of
lake and watershed processes. For example, nutrients causing algal blooms may come from lake
sediments and decomposition of littoral plants, as well as from external loading. All sources might
require attention to solve the problem.
FIGURE 2.3 Cross section of a thermally stratified reservoir indicating location and characteristics of the
epilimnion, metalimnion, and hypolimnion, and typical summer temperature-dissolved oxygen distributions
in the lacustrine zone of a eutrophic reservoir. (From Gunnison, D. and J.M. Brannon. 1981. Characterization
of Anaerobic Chemical Processes in Reservoirs: Problem Description and Conceptual Model Formulation.
Tech. Rept. E-81-6. U.S. Army Corps Engineers, Vicksburg, MS.
*
*
Atmospheric aeration
Epilimnion
Metalimnion
Hypolimnion
Sediment – region of material
adsorption and release
• Warm isothermic
• Abundant oxygen
• Warmwater fishery
• Warm to cold thermal discontinuity
• Variable oxygen
• Mixed fishery
• Cold isothermic
• Oxygen low or absent-increased concentration
s
of soluble forms of contaminants and nutrients
• Coldwater fishery if oxygen adequate
*
Typical vertical temperature and do
distributions during stratification:
Bottom
Hypolimnion
Metalimnion
Epilimnion
Temperature
DO
Copyright © 2005 by Taylor & Francis
Rooted emergent, floating, and submersed vascular plants, collectively called macrophytes, and
their attached flora and fauna, dominate the wetland-littoral. These plants are distinctly different
from the microscopic, floating (planktonic) cells, colonies, and filaments of algae, often seen as
surface “scums” in some eutrophic systems. Macrophytes are usually vascular plants and are found
in shallow water. They may have large masses of filamentous (string or hair-like) algae attached
to them as thick mats. Shallow, lighted sediments often have a highly productive epilithic, epipelic,
and epiphytic flora (algae growing on surfaces of rocks, sediments and vascular plants). Macrophyte
biology is described in Chapter 11.
The littoral zone often has high species diversity, and is commonly the site where fish repro-
duction and development occurs. It is also an important waterfowl habitat. Littoral zone plant
FIGURE 2.4 Depth-area hypsographs. Solid line illustrates the less common deep lake with a small littoral
zone; dotted line illustrates the more common shallow lake with extensive littoral area and volume. (From
Cooke, G.D., E.B. Welch, S.A. Petersen, and P.R. Newroth. 1993. Restoration and Management of Lakes and
Reservoirs, 2nd Edition. Lewis Publishers and CRC Press, Boca Raton, FL.
FIGURE 2.5 Biotic communities in lakes and reservoirs.(From Cooke, G.D., E.B. Welch, S.A. Petersen, and
P.R. Newroth. 1993. Restoration and Management of Lakes and Reservoirs, 2nd Edition. Lewis Publishers
and CRC Press, Boca Raton, FL.)
150 M
2
x
5
10
15
20
25
050
Area
100
Surf.
Depth in meters
Wetland-littoral
Profundal zone
Pelagic
Copyright © 2005 by Taylor & Francis
biomass replaces itself two or more times per summer in productive lakes, leading to inputs of
non-living dissolved and particulate organic matter, termed “detritus,” to the water column and
sediments. Detritus, whether from watershed drainage or from in-lake productivity, is a stable
energy and nutrient source to the lake’s food webs, especially to microbial flora and plankton
(Wetzel, 1992, 1995). Many lakes, especially those surrounded by dense forest, are actually het-
erotrophic (photosynthetic rate is less than total respiration rate), and depend upon organic carbon
from terrestrial sources to subsidize their food webs (Cole, 1999). Therefore lakes are strongly
linked to the land, not only through nutrient and silt loading, but through detritus imports.
Macrophytes, in addition to being a significant energy source and habitat, stabilize littoral zone
sediments from the impacts of wind and boat-generated waves, thus reducing internal P loading
and sediment resuspension (Bachmann et al., 2000; Anthony and Downing, 2003; Horppila and
Nurminen, 2003).
Macro- and microplankton, and the fish and invertebrates grazing on them, dominate the pelagic
zone. The plankton includes algae that produce unsightly “blooms” and low water clarity, and
bacteria, fungi, Protozoa, and filter-feeding crustaceans like Bosmina and Daphnia. The pelagic
community obtains energy from sunlight and from detritus transported to it from stream inflows
and the littoral zone. The plankton of most enriched lakes and reservoirs is dominated by one or
a few species of highly adapted algae and bacteria, particularly nuisance blue-green algae (cyano-
bacteria). Bosmina, Daphnia, and other planktonic microcrustacea are significant grazers of detritus,
bacteria, and some algae species, though their abundance may be regulated by complex interactions
with predators such as fish and insects (Chapter 9).
The profundal benthic community receives nutrients and energy from organic matter loaded to
or produced in the lake or reservoir and deposited on the sediments. Inorganic forms of nutrients
may be added to the sediments in the form of precipitates. This pelagic-benthic coupling is a
fundamental feature of lakes (Vadeboncoeur et al., 2002). In productive lakes and reservoirs, large
areas of the sediment community in deep water are continuously anoxic during thermal stratification
due to intense microbial respiration that is stimulated by deposits of detritus. Anoxic conditions
provide conditions favoring high rates of nutrient release to the water column (Figure 2.3).
2.5 LIMITING FACTORS
Nuisance densities of algae or macrophytes, and associated water quality problems, are conditions
managed by manipulating or altering their biomass or by manipulating one or more of the factors
controlling their abundance. Macrophyte density, while in part related to sediment type and com-
position, and to nutrient factors, is often determined by light availability (Duarte and Kalff, 1986;
Canfield et al., 1985; Barko et al., 1986; Smith and Barko, 1990). Long-term control of algal
biomass requires significant water column nutrient reduction. Phosphorus (P) is most frequently
targeted because it is usually the nutrient in shortest supply relative to demands by algae (the
limiting nutrient). Phosphorus does not have a gaseous phase so the atmosphere is not a significant
source, unlike nitrogen or carbon. Lake P concentration, therefore, can be lowered significantly by
reducing loading from land and in-lake sources.
A significant reduction in external nutrient loading is an essential, but not necessarily sufficient,
step toward reducing lake P concentrations. Internal loading from aerobic and anaerobic sediments,
groundwater seepage, decomposing macrophytes, sediment resuspension, and organism activities
might add more nutrients to the lake than external loading during some times of the year.
The shape of a lake’s basin (Figure 2.4) has an important bearing on the amount of internal
loading. Most of the variance in algal productivity among some Ontario lakes was explained by
the ratio of sediment area in contact with the epilimnion to epilimnion volume. Steep-sided, deep
lakes have a low ratio, producing less influence on overlying water (Fee, 1979). Epilimnetic
sediments are warm, leading to increased microbial decomposition rates and to nutrient release
(Jensen and Andersen, 1992). Extensive littoral areas, typical of shallower lakes, may have distinct
Copyright © 2005 by Taylor & Francis
day-night cycles of high and low DO concentrations that stimulate nighttime P releases, especially
under dense macrophyte beds (Frodge et al., 1991). Wind mixing and convective currents may
scour sediments or entrain nutrient-rich littoral or bottom waters of shallow lakes, especially those
with low macrophyte density, thus transporting nutrients to the pelagic zone.
The hypolimnion may or may not be a P source to the epilimnion. When thermal stratification
occurs, hypolimnetic waters are isolated from the atmosphere and are usually too deep to permit
sufficient light penetration for photosynthetic oxygen generation. Respiration in deep waters leads
to DO depletion or elimination, to reducing conditions, and to the associated release of P from
sediment iron complexes. High sulfate concentrations may lead to ferrous sulfide (FeS) production
under reducing conditions, and loss of Fe control of sediment P (Caraco et al., 1989; Golterman,
1995; Gächter and Müller, 2003). In stratified lakes with low resistance to mixing (large surface
area relative to depth), summer winds either briefly destratify the lake (polymixis), or force vertical
entrainment of P-rich hypolimnetic water to the epilimnion. In either case, surface water P con-
centration increases, stimulating an algal bloom. For example, Stauffer and Lee (1973) calculated
that all of the summer algal blooms in Lake Mendota, Wisconsin could be accounted for by transport
of P from the metalimnion to the epilimnion.
This internal P source to the epilimnion may not be significant in lakes that are deep relative
to area of lake surface exposed to wind mixing. This type of lake offers greater resistance to the
force of summer wind (Osgood, 1988). The best predictor of vertical P transport to the epilimnion
appears to be the vertical gradient of P concentration, not lake morphometry (Mataraza and Cooke,
1997). These ideas are explored in Chapters 3 and 4 with respect to model predictions, and in
Chapter 8 where sediment treatment with P inactivating chemicals is discussed.
Macroscopic animals play major roles in nutrient releases from lake sediments. Common carp
digestive activities release P at rates similar to external loading (La Marra, 1975). Bioturbation
(sediment disturbance) by fish and insects and high rates of sloughing of vascular plant tissues are
also nutrient sources to the epilimnion. Reviews of internal recycling include Carlton and Wetzel
(1988), Marsden (1989), Welch and Cooke (1995), Pettersson (1998), and Søndergaard et al. (2001).
These characteristics of littoral and pelagic zones mean that expensive nutrient diversion projects
may not meet expectations for reduced algal biomass until internal nutrient sources are addressed
(Chapters 4 and 8).
Other factors affecting algal biomass include flushing rate, light availability, pH, and zooplank-
ton grazing. These factors can be manipulated as part of a management plan, though significant
reduction of external and internal nutrient loading remains the central part of plans for long term
improvement of excessive algae problems.
2.6 THE EUTROPHICATION PROCESS
A eutrophic lake or reservoir is rich in nutrients and organic materials, and those enriched by human
activities are said to be culturally eutrophic. We have expanded the definition of the eutrophication
process to include the loading of silt and organic matter, as well as nutrients. Thus, we define the
eutrophication process as the loading of inorganic and organic dissolved and particulate matter to
lakes and reservoirs at rates sufficient to increase the potential for high biological production,
decrease basin volume, and deplete DO. This concept of eutrophication is more complete because
it includes all materials that produce the eutrophic condition. The eutrophication process and
associated major in-lake interactions are summarized in Figure 2.6.
Traditionally, eutrophication referred only to nutrient loading, its eventual high concentrations
in the water column, and the high productivity and biomass of algae that could occur. Organic
matter loading may lead to sediment enrichment and loss of volume. Organic matter, whether added
to the water column from external or internal sources, also leads to increased nutrient availability
via direct mineralization, or through release from sediments when respiration is stimulated by this
organic matter and DO is depleted. Net internal P loading appears to increase exponentially with
Copyright © 2005 by Taylor & Francis
increasing dissolved organic carbon content of the lake (Ryding, 1985). Allochthonous organic
matter contains molecules producing changes in algal and microbial metabolism independently of
effects of added nutrients (e.g., Franko and Wetzel, 1981). Finally, organic matter added to a lake
or reservoir contains energy that is incorporated, in both dissolved and particulate forms, into plant
and animal biomass, leading directly to increased living biomass (the microbial loop). Dissolved
and particulate organic matter entering the lake or reservoir from streams, wetlands, and from
macrophytes, is of great significance to lake metabolism. These ideas are developed in Wetzel
(1995, 2001) and Cole (1999).
Silt may be rich in organic matter and in nutrients sorbed to surfaces of particulate matter. These
may become available to algae or macrophytes immediately or at some later time. Silt loading also
contributes directly to volume loss and to an increase in shallow sediment area. Whether volume
loss is produced by silt deposition or by the build-up of refractory organic matter from terrestrial
and aquatic sources, the development of shallow areas fosters further spread of macrophytes and
their attendant epiphytic algae. Ultimately these plants promote further losses of DO and release of
organic molecules and nutrients as they decay (Carpenter, 1980, 1981, 1983) (Figure 2.6).
Thus, silt and organic loadings have effects on lakes that are additional to their nutrient content,
and cannot be excluded when defining the eutrophication process. This view is not meant to
downplay or negate the fundamental importance of high nutrient loading in stimulating lake
productivity. Instead, following Odum’s (1971) holistic view, it is meant as a more complete
description of the process.
Excessive nutrient loading creates potential for eutrophic conditions but does not guarantee
increased productivity. Figure 2.6 does not account for the “oligotrophication” effects of high rates
of lake flushing and dilution, the effects of organisms in stimulating nutrient release from sediments,
or the effects of grazing (or lack of grazing) on algae biomass.
Lakes and reservoirs that are naturally eutrophic, or have become so, have characteristics
separating them from less enriched and oligotrophic (“poorly nourished”) water bodies. Eutrophic
lakes have algal “blooms,” often of monospecific blue-green (cyanobacteria) populations. Some
FIGURE 2.6 Loadings and primary interactions in lakes and reservoirs. (From Cooke, G.D., E.B. Welch,
S.A. Petersen, and P.R. Newroth. 1993. Restoration and Management of Lakes and Reservoirs, 2nd Edition.
Lewis Publishers and CRC Press, Boca Raton, FL.)
Macrophytes
Shallowness,
sediment
enrichment
Nutrients,
organic and
silt loads
Algae
Water column
nutrients
External-internal
nutrient load
Sediment
nutrient release
Macroscopic
animal grazing
Streams, overland flows, wetland discharge
Dissolved & particulate
organic matter
+
“microbial loop”
Copyright © 2005 by Taylor & Francis
also have macrophytes, though exotic macrophyte infestations are not a symptom of the eutrophic
condition because large populations can develop in oligotrophic waters. Eutrophic lakes and res-
ervoirs also have colored water (green/brown), and low or zero DO levels in the deepest areas
(Figure 2.3). Warmwater fish production is likely to be high (Jones and Hoyer, 1982). Fish can be
limited by low DO and high pH (Welch and Jacoby, 2004), and lakes may be dominated by less
desirable fish species or stunted fish populations.
An oligotrophic lake or reservoir is low in nutrients and productivity because organic matter
and nutrient loadings are low or large basin water volumes and short water residence times dilute
or pass material through the lake. In addition, high water hardness may foster co-precipitation of
calcium carbonate (e.g., marl lakes) and essential nutrients, rendering them unavailable to algae.
Oligotrophic lakes are often deep and steep-sided, with nutrient-poor sediments, few macrophytes,
usually no nuisance cyanobacteria, and large amounts of DO in deep water. Water clarity is high,
as is phytoplankton diversity, but total algal biomass is low.
Low biological productivity is not always perceived as a benefit when, for example, a sports
fishery is desired. Some lakes, Lake Mead, Nevada, for example (Axler et al., 1988), have been
fertilized in an attempt to develop more fish biomass. The words “eutrophic” and “oligotrophic”
therefore do not represent “bad” and “good,” but are only descriptive of the state or condition of
a lake or reservoir. Perceived quality is a judgment based upon needs and expectations.
2.7 CHARACTERISTICS OF SHALLOW AND DEEP LAKES
Shallow lakes and reservoirs (< 3 m mean depth) are more common than larger, deeper ones, and
many are eutrophic or heavily impacted by siltation and high turbidity. Their problems, and solutions
to those problems, are reflected in their characteristics. Most lake and reservoir restoration tech-
niques and paradigms were developed from research and testing on less common deep lakes and
may not be entirely suitable for shallow lakes. Throughout this text, we attempt to emphasize
applicability of methods to both classes of lakes. Table 2.2 is a comparison of the characteristics
of deep and shallow lakes, primarily based on European research (e.g., Moss et al., 1996; Jeppesen,
1998; Scheffer, 1998; Havens et al., 1999; Cooke et al., 2001; NALMS, 2003).
Shallow lakes are less sensitive to significant reductions in external nutrient loading because
benthic-pelagic interactions tend to maintain high nutrient levels. Nutrients released from bottom
sediments of shallow lakes affect the entire water column, in contrast to stratified, deep lakes. In
shallow lakes, nutrient release may be very high from bioturbation, wind disturbance, the effects
of gas bubbles, high pH from intense photosynthesis, and from DO deficits at the sediment-water
interface. Diversion of external nutrient loading, while necessary, may not be sufficient to rehabil-
itate a shallow lake and a sediment treatment may be necessary.
Shallow lakes are more likely to exist in one of two alternative and often stable states (Chapter
9). The algae-dominated turbid state is almost a certainty at high nutrient concentrations, whereas
the clear water state, possibly with macrophytes across the well-lighted sediments, will occur at
low concentrations. Between these extremes, either the clear or turbid water state can exist, largely
based on biotic interactions. Lakes with dense populations of planktivorous and benthivorous fish
(e.g., grass carp, common carp, shad), and lakes with large populations of herbivorous birds, are
likely to have few phytoplankton grazers (large-bodied zooplankton), high internal P loading, turbid
water, and little chance of extensive establishment of native submersed plants. Canopy-forming
plants such as Eurasian watermilfoil (Myriophyllum spicatum) may be successful in these lakes.
In contrast, shallow lakes with dominance by piscivorous fish and birds (e.g., largemouth bass,
northern pike, Great Blue Heron) may have abundant algae grazers, stable sediments, clear water,
and populations of submersed plants, even at nutrient concentrations identical to the algae-domi-
nated lake (Moss et al., 1996). In most cases, a shallow lake will have either a community of
macrophytes or turbid water with phytoplankton. A shallow lake that is free of both aquatic plants
Copyright © 2005 by Taylor & Francis
and algae is uncommon, and it is unrealistic to expect such a lake to occur without a large investment
of money and energy.
Shallow lakes are more susceptible than deep lakes to strong biomanipulations, such as fish
addition or removal, leading to a switch in stable states. Adding grass carp at densities sufficient
to eliminate macrophytes, for example, is almost certain to switch a clear lake to a turbid, algae-
dominated one. A fish winterkill may create conditions leading to clear water.
Lake management requires consideration of the differences between deep and shallow lakes.
The consequences of using a particular technique in one lake type may be different from using it
in another type. For example, an alum application to a deep lake may have little effect on epilimnetic
P concentrations if there is no substantial vertical P transport or a steep P gradient. The impact of
an alum treatment on a shallow lake is likely to be dramatic.
2.8 ECOREGIONS AND ATTAINABLE LAKE CONDITIONS
A lake’s geographic location has an important bearing on its attainable condition or trophic state,
a concept valuable to lake managers and lake association members. It places realistic boundaries
or expectations on achievable lake conditions, and provides limits on the types and amounts of
treatment or management that reasonably might be imposed to achieve the desired lake quality.
There was little formal recognition of regional water quality limits until publication (with map
supplement) of “Ecoregions of the Conterminous United States“ (Omernik, 1987), and subsequent
articles (Rohm et al., 1995; Omernik, 1995; Omernik and Bailey, 1997; Griffith et al., 1997a;
Griffith et al., 1999; Bryce et al., 1999; Omernik et al., 2000; Rohm et al., 2002). The original 76
ecoregions were delineated from integrative factors such as land use, and were “based on hypotheses
that ecosystems and their components display regional patterns that are reflected in spatially variable
combinations of causal factors, including climate, mineral availability (soils and geology), vegeta-
tion, and physiography” (Omernik, 1987; Figure 2.7).
The purpose for describing ecoregions was to assist resource managers in understanding aquatic
ecosystem regional patterns of nutrient concentrations, biotic assemblages, and lake trophic state,
TABLE 2.2
Characteristics of Shallow and Deep Lakes
Characteristic Shallow Deep
1. Likely size of drainage area to lake area Large Smaller
2. Responsiveness to diversion of external loading Less More
3. Polymictic Often Rarely
4. Benthic–pelagic coupling High Low
5. Internal loading impact on photic zone High Lower
6. Impact of benthivorous fish on nutrients/turbidity High Lower
7. Fish biomass per unit volume Higher Lower
8. Fish predation on zooplankton Higher Lower
9. Nutrient control of algal biomass Lower Higher
10. Responsiveness to strong biomanipulation More Lesser
11. Chance of turbid state with plant removal Higher Lower
12. Probability of fish winterkill Higher Lower
13. % Area/volume available for rooted plants High Low
14. Impact of birds/snails on lake metabolism Higher Lower
15. Chance of macrophyte-free clear water Low Higher
Source: Modified from Cooke, G.D. et al. 2001. LakeLine (NALMS) 21: 42–46.
With permission.
Copyright © 2005 by Taylor & Francis
FIGURE 2.7 Ecoregions of the conterminous United States. 1, Coast Range; 2, Puget Lowland; 3, Willamette Valley; 4, Cascades; 5, Sierra Nevada; 6, Southern & Central California Plains & Hills; 7, Central
California Valley; 3, Southern California Mountains; 9, Eastern Cascades Slopes & Foothills; 10, Columbia Basin; 11, Blue Mountains; 12, Snake River Basin/High Desert; 13, Northern Basin & Range; 14, Southern
Basin & Range; 15, Northern Rockies; 16, Montana Valley & Foothill Prairies; 17, Middle Rockies; 18, Wyoming Basin; 19, Wasatch and Uinta Mountains; 20, Colorado Plateaus; 21, Southern Rockies; 22, Arizona/New
Mexico Plateau; 23, Arizona/New Mexico Mountains; 24, Southern Deserts; 25, Western High Plains; 26, Southwestern Tablelands; 27, Central Great Plains; 28, Flint Hills; 29, Central Oklahoma/Texas Plains; 30, Central
Texas Plateau; 31, Southern Texas Plains; 32, Texas Blackland Prairies; 33, East Central Texas Plains; 34, Western Gulf Coastal Plain; 35, South Central Plains; 36, Quachita Mountains; 37, Arkansas Valley; 38, Boston
Mountains; 39, Ozark Highlands; 40, Central Irregular Plains; 41, Northern Montana Glaciated Plains; 42, Northwestern Glaciated Plains; 43, Northwestern Great Plains; 44, Nebraska Sand Hills; 45, Northeastern Great
Plains; 46, Northern Glaciated Plains; 47, Western Corn Belt Plains; 48, Red River Valley; 49, Northern Minnesota Wetlands; 50, Northern Lakes and Forests; 51, North Central Hardwood Forests; 52, Driftless Area;
53, Southeastern Wisconsin Till Plains; 54, Central Corn Belt Plains; 55, Eastern Corn Belt Plains; 56, Southern Michigan/Northern Indiana Till Plains; 57, Huron/Erie Lake Plain; 58, Northeastern Highlands; 59,
Northeastern Coastal Zone; 60, Northern Appalachian Plateau and Uplands; 62, Erie/Ontario Lake Plain; 62, North Central Appalachians; 63, Middle Atlantic Coastal Plain; 64, Northern Piedmont; 65, Southeastern
Plains; 66, Blue Ridge Mountains; 67, Central Appalachian Ridges and Valleys; 68, Southwestern Appalachians; 69, Central Appalachians; 70, Western Allegheny Plateau; 71, Interior Plateau; 72, Interior River Lowland;
73, Mississippi Aluvial Plain; 74, Mississippi Valley Loess Plains; 75, Southern Coastal Plain; 76, Southern Florida Coastal Plain. (From Omernik, J.M., 1987. Ann. Assoc. Am. Geogr. 77: 118–125. With permission.)
1
1
1
2
4
4
10
15
15 17
16
17
17
16
41
17
16
43
42
46
48
49
51
50
52
53
56
55
70
67
64
60
61
58
58
59
69
71
63
62
67
72
68
65
75
76
65
66
61
57
50
57
45
11
12
13
19
20
19
8
8
18
25
27
44
21
26
14
23
23
22
23
23
24
25 26
30
31
32
33
35
74
36
39
40
54
47
37
38
28
32
29
27
34
23
5
3
4
6
6
6
7
9
17
63
Copyright © 2005 by Taylor & Francis
thus allowing informed management decisions and reasonable expectations about attainable con-
ditions. For example, the concentrations of silt, organic matter, and nutrients in streams within an
ecoregion, although variable, are likely to be more similar to each other than to concentrations of
these constituents in streams of adjacent ecoregions with different soils, vegetation types, and runoff
potentials. It follows that the condition of lakes within an ecoregion that has nutrient-rich, erodible
soils and reduced vegetation cover is likely to be different from lakes in a nearby ecoregion with
sandy soils, flat relief, and dense tree cover. These expectations have been verified for streams of
Arkansas, Kansas, Minnesota, Ohio, and Oregon and for lakes of Michigan, Minnesota, Ohio, and
Wisconsin (Hawkes et al., 1986; Hughes and Larsen, 1988; Larsen et al., 1988; Omernik et al.,
1988; Wilson and Walker, 1989; Fulmer and Cooke, 1990).
Minnesota uses the ecoregion concept to manage lakes. While there are seven ecoregions that
extend into Minnesota (Figure 2.8), 98% of the state’s 12,000 lakes over 10 ha are found in only
four of them. Table 2.3 lists characteristics of the lakes and their streams and watersheds for the
four ecoregions (Heiskary et al., 1987; Heiskary and Wilson, 1989; Wilson and Walker, 1989).
There are substantial differences between the North Central Hardwood Forest (NCHF) and Northern
Lakes and Forests (NLF) ecoregions versus the Western Corn Belt Plains (WCBP) and Northern
Glaciated Plains (NGP) ecoregions. Lake users in the NCHF and NLF ecoregions should expect
their lakes to be clear and essentially free of algal blooms. This is the attainable lake condition for
these ecoregions, and management of problem lakes is directed toward achieving that realistic lake
condition. Lakes a few hundred kilometers to the south, in the WCBP ecoregion, usually have
macrophytes, algal blooms, low transparency, and anoxic hypolimnia to some degree. Lake man-
agement in this ecoregion cannot produce lakes with mean depths, chlorophyll levels, or water
transparencies like those in the NCHF or NLF without extraordinary expenditures. Therefore lakes
of a particular ecoregion should be managed for reasonable attainability and realistic expectations
relative to overall regional or ecoregional lake quality.
The concept of regional lake quality can be both misleading and helpful in management
decisions. For example, Shagawa Lake, Minnesota is located in the NLF ecoregion where mean
FIGURE 2.8 Minnesota’s lake ecoregions and spatial distribution of representative lakes. These lakes com-
prise the “ecoregion data base.“ (From Wilson, C.B. and W.W. Walker, Jr. 1989. Lake and Reservoir Manage.
5(2): 11–22. With permission.)
Northern
lakes & forests
North central
hardwood forests
Western corn belt plains
Northern
glaciated
plains
Copyright © 2005 by Taylor & Francis
summer lake total P (TP) concentration is about 20–25 μg P/L
(mesotrophic). However, summer
TP in Shagawa Lake averaged between 50 and 60 μg P/L (eutrophic), an anomaly for the region,
due to loading from wastewater treatment at Ely, Minnesota (Peterson, et al. 1995). Advanced
wastewater treatment was expected to reduce effluent concentration to less than 20 μg P/L and the
lake was expected to return to a normal TP level for the region. However, what was unknown when
the treatment plant upgrade was proposed was that sediment nutrient recycling would maintain
high summer P concentrations in the lake. Although annual TP levels decreased (Chapter 4), internal
loading kept summer TP concentration high and algae bloomed. Lake managers were misled by
regional lake conditions, thinking that a major reduction in inflow nutrients would return the lake
to a mesotrophic or oligotrophic status. The importance of internal loading in maintaining high
summer TP in Shagawa Lake was demonstrated with a dynamic TP model (Larsen et al., 1979).
Another example is that of the Fairmont Lakes, Minnesota in the WCBP ecoregion. The TP
concentration in the lake’s hypereutrophic surface waters ranged from 30 to 150 μg P/L (Stefan
and Hanson, 1981) that differed little from the WCBP ecoregion mean of about 130 μg P/L. This
regional average lake trophic state information was not generally available or well understood by
limnologists when lake management began, and lake managers spent nearly 60 years of well-
intended but futile efforts to change the Fairmont Lakes to a low algal biomass lake through chemical
treatments (Chapter 10) and dredging. It is now clear that the quality of the Fairmont Lakes is
TABLE 2.3
Summary of Land Use and Water Quality Data for Four
Ecoregions in Minnesota
Variable Units NCHF NLF NGP WCBP
Number of lakes 36 30 8 11
Land uses
Cultivated % 34.8 1.8 73.0 60.6
Pasture % 18.0 3.9 9.2 5.9
Urban % 0.7 0.0 2.0 1.5
Residential % 6.4 4.8 0.4 9.9
Forested % 16.4 66.2 0.0 7.0
Marsh % 2.5 2.1 0.6 1.2
Water % 20.9 20.9 14.4 13.6
Watershed area ha 4670 2140 2464 756
Lake area ha 364 318 218 107
Mean depth m 6.6 6.3 1.6 2.5
Total phosphorus (P) mg/L 33 21 156 98
Chlorophyll A mg/L 14 6 61 67
Secchi disc m 2.5 3.5 0.6 0.9
Total P load kg/yr 1004 305 1943 590
Inflow P mg/L 183 58 5666 564
Areal P load kg/km
2
/yr 276 96 891 551
Outflow km
3
/yr 6.2 5.3 0.9 1.0
Water residence time yr 9.3 5.0 36.2 4.8
Stream total P mg/L 148 52 1500 570
Note: Ecoregions: NCHF, Northern Central Hardwood Forests; NLF, Northern
Lakes and Forests; NGP, Northern Glaciated Plains; WCBT, Western Corn Belt
Plains. Data are listed as averages.
Source: From Wilson, C.B. and W.W. Walker, Jr. 1989. Lake and Reservoir
Manage. 5(2): 11–22. With permission.
Copyright © 2005 by Taylor & Francis
“normal” for this region. These lakes will always resemble others of the region unless there are
very expensive in-lake manipulations and major changes in land uses.
Ecoregions were not established to regionalize a specific characteristic, but were meant as
“spatial tools” to work with the quality of the “aggregate of environmental resources” of a region
(Omernik and Bailey, 1997, p. 939; Figure 2.9). Misunderstanding of this concept can lead to
misinterpretations of regional data by resource managers. For example, Secchi disk transparency
data collected by volunteers as part of the Great American Dip-In (Carlson et al., 1977) may not
be suitable for extrapolation to lakes in the region because the data might not be representative of
all lakes in the region. Peterson (1997) cautioned potential Dip-In data users about possible biases
resulting from the data provided by volunteers who sampled lakes they liked, disliked, lived on,
or were willing to sample. For example, median Secchi disk transparency in northeastern U.S.
lakes, based on data from Dip-In volunteers, was reported as 4.2 m (Lee et al., 1997). However, a
random sampling of lakes in the northeastern U.S. demonstrated that median transparency was only
2.4 m and that lakes sampled by the volunteers were nearly nine times larger than the general
population of lakes in this region (Figures 2.10 and 2.11; Peterson et al., 1999). This demonstrates
how extrapolations from non-representative lake data can be misleading. In another example, Dip-
In transparency data for the upper Midwestern U.S. region, which were not obtained from a
statistics-based sampling program, were extrapolated as continuous three dimensional plots for the
region in an attempt to indicate overall regional lake quality (Lee et al., 1997). Unless attainable
resource conditions for an ecoregion are based on representative data, resource conditions can be
misrepresented and misunderstood, and may lead to erroneous conclusions and perhaps to erroneous
management decisions (Peterson, 1997; Peterson et al., 1999; Omernik and Bailey, 1997).
Some states rank lakes and reservoirs on the basis of their current trophic state (Chapter 3),
and on public use and other similar considerations, in order to establish funding priorities for
restoration. Typically the most eutrophic lakes are given top priority. The differences in stream
quality among ecoregions within a state suggests another approach that ranks lakes according to
their potential for improvement, thereby directing limited public funds to the best candidates for
restoration. Fulmer and Cooke (1990) examined this idea for 19 Ohio reservoirs in four adjacent
FIGURE 2.9 Continuum of regional frameworks for lake assessment and management.
1
Omernik, 1987, 1995;
2
USEPA, 1998;
3
Griffith et al, 1997b;
4
Omernik et al., 1998, Rohm et al., 1995;
5
Omernik and Powers, 1983,
Omernick and Griffith, 1986;
6
Omernik, 1977. (From Griffith, G.E. et al. 1999. J. Soil Water Conserv. 54:
666–677. With permission.)
Copyright © 2005 by Taylor & Francis
FIGURE 2.10 Lake size cumulative distribution function (cumulative frequency) for the EMAP and Dip-In
data sets across the northeastern United States (vertical lines show median lake sizes for each data set). (From
Peterson, S.A. et al., 1999. Environ. Sci. Technol. 33: 1559–1565. With permission.)
FIGURE 2.11 Secchi disk transparency (SDT) cumulative distribution function (cumulative frequency) for
EMAP and Dip-In data sets across the northeastern United States. (vertical lines show median SDT’s for each
data set). (From Peterson, S.A. et al., 1999. Environ. Sci. Technol. 33: 1559–1565. With permission.)
Copyright © 2005 by Taylor & Francis
ecoregions. Stream TP concentrations were selected that represented the 25th percentile concen-
tration (the mean concentration in the lowest one-quarter of all concentrations) in the least impacted
streams in the Ohio ecoregion in which each reservoir is found (from Larsen et al., 1988). These
concentrations, along with hydrologic and morphometric data, were used with the Canfield and
Bachmann (1981) loading model (Chapter 3). The model predicted the attainable steady state P
concentration in the lacustrine deep-water zone of each reservoir. The 25th percentile concentration
was not arbitrarily chosen. It was considered to be a concentration that can be reached in impacted
streams through technologically feasible remediations in the watershed, including advanced waste
treatment, detention of feedlot runoff, and improved agricultural practices.
Fulmer and Cooke (1990) compared predicted reservoir TP concentrations to measured con-
centrations. Five reservoirs were identified that had higher actual lacustrine zone TP concentrations
than expected or predicted for that ecoregion. These five were not the most eutrophic of the 19
reservoirs, but were those deviating the most from expected conditions and were, therefore, those
that should exhibit the greatest improvement if stream TP loading is reduced to the 25th percentile
P concentration of the least impacted streams in the ecoregions (Figure 2.12). Final selections of
lakes for management or restoration also involve considerations such as intended uses, proximity
to users, number of other lakes in the area, and an in-depth analysis of nutrient dynamics in relation
to lake trophic state.
The use of ecoregions for lake management continues to be evaluated. A special purpose map
of summer total TP in lakes was developed for Minnesota, Wisconsin and Michigan (Omernik et
al., 1988, 1991). The Wisconsin Department of Natural Resources currently is developing an
approach for setting lake quality standards based in part on these lake TP maps. Although ecoregions
are helpful in establishing regional expectations with regard to lake quality, and in evaluating
relationships between lake quality and morphometric and landscape characteristics, lake TP maps
explain more clearly some of the regional patterns. Work on TP maps has been completed for the
northeastern U.S. (Rohm et al., 1995), Florida (Griffith et al., 1997a), and the entire U.S. (Rohm
et al., 2002).
FIGURE 2.12 Potential phosphorus reduction determined by comparing the 1989 actual lake trophic state to
the estimated attainable trophic state. Lakes with the greatest potential for improvement are 6, 7, 10, 11, and
12. (From Fulmer, D.G. and G.D. Cooke. 1990. Lake and Reservoir Manage. 6: 197–206. With permission).
80
70
60
50
40
30
02
Lake
4 6 8 1012141618
TSI
∗
∗
∗
∗
∗
Potential
Actual
Copyright © 2005 by Taylor & Francis
The use of ecoregions to assist with lake restoration and management decisions differs from
approaches that might, for example, advocate national lake quality standards, or the use of a median
TP concentration as a statewide, or even a nationwide, standard. Statewide or national lake standards
are likely to fail to protect lakes in ecoregions where stream quality should be very high and could
encourage large expenditures in cases where improved lake and stream quality would be difficult.
The use of an ecoregional assessment approach brings a sense of regional ecological reality to lake
management and restoration goal setting. The USEPA’s Science Advisory Board stated (USEPA,
1991): “the ecoregion approach is a defensible classification technique for large areas (covering
one or more states) that is superior to the classification methods that are currently used by most
environmental managers.”
2.9 SUMMARY
The purpose of this chapter is to familiarize the reader with some of the basic concepts of limnology
that are important to lake and reservoir management. Reservoirs and lakes have fundamental
differences, but the characteristics of many of their most important features converge when water
residence times are similar. The most important determinants of lake and reservoir productivity are
the amount of shallow water that can support wetland/littoral plants and the concentration of a
limiting nutrient in the water column. Lakes and reservoirs of some ecoregions are expected to be
clear, deep, and comparatively unproductive, and deviations from this should respond to manage-
ment. In other areas, moderate or even high aquatic productivity is to be expected, and far more
costly or complicated management methods will be needed to achieve any improvements in
condition beyond this level.
REFERENCES
Anthony, J.L. and J.A. Downey. 2003. Physical impacts of wind and boat traffic on Clear Lake, Iowa. Lake
and Reservoir Manage. 19: 1–14.
Axler, R., L. Paulson, P. Vaux, P. Sollberger and D.H. Baepler. 1988. Fish Aid — the Lake Mead fertilization
project. Lake and Reservoir Manage. 4(2): 125–135.
Bachmann, R.W., M.V. Hoyer and D.E. Canfield, Jr. 2000. The potential for wave disturbance in shallow
Florida lakes. Lake and Reservoir Manage. 16: 281-291.
Barko, J.W., M.S. Adams and N.L. Clesceri. 1986. Environmental factors and their consideration in the
management of submersed aquatic vegetation: A review. J. Aquatic Plant Manage. 24: 1–10.
Bryce, S.A., J.M. Omernik and D.P. Larsen. 1999. Ecoregions: A geographic framework to guide risk
characterization and ecosystem management. Environ. Practice 1: 141-155.
Canfield, D.E., Jr. and R.W. Bachmann. 1981. Prediction of total phosphorus concentrations, chlorophyll a,
and Secchi depths in natural and artificial lakes. Can. J. Fish. Aquatic Sci. 38: 414–423.
Canfield, D.E. Jr., K.A. Langeland, S.B. Linda and W.T. Haller. 1985. Relations between water transparency
and maximum depth of macrophyte colonization in lakes. J. Aquatic Plant Manage. 23: 25–28.
Caraco, N.F., J.J. Cole and G.E. Likens. 1989. Evidence for sulphate-controlled phosphorus release from
sediments of aquatic systems. Nature 341: 316–318.
Carlson, R.E., J. Lee and D. Waller. 1997. The 1995 and 1996 Great American Secchi Dip-In: A report to
the volunteers. Lakeline 17(2): 32a–32d.
Carlton, R.G. and R.G. Wetzel. 1988. Phosphorus flux from lake sediments: effect of epiphytic algal oxygen
production. Limnol. Oceanogr. 33: 562–570.
Carpenter, S.R. 1980. Enrichment of Lake Wingra, Wisconsin, by submersed macrophyte decay. Ecology 61:
1145–1155.
Carpenter, S.R. 1981. Submersed vegetation: an internal factor in lake ecosystem succession. Am. Nat. 118:
372–383.
Copyright © 2005 by Taylor & Francis
Carpenter, S.R. 1983. Lake geometry: implications for production and sediment accretion rates. J. Theor. Biol.
105: 273–286.
Cole, G.A. 1994. Textbook of Limnology. 4th edition Waveland Press, Prospect Heights, IL.
Cole, J.J. 1999. Aquatic microbiology for ecosystem scientists: New and recycled paradigms in ecological
microbiology. Ecosystems 2: 215–225.
Cooke, G.D. and R.H. Kennedy. 2001. Managing drinking water supplies. Lake and Reservoir Manage. 17:
157–174.
Cooke, G.D., P. Lombardo and C. Brant. 2001. Shallow and deep lakes: Determining successful management
options. LakeLine (NALMS) 21: 42–46.
Cooke, G.D., E.B. Welch, S.A. Petersen, and P.R. Newroth. 1993. Restoration and Management of Lakes and
Reservoirs, 2nd Edition. Lewis Publishers and CRC Press, Boca Raton, FL.
Duarte, C.M. and J. Kalff. 1986. Littoral slope as a predictor of the maximum biomass of submerged
macrophyte communities. Limnol. Oceanogr. 31: 1072–1080.
Duarte, C.M. and J. Kalff. 1988. Influence of lake morphometry on the response of submerged macrophytes
to sediment fertilization. Can. J. Fish. Aquatic Sci. 45: 216–221.
Fee, E.J. 1979. A relation between lake morphometry and primary productivity and its use in interpreting
whole-lake eutrophication experiments. Limnol. Oceangr. 24: 401–416.
Franko, D.A. and R.G. Wetzel. 1981. Synthesis and release of cyclic adenosine 3′:5′-monophosphate by aquatic
macrophytes. Physiol. Plant. 52: 33–36.
Frey, D.G. Ed. 1966. Limnology in North America. University of Wisconsin Press, Madison.
Frodge, J.D., G.I. Thomas and G.B. Pauley. 1991. Sediment phosphorus loading beneath dense canopies of
aquatic macrophytes. Lake and Reservoir Manage. 7: 61–71.
Fulmer, D.G. and G.D. Cooke. 1990. Evaluating the restoration potential of 19 Ohio reservoirs. Lake and
Reservoir Manage. 6: 197–206.
Gächter, R. and B. Müller. 2003. Why the phosphorus retention of lakes does not necessarily depend on the
oxygen supply to their sediment surface. Limnol. Oceanogr. 48: 929–933.
Gaugush, R.F. 1986. Statistical methods for reservoir water quality investigations. Instr. Rept. E-86-2. U.S.
Army Corps Engineers, Vicksburg, MS.
Golterman, H.L. 1995. The role of the iron-hydroxide-phosphate-sulfide system in the phosphorus exchange
between sediments and the overlying water. Hydrobiologia 297: 43–54.
Griffith, G.E., J.M. Omernik and A.J. Kinney. 1997. Interpreting patterns of lake alkalinity in the upper
Midwest region. Lake and Reservoir Manage. 10(6): 329–336.
Griffith, G.E., D. E. Canfield Jr., C.A. Horsburgh, and J.M. Omernik. 1997b. Lake regions of Florida. USEPA
R97/127.
Griffith, G.E., J.M. Omernik and A.J. Woods. 1999. Ecoregions, watersheds, basins, and HUC’s: How state
and federal agencies frame water quality. J. Soil Water Conserv. 54: 666–677.
Gunnison, D. and J.M. Brannon. 1981. Characterization of Anaerobic Chemical Processes in Reservoirs:
Problem Description and Conceptual Model Formulation. Tech. Rept. E-81-6. U.S. Army Corps
Engineers, Vicksburg, MS.
Havens, K.E., H.J. Carrick, E.F. Lowe and M.F. Coveney. 1999. Contrasting relationships between nutrients,
chlorophyll a and secchi transparency in two shallow subtropical lakes: Lakes Okeechobee and Apopka
(Florida). Lake and Reservoir Manage. 15: 298–309.
Hawkes, C.L., D.L. Miller and W.G. Layther. 1986. Fish ecoregions of Kansas: stream fish assemblage patterns
and associated environmental correlates. Environ. Biol. Fish. 17: 267–279.
Heiskary, S.A. and C.B. Wilson. 1989. The regional nature of water quality across Minnesota: An analysis
for improving resource management. J. Minn. Acad. Sci. 55(1): 71–77.
Heiskary, S.A., C.B. Wilson and D.P. Larsen. 1987. Analysis of regional pattern in lake water quality: Using
ecoregions for lake management in Minnesota. Lake and Reservoir Manage.
3: 337–344.
Horppila, J. and L. Nurminen. 2003. Effects of submerged macrophytes on sediment resuspension and internal
phosphorus loading in Lake Hiidenvesi (southern Finland). Water Res. 37: 4468–4474.
Horne, A.J. and C.R. Goldman. 1994. Limnology. 2nd edition. McGraw-Hill, New York, NY.
Hughes, R.M. and D.P. Larsen. 1988. Ecoregions: an approach to surface water protection. J. Water Pollut.
Contr. Fed. 60: 486–493.
Hutchinson, G.E. 1957. A Treatise on Limnology. Vo l u m e I. Geography, Physics, and Chemistry. John Wiley
& Sons, New York.
Copyright © 2005 by Taylor & Francis
Hutchinson, G.E. 1967. A Treatise on Limnology. Vo l u m e II. Introduction to Lake Biology and the Limno-
plankton. John Wiley & Sons, New York.
Hutchinson, G.E., 1975. A Treatise on Limnology. Volum e III. Limnological Botany. John Wiley & Sons, New
York.
Jensen, H.S. and F.O. Andersen. 1992. Importance of temperature, nitrate, and pH for phosphate release from
aerobic sediments of four shallow, eutrophic lakes. Limnol. Oceanogr. 37: 577–589.
Jeppesen, E. 1998. The Ecology of Shallow Lakes. Trophic Interactions in the Pelagial. National Environmental
Research Institute, Silkeborg, Denmark.
Jones, J.R. and M.V. Hoyer. 1982. Sportfish harvest predicted by summer chlorophyll a concentration in
Midwestern lakes and reservoirs. Trans. Am. Fish. Soc. 111: 176–179.
Kalff, J. 2002. Limnology. Inland Water Ecosystems. Prentice-Hall, Upper Saddle, NJ.
Kennedy, R.H. 1999. Reservoir design and operation: Limnological implications and management In: J.G.
Tundisi and M. Straskraba (Eds.), Theoretical Reservoir Ecology and Its Applications. International
Institute of Ecology, Brazilian Academy of Sciences. Backhuys Publishers, Leiden, The Netherlands.
pp. 1–28.
Kennedy, R.H., 2001. Considerations for establishing nutrient criteria for reservoirs.
Lake and Reservoir
Manage. 17: 175–187.
Kennedy, R.H. and R.F. Gaugush, 1988. Assessment of water quality in Corps of Engineers reservoirs. Lake
and Reservoir Manage. 4(2): 253–260.
Kennedy, R.H., K.W. Thornton and R.C. Gunkey. 1982. The establishment of water quality gradients in
reservoirs. Can. Water Res. J. 7: 71–87.
Kennedy, R.H., K.W. Thornton and D.E. Ford. 1985. Characterization of the reservoir ecosystem. In: D.
Gunnison. (Ed.), Microbial Processes in Reservoirs. Junk Publishers, The Hague, Netherlands. pp.
27–38.
Kimmel, B.C. and A.W. Groeger. 1984. Factors controlling primary production in lakes and reservoirs: a
perspective. In: Lake and Reservoir Management. USEPA 440/5-84-001. pp. 277–281.
LaMarra, V.J., Jr. 1975. Digestive activities of carp as a major contributor to the nutrient loading of lakes.
Verh. Int. Verein. Limnol. 19: 2461–2468.
Lampert, W. and U. Sommer. 1997. Limnoecology. The Ecology of Lakes and Streams. Oxford University
Press, New York, NY.
Larsen, D.P., D.R. Dudley and R.M. Hughes. 1988. A regional approach for assessing attainable surface water
quality: an Ohio case study. J. Soil Water Conserv. 43: 171–176.
Larsen, D.P., J. VanSickle, K.W. Malueg and P.D. Smith. 1979. The effect of wastewater phosphorus removal
on Shagawa Lake, Minnesota: Phosphorus supplies, lake phosphorus, and chlorophyll-a. Water Res.
13:1259–1272.
Lee, J., M.R. Binkley and R.E. Carlson. 1997. The Great American Secchi Dip-In: GIS contributes to national
snapshot of lake-water quality. GIS World August: 42–44.
Marsden, M.W. 1989. Lake restoration by reducing external phosphorus loading: the influence of sediment
phosphorus release. Freshwater Biol. 21: 139–162.
Mataraza, L.K. and G.D. Cooke. 1997. A test of a morphometric index to predict vertical phosphorus transport
in lakes. Lake and Reservoir Manage. 13: 328–337.
Moore, L. and K. Thornton, Eds. 1988. Lake and Reservoir Restoration Guidance Manual. USEPA 440/5-
88-002.
Moss, B., J. Madgwick and G. Phillips. 1996. A Guide to the Restoration of Nutrient-Enriched Shallow Lakes.
Broads Authority. Norwich, Norfolk, UK.
North American Lake Management Society (NALMS). 2003 Shallow Lakes.
LakeLine 23(1).
Odum. E.P. 1971. Fundamentals of Ecology. 3rd Edition. W.B. Saunders, Philadelphia.
Omernik, J.M. 1977. Nonpoint source stream nutrient level relationships: A nationwide study. USEPA
600/3–77/105.
Omernik, J.M. 1987. Ecoregions of the conterminous United States. Ann. Assoc. Am. Geogr. 77: 118–125.
Omernik, J.M. 1995. Ecoregions: A framework for managing ecosystems. George Wright Forum 12: 35–51.
Omernik, J.M. and R.G. Bailey. 1997. Distinguishing between watersheds and ecoregions. J. Am. Water Resour.
Assoc. 33: 935–949.
Omernik, J.M. and G.E. Griffith. 1986. Total alkalinity of surface waters: A map of the Upper Midwest region
of the United States. Environ Manage. 10: 829–839.
Copyright © 2005 by Taylor & Francis
Omernik, J.M. and C.F. Powers. 1983. total alkilinity of surface waters: A national map. Ann. Assoc. Amer.
Geogr. 73: 133–136.
Omernik, J.M., D.P. Larsen, C.M. Rohm and S.E. Clarke. 1988. Summer total phosphorus in lakes: a map of
Minnesota, Wisconsin, and Michigan. Environ. Manage. 12: 815–825.
Omernik, J.M., C.M. Rohm, R.N. Lillie and N. Mesner. 1991. Usefulness of natural regions for lake manage-
ment: analysis of variation among lakes in northwestern Wisconsin. Environ. Manage. 15: 281–293.
Omernik, J.M.S.S. Chapman, R.A. Lillie and R.T. Dumke. 2000. Ecoregions of Wisconsin. Trans. Wisc. Acad.
Sci. 88: 77–103.
Osgood, R.A. 1988. Lake mixes and internal phosphorus dynamics. Arch. Hydrobiol. 113: 629–638.
Peterson, S.A. 1997. Liked volunteerism coverage, not cover; cautions against Dip-In generalization. Lakeline
17(3): 4–5.
Peterson, S.A., R.M. Hughes, D.P. Larsen, S.G. Paulsen and J.M. Omernik. 1995. Regional lake quality
patterns: Their relationship to lake conservation and management decisions. Lakes Reservoirs: Res.
Manage. 1:163–167.
Peterson, S.A., D.P. Larsen, S.G. Paulsen and N.S. Urquhart. 1998. Regional lake trophic patterns in the
northeastern United States: Three approaches. Environ. Manage. 22(5): 789–801.
Peterson, S.A., N.S. Urquhart and E.B. Welch. 1999. Sample representativeness: A must for reliable regional
lake condition estimates. Environ. Sci. Technol. 33: 1559–1565.
Pettersson, K. 1998. Mechanisms for internal loading of phosphorus in lakes. Hydrobiologia 373/374: 21–25.
Rohm, C.M., J.M. Omernik and C.W. Kiilsgaard. 1995. Regional patterns of total phosphorus in lakes of the
northeastern United States. Lake and Reservoir Manage. 11(1): 1–14 (color map).
Rohm, C.M., J.M. Omernik, A.J. Woods and J.L. Stoddard. 2002. Regional characteristics of nutrient con-
centrations in streams and their application to nutrient criteria development. J. Am. Water Resour.
Assoc. 38(1): 1–27.
Ryding, S.O. 1985. Chemical and microbiological processes as regulators of the exchange of substances
between sediments and water in shallow eutrophic lakes. Int. Rev. ges. Hydrobiol. 70: 657–702.
Scheffer, M. 1998. Ecology of Shallow Lakes. Kluwer Academic Publishers, Norwell, MA.
Smith, C.S. and J.W. Barko. 1990. Ecology of Eurasian watermilfoil. J. Aquat. Plant Manage. 28: 55–63.
Søballe, D.M. and B.C. Kimmel. 1987. A large-scale comparison of factors influencing phytoplankton abun-
dance in rivers, lakes, and impoundments. Ecology 68: 1943–1954.
Søndergaard, M., J.P. Jensen and E. Jeppesen. 2001. Retention and internal loading of phosphorus in shallow,
eutrophic lakes. Sci. World 1: 427–442.
Stauffer, R.E. and G.F. Lee. 1973. The role of thermocline migration in regulating algal blooms. In: E.J.
Middlebrooks, D.H. Falkenborg, and T.E. Maloney (Eds.), Modeling the Eutrophication Process, Utah
State University, Water Resources Center, Logan, UT. pp. 73–82.
Stefan, H.G. and M.J. Hanson. 1981. Phosphorus recycling in five shallow lakes. J. Environ. Eng. Div. ASCE,
107(EE4): 713–730.
Thornton, K.W., R.H. Kennedy, J.H. Carroll, W.W. Walker, R.C. Gunkey and S. Ashby. 1980. Reservoir
sedimentation and water quality — an heuristic model. In: Symposium on Surface Water Impound-
ments. Proceedings Am. Soc. Civil Eng. pp. 654–661.
Thornton, K.W., B.L. Kimmel and F.E. Payne (Eds.). 1990. Reservoir
Limnology: Ecological Perspectives.
John Wiley & Sons, New York, pp. ix and 246.
U.S. Environmental Protection Agency (USEPA) Science Advisory Board. 1991. Evaluation of the ecoregion
concept. Report of the Ecoregions Subcommittee of the Ecological Processes and Effects Committee.
USEPA-SAB-EPEC-91-003. Washington, DC.
U.S. Environmental Protection Agency (USEPA). 1998. National strategy for the development of regional
nutrient criteria. USEPA 822/R98–002,
Vadeboncoeur, Y., M.J. Vander Zanden and D.M. Lodge. 2002. Putting the lake back together: Reintegrating
benthic pathways into lake food web models. BioScience 52: 44–54.
Walker, W.W., Jr. 1981. Empirical Methods for Predicting Eutrophication in Impoundments. Report I. Phase
II: Date Base Development. Tech. Rept. E-81-9. U.S. Army Corps Engineers, Vicksburg, MS.
Walker, W.W., Jr. 1987. Empirical Methods for Predicting Eutrophication in Impoundments. Report 4. Phase
III: Applications Manual. Tech. Rept. E-81-9. U.S. Army Corps Engineers, Vicksburg, MS.
Welch, E.B. and J.M. Jacoby. 2004. Pollutant Effects in Freshwater: Applied Limnology. 3rd Edition. Spon
Press, New York.
Copyright © 2005 by Taylor & Francis
Welch, E.B. and G.D. Cooke. 1995. Internal phosphorus loading in shallow lakes: Importance and control.
Lake and Reservoir Manage.11: 273-281.
Wetzel, R.G. 1992. Gradient-dominated ecosystems: sources and regulatory functions of dissolved organic
matter in fresh water ecosystems. Hydrobiologia 229: 181–198.
Wetzel, R.G. 1995. Death, detritus, and energy flow in aquatic ecosystems. Freshwater Biol. 33: 83–89.
Wetzel, R.G. 2001. Limnology. Lake and River Ecosystems. 3rd edition. Academic Press, New York.
Wilson, C.B. and W.W. Walker, Jr. 1989. Development of lake assessment methods based upon the aquatic
ecoregion concept. Lake and Reservoir Manage. 5(2): 11–22.
Copyright © 2005 by Taylor & Francis