RESTORATION AND MANAGEMENT OF LAKES AND RESERVOIRS - CHAPTER 3 ppt
Bạn đang xem bản rút gọn của tài liệu. Xem và tải ngay bản đầy đủ của tài liệu tại đây (581.38 KB, 39 trang )
3
Lake and Reservoir Diagnosis
and Evaluation
3.1 INTRODUCTION
The success of efforts to restore and/or improve the quality of lakes and reservoirs depends on the
thoroughness of the diagnosis and evaluation prior to initiating restoration measures. Thorough
diagnosis with appropriate predictive methods allows realistic expectations. This chapter describes
the following: (1) the constituents and variables that should be determined in the watershed and in
the lake and its sediment; (2) the sample number needed and their frequency; (3) ways to express
the data collected; (4) the levels of constituents that indicate trophic state; and (5) how to determine
the limiting nutrient. Also, it covers aspects of phosphorus modeling, how to predict the response
to treatment and how to choose a treatment(s) based on predicted response, past success, and cost.
There have been many mistakes made in the name of lake restoration and management.
Techniques that are the correct choice in some situations have been used in the wrong circumstances,
sometimes for political reasons, but sometimes because the diagnosis and evaluation were inade-
quate (Peterson et al., 1995). Techniques, such as external controls on nutrient input and in-lake
controls, such as drawdown to control macrophytes, were implemented without the benefit of a
complete prerestoration diagnosis/evaluation. Improvement in water quality or an acceptable control
of macrophytes did not occur because certain factors/conditions were not considered fully, such
as: (1) the relative unimportance of external nutrient sources, compared to internal sources, (2) the
uncertainty of drawdown as a macrophyte control under the particular climatic conditions (e.g.,
Long Lake, Washington, Chapter 13), or (3) the “natural” condition of other lakes in the region,
i.e., unreasonable expectations (Peterson et al., 1999). In other instances, in-lake nutrient control
measures were initiated where the major inputs were external and similarly, improvements in water
quality did not result (e.g., Riplox in Long Lake, Minnesota, Chapter 8).
Lake and reservoir restoration has progressed markedly in its relatively short history, but a
proven “track record” for some techniques is lacking. Thus, there is still uncertainty in estimating
cost effectiveness of some techniques. For that reason, a thorough prerestoration diagnosis/evalu-
ation is an absolute requirement, not only for the increased assurance of success, but also to
contribute new knowledge that benefits future projects.
3.2 DIAGNOSIS/FEASIBILITY STUDIES
3.2.1 W
ATERSHED
Lake and reservoir quality, or trophic state, is a direct result of their location within the landscape
and nutrients and sediment that enter them from their watersheds. Thus, a thorough understanding
of the watershed’s characteristics (soils, slope, vegetation, tributaries, wetlands, unique non-point
nutrient sources, etc.) is necessary to explain the condition of the lake/reservoir. Where the lake
fits within the population of lakes in the region is also important (Peterson et al., 1999; Heiskary
and Wilson, 1989; Chapter 2). For many areas, some of these characteristics can be determined
using geographical information systems (GIS).
Copyright © 2005 by Taylor & Francis
Initially, detailed maps must be obtained. Tributaries and wells for surface and groundwater
(GW) nutrient content and flow determinations must be located. These are usually indicated on
U.S. Geological Survey quadrangle maps. These maps also have contour lines so watershed bound-
aries for the main basin, as well as sub-basins, can be drawn. While these maps are usually complete,
they probably do not include stormwater pipes if the lake is in a developing urban area. Hydrologic
changes may have occurred since the map was drawn, so ground reconnaissance is absolutely
necessary. For example, 45 inflow sources were identified for 2000 ha Lake Sammamish in 1971, and
most were stormwater pipes not on the quadrangle map. From that information, 13 minor tributaries
were selected, along with the major inflow that contributed 70% of the water, to construct water
and nutrient budgets (Moon, 1973; Welch et al., 1980). Location and sampling of inputs becomes
an increasing problem as lake size increases.
Watershed area, lake area and lake volume are often known, but if not, must be determined
from maps. Sub-watershed (sub-basins) delineation may be important if development varies from
one part of the watershed to another. Nutrient yield coefficients (mg/m2 per yr) vary with the
density of development, and therefore, are of value in developing control strategies. Sub-basins can
be further subdivided into land use types, such as forest, agricultural and urban (commercial and
single family) for purposes of proportioning sub-basin nutrient loading to land use.
Lake depth contours are necessary to calculate lake volume and for locating water/sediment
sampling sites. If existing contour maps are old, new soundings may be necessary, especially for
reservoirs with large inflows from erosive watersheds. Soundings should be made with electronic
methods to improve accuracy if soft (high water content) sediments are present. Depth–area (or
depth–volume) hypsographic curves should be constructed to illustrate the lake’s morphometry
(Figure 2.4).
Construction of an accurate water budget is the first step in diagnosing a lake’s problem(s),
because the substances that determine quality, or trophic state, originally are transported by water
from the watershed. Major tributaries can be selected from a reconnaissance survey of water
discharges. Continuous gauge recording is recommended to determine flow in major tributaries,
because high flows are the most important segment of the water budget and large volume influxes
are accompanied by high substance concentrations, especially in urban areas. From subsequent
continuous records of flow in the major tributaries and the outflow(s), an annual water budget is
constructed so that measured/estimated inflows equal outflows with correction for lake storage.
The water budget formulation is:
SF
i
+ GW + DP + WW = SF
o
+ EVP + EXF + WS ± ΔSTOR (3.1)
SF
i
is stream flow in and out, GW is groundwater in (includes deep and subsurface seepage), DP
is direct precipitation on the lake surface, WW is wastewater, if any, EVP is evaporation, EXF is
exfiltration, WS is removal for water supply, if any, and ΔSTOR is change in lake volume. There
may be other sources/losses than those designated above. Winter (1981) has described the methods,
uncertainties, and problems in estimating a lake’s water budget. A brief description of procedures
to determine the values for Equation 3.1 follows.
Stream flow (SF) is estimated by taking velocity measurements over a known cross section of
stream. SF, or discharge, is:
SF (m
3
/s) = velocity (m/s) × cross-sectional area (m
2
) (3.2)
A staff gauge may be installed and calibrated over the full range of measured discharge rates, so
that observations of water level are used to estimate discharge from a regression equation. Discrete
observations are inadequate if discharge is so variable that high rates are missed if observations
are made weekly, twice monthly, etc. The greatest accuracy in annual stream flow estimates is by
Copyright © 2005 by Taylor & Francis
automatic continuous discharge with a stage-height recorder. Estimates of SF
i
from discrete dis-
charge measurements and calculated values from runoff maps and precipitation-evaporation records
had errors ranging from 12% to 36% compared with those from continuous gauge-height records
(Scheider et al., 1979; Table 3.1).
If the project cannot afford continuous gauge-height recording, an alternative, capable of
intermediate accuracy, is as follows. SF
i
is separated into base flow and storm flow, with the former
being estimated from discrete observations and the latter from continuous (manual) observations
during several storm events during the year. Discharge during other storm events is estimated by
a relationship with precipitation, which is not always satisfactory due to varying antecedent dry
periods, or with a continuous flow record from a nearby stream (e.g., one equipped with a USGS
station). Runoff can also be estimated using contour maps developed with existing runoff data
for broad regions (Rochelle et al., 1989).
Outlet SF
o
is typically less complicated than inflows, because there is usually one outlet stream
and the lake dampens flow variation. In reservoirs, overflow from a uniform spillway may simplify
measurement procedures. For many reservoirs, records of continuous outflows are available.
Precipitation directly on the lake surface (DP) is determined with a collector installed preferably
at the lake and on the water rather than the shore. A constantly open collector is recommended so
that dry fall, as well as precipitation, is obtained. Events should be collected separately, as with
stormwater, due to the variability from one event to another. Several collectors may be needed at
a large lake or reservoir. The relative importance of precipitation in the total budget increases as
the ratio of total watershed area to lake area decreases. For example, for Ontario lakes, precipitation
amounted to only 3% of the total phosphorus (TP) load for a watershed to lake area ratio of 100:1,
9% for a ratio of 30:1, and 23% for a ratio of 10:1 (Rigler, 1974).
Wastewater (WW) contributions are determined in the same way as SF, but are usually more
constant so discrete observations may be adequate. Those data are usually collected as part of
plant operations. Urban stormwater (and agricultural) runoff may contain suspended solids and
nutrient concentrations nearly as high as wastewater. In some instances, estimations from paved
areas based on precipitation may be adequate (Arnell, 1982; Brater and Sherrill, 1975).
Groundwater may be an important component and comprise 50% or more of the total influx.
Some lakes receive very little GW. However, this cannot be assumed. GW is by far the most difficult
influx to estimate (Winter, 1978, 1980, 1981). The most common, but usually least adequate method
to estimate GW is to treat it as the residual term in Equation 3.2. The accuracy of this approach
depends on the accuracy of all the other terms in the equation. La Baugh and Winter (1984) found
TABLE 3.1
Comparison of Hydraulic Input as Calculated by Five Commonly Used Methods (Seven
Streams on Harp Lake, Ontario, January–December 1977)
Data Stream Discharge Calculation Method
Mean Absolute
% Error
Range in
% Error
Discharge calculated from contin.
stage records
Integration of continuous discharge vs. time
plot
00
Integration of discrete discharge vs. time plot 12 –19 to + 35
Discharge measured at discrete
time intervals
Three-point running mean of discrete
discharge
35 –15 to + 130
No measured discharge Long-term unit runoff (Pentland, 1968) 18 –2 to + 68
Precipitation-evapotranspiration (Morton,
1976)
36 +12 to + 91
Source: From Scheider W.A. et al., 1979. Lake Restoration. USEPA 440/5-79-001. p. 77.
Copyright © 2005 by Taylor & Francis
that the residual term was of the same magnitude as the measurement errors of the other terms in
the water budget for a Colorado reservoir.
A direct method for groundwater estimation is to calculate it in a flow net using the following
equation:
Q = KIA (3.3)
Q is groundwater discharge, K is hydraulic conductivity, I is hydraulic gradient, and A is cross-
sectional area through which flow occurs. This procedure requires establishing nests of piezometers
to determine the hydraulic gradient of the water table (and substance concentration), measuring
hydraulic conductance through pump tests, and establishing hydrogeologic boundaries for flow.
Another direct method is the use of seepage meters (Lee, 1977; Lee and Hynes, 1978; Barwell
and Lee, 1981). These are constructed of plastic barrel halves, inverted over the lake bottom so
that GW flows into an attached collecting bag, the contents of which represent the total net flow
per unit barrel area over the collection time. An adequate sampling design is necessary with this
method, because they measure flow at a discrete site and flow can vary greatly among sites.
Also, the need for SCUBA gear to sample the barrels limits their use to ice-free periods in
northern latitudes. Although they have proven to be a convenient and useful tool for detecting
the direction and quantity of GW flow, they are not as reliable in determining nutrient transport
via GW. Enclosure of the surficial sediments within the meter promotes anaerobic conditions.
Hence, determination of nutrient content in that water can lead to substantial overestimates in
transport rates (Belanger and Mikutel, 1985). To characterize the GW quality entering a lake,
Mitchell et al. (1989) have demonstrated the usefulness of a modified hydraulic potentiomanom-
eter to sample interstitial pore water in the littoral. Also, to obtain accurate estimates of water
input, the seepage meter bags should be partially pre-filled to prevent an anomaly of an excessive
initial influx (Shaw and Prepas, 1989).
Evaporation (EVP) is a water-loss term estimated by several methods, all with potentially
significant errors. EVP pan is the most common method, but no standard pan technique exists, and
there are problems in extrapolation from the pan to the lake. Pan EVP rates are often obtained from
the nearest National Weather Service station and multiplied by 0.7 to estimate lake EVP, based on
a class A pan. However, this coefficient is based on annual averages and will be incorrectly applied
if used for monthly values (Siegel and Winter, 1980).
Finally, the lake level, or storage (volume) term, is determined from a gauge-height recorder
or discrete observations of a staff gauge. Records of level are often available for reservoirs. Errors
in lake level measurement are largely attributable to lake area and volume estimates, and to seiches
in large lakes and reservoirs. Exfiltration (EXF) is very difficult to determine and is usually assumed
to be nil. Some indication of EXF may be obtained by observing changes in storage during periods
of low GW influx.
The nutrient budget is constructed by multiplying each term (except EVP) in the water budget
by a representative concentration. While concentrations tend to be less variable than flow, frequent
observations are nonetheless desirable. A suggested minimum frequency is twice monthly. Scheider
et al. (1979) used discrete observations of TP concentration and continuous SF as the absolute
estimate in comparing eight methods of computing TP loading (Table 3.2). Estimates of inputs
from urban (and rural agricultural) stormwater runoff, where TP concentration is normally high
at the beginning of a storm event, and declines as the storm continues, may require far more
frequent observations of concentration during storms or, preferably, the use of flow-activated
automatic sampling.
Concentrations in GW, DP, and WW are less variable and usually need not be observed so
frequently. Direct precipitation can often represent a substantial fraction and affect the in-lake N:P
ratio, especially for oligotrophic lakes (Jassby et al., 1994).
Copyright © 2005 by Taylor & Francis
A minimum of bi-monthly computations of the TP budget is recommended in order to determine
the among- and within-seasonal variation in sources and sinks. The mass balance, in units of
kilograms per whole lake or milligrams per square meter of lake area, is as follows:
ΔTP
l
= TP
in
− TP
out
− TP
sed
(3.4)
where TP
l
is whole-lake content, TP
in
is all external inputs. TP
out
is the output and TP
sed
is
sedimentation in the lake. Internal loading of P from anoxic (or oxic) sediment release or decom-
position of macrophytes can be estimated by solving for TP
sed
in Equation 3.4:
TP
sed
= TP
in
− TP
out
− ΔTP
l
(3.5)
where a negative TP
sed
indicates that TP
out
and/or ΔTP
l
exceeds the external input of TP
in
and, thus,
there is net internal loading. That is, the gross rate of sediment release exceeds the gross rate of
sedimentation. The gross rate of sediment release may be estimated by independent measurements
in cores in the laboratory or by estimation of the gross sedimentation rate by means of sediment
traps in the lake (if not too shallow). The gross release rate may be estimated by calibration of a
mass balance model as will be described later. If TP
sed
is positive, gross sedimentation exceeds
gross release, which is the case on a long-term basis in all lakes. However, during short-term periods
of anoxia, high temperature, or wind action, or for several years following reduction of external
TABLE 3.2
Comparison of Phosphorus Input Calculation by Nine Commonly Used Methods (Seven
Streams on Harp Lake, Ontario, January–December 1977)
Data Phosphorus Input Calculation Method
Mean Absolute
% Error
Range in
% Error
Discharge calculated from
continuous stage records; [P]
measured at discrete time intervals
1. Product of integrated discharge vs. time
plot and [P] at midpoint of time interval
00
2. Product of integrated discharge vs. time
plot and mean of [P ] at end point of time
interval
3–4 to + 5
3. Product of integrated discharge vs. time
plot and mean of [P] at midpoint of time
intervals
11 –19 to + 11
4. Product of integrated discharge vs. time
plot and [P] at endpoints of time interval
14 –25 to + 16
5. Product of discharge as calculated by three-
point running mean and [P] at midpoint of
time interval
30 –19 to + 92
Discharge and [P] measured at
discrete time intervals
6. Integration of the plot of the product of
discharge and [P] vs. time
10 –19 to + 8
7. Three-point running mean of product of
discharge and [P]
27 –14 to + 57
8. Product of total monthly discharge
(Pentland, 1968) and [P]
49 –4 to + 85
No measured discharge and [P]
measured monthly
9. Product of total monthly discharge
(precipitation-evapotranspiration) and [P]
71 –19 to + 111
Source: From Scheider, W.A. et al. 1979. Lake Restoration. USEPA 440/5-79-001. p. 77.
Copyright © 2005 by Taylor & Francis
inputs, net internal loading can be highly significant. Estimation of net internal loading on an annual
basis will underestimate its importance, because algal problems occur in summer when internal
loading may be the largest P source (Welch and Jacoby, 2001). Restoration attempts by controlling
external inputs have often been unsuccessful, or unexpected, because internal sources were either
underestimated or not estimated at all.
Sedimentation rates from traps agreed with TP retention on an annual basis in Eau Galle
Reservoir, Wisconsin, but exceeded retention during summer indicating additional internal P sources
(James and Barko, 1997). Trap data were helpful in estimating a settling rate for a TP model for
Lake Sammamish, Washington (Perkins et al., 1997).
External nutrient loading may also be estimated indirectly using published yield (or export)
coefficients, preferably calibrated to local conditions. The procedure was originally developed to
estimate the capacity of a lake to accommodate development of summer homes around its shore
(Dillon and Rigler, 1975). The approach allows a consultant or lake manager to estimate the current
mean lake TP concentration and compare it to a predicted post-development concentration of TP,
transparency, and algal biomass. Lake TP concentration is obtained by summing the yields from
the land-use areas (urban, agricultural and forest), including that from precipitation and from cultural
sources, such as septic tank drain fields. Water flow is estimated from runoff maps and lake volume
and area from topographic maps or direct measurement.
The potential for large errors with this approach is great. A procedure for estimating uncertainty
for each separate estimate of TP yield, as well as providing improved yield coefficients, was
described by Reckhow and Simpson (1980). Also, a method of error analysis appropriate when
prediction of a new steady state TP concentration is desired for a change in land use was developed
(Reckhow, 1983). Existing lake quality data are used, eliminating the need to project all land-use
impacts. Suggested ranges in TP yield coefficients are shown in Table 3.3.
Rast and Lee (1978) also developed TP yield coefficients for three land-use types (wetlands
were assumed to have no net yield) plus precipitation, based on data from 473 sub-drainage areas
in the eastern U.S. (USEPA, 1974) and data from Uttormark et al. (1974) and Sonzogni and Lee
(1974). These coefficients are single values and fall toward the lower end of the ranges shown in
Table 3.3 (Table 3.4), which may be reasonable since data of this type tend to be log normally
distributed. Rast and Lee (1978) considered that the coefficients in Table 3.4 would approximate
the true load from a watershed by ± 100%. There was good agreement between the loading computed
from their export coefficients and the loading rate empirically determined for 38 U.S. water bodies.
Estimated N and P export coefficients exist for Wisconsin lakes (Clesceri et al., 1986; Omernik,
1977), Lake Mendota, Wisconsin (Soranno et al., 1996); Lake Okeechobee, Florida (Fluck et al.,
1992) and for Canadian Shield lakes (Nürnberg and LaZerte, 2004). The latter were used in a
modeling approach that predicted the effect of development on internal as well as external TP loading.
TABLE 3.3
Watershed TP Yield Coefficients
Land Use Yield Coefficient (mg/m
2
per yr)
Forest 2–45
Precipitation 15–60
Agriculture 10–300
Urban 50–500
Septic-tank drain fields 0.3–1.8 kg/cap per yr
Source: From Reckhow, K.H. and S.C. Chapra. 1983. Engineering
Approaches for Lake Management: Vol. I. Data Analysis and
Empirical Modeling. Butterworths, Boston, MA. With permission.
Copyright © 2005 by Taylor & Francis
Yield coefficients can provide a reasonable estimate of TP (and N; Rast and Lee, 1978) loading
to a lake, and at relatively low cost. However, the degree of uncertainty should be computed, and
field verification would reduce that uncertainty. To use this indirect method of loading estimation
to predict effects of increased development, an annual water budget must be available, and one
preferably determined directly. However, the only estimate possible using coefficients is for an
annual loading, which is not as useful for estimating internal loading as a seasonal budget analysis.
Yield coefficients may have their greatest value in estimating lake quality changes from planned
development near water bodies with complete water and nutrient budgets that were determined
directly. Although direct measurement of sub-basin loading is most reliable, it gives no information
on the distribution of that loading among land-use types. Thus, by using the ratios among yields
in Tables 3.3 or 3.4, together with information on the areas devoted to the respective land uses in
each sub-basin, the known load can be partitioned among land uses. In that way, the effect of future
changes in land use can be more reliably determined for a particular lake (Shuster et al., 1986).
Yield coefficients were calibrated to local conditions to develop estimates of loading for a set of
Massachusetts lakes (Matson and Isaac, 1999). A significant forecasting problem using yield
coefficients is the uncertainty due to changing SF
i
. Because future loading is estimated from
calibrated yield coefficients, they would not include the effect of changing SF
i
. When estimated
loads are superimposed on a range of SF
i
possibilities, lower inflow TP concentrations result from
high flow and higher concentrations, the opposite of that expected in urbanizing watersheds.
Normally, increased runoff in urbanized watersheds produces higher TP concentrations. Therefore,
some adjustment is necessary.
3.2.2 IN-LAKE
The data needs for a lake or reservoir are more varied than those from the watershed (nutrients,
solids and water flow). In-lake data are used to describe a lake’s trophic state (quality), help
understand why that trophic state exists (Peterson et al., 1995, 1999), and provide clues as to its
restoration potential. The data needed include physical, chemical, and biological variables.
Temperature profiles determine the extent of thermal (density) stratification and mixing, which
are important to understanding the distribution of chemical/biological characteristics. Temperature
should be determined at 1 m intervals with depth, at a minimum (Figure 3.1). Usually, one profile
at the deepest point is adequate if the water body is relatively small, but more sites may be necessary
if the water body is large and there are multiple basins or embayments, such as in reservoirs, where
wind and flushing can produce differing effects on water column stability. Wind speed and direction
may be useful for explaining the seasonal (and diurnal) variability in chemical/biological charac-
teristics. Seasonal changes in water column stability are especially important in shallow polymictic
TABLE 3.4
Watershed TP Yield Coefficients
Land Use Yield Coefficient (mg/m
2
per yr)
Forest 10
Precipitation 20
Agriculture/rural 50
Urban 100
Dry fall 80
Source: From Rast, W. and G.F. Lee. 1978. Summary anal-
ysis of the North American (U.S. Portion) OECD eutrophi-
cation project: nutrient loading-lake response relationships
and trophic state. USEPA 600/3-78-008.
Copyright © 2005 by Taylor & Francis
lakes (Jones and Welch, 1990). Temperature (density) profiles help determine if density interflows
are important and several profiles distributed longitudinally along the reservoir may be necessary
for that purpose. Inflows to reservoirs often dive to some intermediate depth, due to density
differences, and that may result in incoming nutrients being unavailable to phytoplankton in the
photic zone. Some more complicated hydrodynamic modeling approach, other than a completely
mixed assumption, may be needed.
Water transparency, determined with a Secchi disc, is one of the most reliable, frequently used,
and meaningful indicators of lake quality. The depth of transparency is the path length in the Beer’s
law equation through which light is scattered and absorbed as a function of particle concentration
in the water. As the concentration increases, transparency depth decreases exponentially. However,
transparency is usually related to particle concentration, whether those particles are algae or other
suspended solids. The measurement is easy and is used by lakeshore residents to monitor lake
quality. There may be more horizontal variability in transparency than with temperature, especially
if buoyant blue-green algae are abundant in the lake and are distributed unevenly by the wind.
Measurements at more than one site, even in small lakes, are recommended. Plot transparency
against time for each sampling site.
Suspended solids (TSS) determined by gravimetric analysis may be useful, especially in highly-
flushed reservoirs in watersheds subject to erosion. Turbidity, determined by light scattering
(nephelometry), is an indirect measure of suspended solids and may be useful information. If there
is a sizable influx of solids to the lake/reservoir, a horizontal gradient in concentration can be
expected as water velocity decreases upon entry to the water body and deposition occurs. These
variables are not as useful to indicate trophic state as is transparency.
The chemical variables that should be determined are nutrients (TP and total nitrogen [TN]
and the soluble fractions NO
3
, NH
4
and SRP), pH, dissolved oxygen (DO), total dissolved solids
(specific conductance) and ANC (acid neutralizing capacity or alkalinity). Biochemical oxygen
demand (BOD) may be useful when assessing DO demands and sources. Nutrients, pH, and
dissolved solids should be determined at several depths at the deep-water site, at least three depths
in the epilimnion and three in the hypolimnion. Fewer sampling depths are needed when the water
column is completely mixed. Surface samples may be sufficient in shallow lakes (Brown et al.,
1999). The purpose here is to insure that respective water layers are adequately represented for
computing whole-lake mean concentrations. To check for variation in horizontal distribution,
integrated (tube) samples could be collected at other sites. Again, if the lake/reservoir has multiple
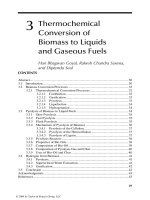
FIGURE 3.1 Distribution of temperature (solid line) and dissolved oxygen (dotted line) during summer
thermal stratification of a eutrophic lake. (From Cooke, G.D., E.B. Welch, S.A. Petersen, and P.R. Newroth.
1993. Restoration and Management of Lakes and Reservoirs, 2nd Edition. Lewis Publishers and CRC Press,
Boca Raton, FL.)
°C
5
10
15
20
25
0
mgO
2
I
−1
Surf.
Depth in meters
30252015105
012108642
O
2
°C
Copyright © 2005 by Taylor & Francis
basins/embayments, additional sampling sites may be necessary. Whole-lake mean concentrations
(sum of the products of depth-interval volumes and concentrations) or epilimnetic water column
means are useful for assessing long-term change and the nutrient budget and models. Profile plots
of TP, SRP, DO, and temperature for several dates in the summer may also be instructive to illustrate
the effects of stratification and DO depletion on sediment P release. Volume weighted hypolimnetic
TP plotted against time can be used to calculate a release rate from sediments.
DO and temperature should be determined at 1 m intervals, sampling as close to the bottom
as possible to detect DO depletion at the sediment/water interface, especially in shallow, unstratified
lakes. DO sensors are easy to use and can be located at discrete depths, as opposed to 0.5 m
sampling. DO should be determined by the standard wet chemical method (APHA, 2003) at a
minimum of 10% of the depths sampled, including depths with DO < 1 mg/L, to verify the probe-
determined values. Unreliable values from depth in the water column may occur with sensors that
operated satisfactorily in the laboratory. All sensors, except microelectrode sensors, are unreliable
for DO < 1 mg/L, or for steep gradients, such as the sediment-water interface or at metabolic
boundaries (Wetzel and Likens, 1991). The vertical temperature-DO data should be plotted on a
depth-time graph, with isopleths of values represented rather than a separate graph for each sampling
date, to illustrate periods of stratification and DO loss from the hypolimnion and/or supersaturation
in the lighted zone.
A twice-monthly sampling frequency during May through September and monthly for the
remainder of the year is recommended for temperate waters. Monthly during summer may miss
algal blooms completely and result in underestimated means for trophic state indices. Twice-
monthly sampling is also recommended for nutrient budgets. ANC and BOD need not be sampled
as frequently or at as many sites. ANC does not change appreciably, but is used to calculate CO
2
,
which changes with pH in response to diurnal cycles of photosynthesis/respiration, and alum dose
(Chapter 8). DO is usually correlated with pH and inversely with CO
2
. These variables influence
nutrient cycling and blue-green algal buoyancy (see Chapter 19), which can affect trophic state.
Except in highly enriched lakes, BOD is usually not significant, and oxygen deficit rate (AHOD,
Chapter 18) determinations from hypolimnetic DO data are more relevant.
Sediment cores from the deepest site are useful to determine the chronology of cultural
eutrophication, the character of P (fractions), its release rate in and from the sediments and alum
dose (Chapter 8). Vertical changes in the concentration of stable or radioactive lead are used to
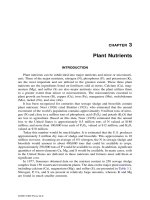
date depths in the core, providing inferences about the history of P and organic loading. Figure 3.2
is an example showing the increase in stable lead at about 20 cm (circa 1930; the start of leaded
gasoline use) and decrease again around 1972 (started unleaded gasoline use). In this case, two
sedimentation rates could be determined. Anomalies, such as the value at 15 cm, often occur. That
value could not be explained and was ignored in estimating sedimentation rates. Chronology may
not always be clear.
The question is often asked, “Is lake quality being restored to an earlier state or has quality
always been poor and is simply being improved?” Historical chronology from core data can answer
that question with evidence on sedimentation rate, productivity, nutrient loading, and plankton
species composition over time. Some of the specific indicators are algal pigments, chiromomid
midge head capsules and P-fraction content (Wetzel, 1983; Welch, 1989). Total chlorophyll, myx-
oxanthophyll (cyanobacteria) and diatom-inferred TP and chl a, showed the chronology of eutroph-
ication of Lake Haines, Florida, with dating by lead-210 (Whitmore and Riedinger-Whitmore,
2004). Pollen analysis is also useful for establishing historical markers, although it does not indicate
lake trophic state.
Cores can be incubated under conditions of constant temperature and oxic or anoxic conditions,
in order to measure P release rates. These may be comparable to those occurring in the lake. Cores
can also be sectioned and P fractions determined, such as loosely bound P, iron-bound P, aluminum-
bound P, and organic P, which may give insight into the process of P cycling from sediments and
prospects for restoration (Boström et al., 1982; Psenner et al., 1988). Sediment release rates deter-
Copyright © 2005 by Taylor & Francis
mined in the laboratory can be used, in conjunction with observed rates of hypolimnetic P increase,
to characterize internal loading for constructing P budgets or calibrate mass balance models.
The usual biological variables are phytoplankton, zooplankton, macrophytes, if present, and
benthic invertebrates and fish in certain circumstances. Water samples for phytoplankton analysis
should be collected from two to three depths in the epilimnion and preserved with Lugol’s solution.
Samples from the metalimnion and even hypolimnion may show separate populations from those
in the epilimnion and that possibility should be examined. Phytoplankton can be simply counted
or their taxa biovolumes determined. Taxonomic separation can be by species or genera, with the
latter being adequate for separation of biovolumes into diatoms, greens, and blue-greens and/or
determining diversity.
Chl a is a conventional method to estimate phytoplankton biomass and is used more often than
biovolume to indicate trophic state. It is a reliable indicator despite its dependence (per unit cell)
on nutrient status, light, and species composition. Cell chl content can vary by a factor of two or
more with the above variables. Again, some sampling time and site combination of data plotted
against time is an appropriate display. An illustration of when, where, and how much blue-green
algae is often useful.
Zooplankton can be sampled from discrete depths by filtering water bottle (e.g., Van Dorn type)
collections through appropriate size nets, by vertical net hauls through all or part (closing net) of
the water column, or by horizontal tows at particular depth intervals with a Clarke–Bumpus sampler.
The Schindler–Patalas trap technique is also useful. Taxonomic separations can be crude (cladocer-
ans, copepods, etc.) or by species or genera, although at least genera is desirable. A useful separation
for display may be the abundance (No./m
3
) of large daphnids, which are the important grazers, vs.
the smaller forms.
Macrophyte distribution can be determined by several methods ranging from satellite imagery
to depth-interval, stratified, random design sampling for biomass (g dry weight/m
2
). The latter is
most desirable to determine whole-lake and species-specific biomass, but is also most expensive
and time consuming. Plants for areal dry weight can be conveniently collected by SCUBA using
a device to delimit a unit area. Sample size can be determined from known measures of plant-
species variability within each depth interval. Samples can also be collected using SCUBA, with
sites spaced randomly along shore-to-depth transects or by less quantitative means along such
FIGURE 3.2 Content of stable lead in two cores from the deep station (15.5 m) in Silver Lake, Washington.
(From Cooke, G.D., E.B. Welch, S.A. Petersen, and P.R. Newroth. 1993. Restoration and Management of
Lakes and Reservoirs, 2nd Edition. Lewis Publishers and CRC Press, Boca Raton, FL.)
600500400300
Lead (PPM)
2001000
−5
−10
−15
−20
−25
−30
−35
−40
−45
−50
0
Depth (cm)
Core C
Core B
Copyright © 2005 by Taylor & Francis
transects. One sample collection per year may be all that is necessary to characterize the macrophyte
crop. The annual mean biomass in each plant zone (emergent, floating-leaved and submersed) can
be predicted from a measure of the maximum biomass in each zone, determined once per year by
one of the above sample collection techniques (Canfield et al., 1990). A map showing abundance
in relation to lake depth, as well as depth of visibility, is a useful method for illustration. Floristic
quality of macrophyte communities was related to ecoregional and lake-type differences (Nichols,
1999). Satellite imagery may be more cost effective for monitoring long-term trends, but is generally
inadequate for assessing specific biomass levels that can be used in nutrient budget computations.
This discussion of sampling, analytical techniques, and data display is rather superficial and
the reader is referred to Wetzel and Likens (1991), Standard Methods (APHA, 2003), Golterman
(1969), Edmondson and Winberg (1971) and Vollenweider (1969a).
3.2.3 DATA EVALUATION
Lake assessment for management usually requires a model that adequately predicts P in the
lake/reservoir in question. Mass balance models for P are based on the kinetics of continuously
stirred tank reactors (CSTR), which are commonly used in chemical engineering (Reckhow and
Chapra, 1983). By continuously mixing the volume in such a reactor, holding that volume constant,
and maintaining the water inflow rate equal to the water outflow rate, the following mass balance
equation applies with units of mass/time:
dCV/dt = C
i
Q − CQ + KCV (3.6)
where C is the concentration of a substance in the reactor and C
i
is concentration in the inflow, Q
is flow rate, V is reactor volume, and K is the reaction rate coefficient. If K is assumed to represent
a first order depletion reaction (rate of decrease dependent on concentration) and both sides are
divided by V, so that Q/V = ρ (the flushing rate in 1/t), the equation becomes
(3.7)
At steady state, the equation becomes
(3.8)
That is essentially the same as the TP mass balance proposed by Vollenweider (1969b) for lakes:
(3.9)
where L is TP areal loading in mg/m
2
per yr = ρC
i
in 3.7, 3.8), z is mean depth (m), ρ is
flushing rate (1/yr), and σ is the sedimentation rate coefficient (1/yr). The steady state equation is
(3.10)
which is equivalent to Equation 3.8 because
d
d
i
C
t
CCKC=−−ρρ
C
C
K
C
K
ii
=
+
=
+1/ρ
ρ
ρ
dTP
d
TP TP
t
L
z
=− −ρσ
(/Lz
TP
()
=
+
L
z ρσ
Lz
i
/.=ρTP
Copyright © 2005 by Taylor & Francis
According to Equation 3.9, each new concentration of TP entering the lake is immediately
mixed throughout the lake producing a new concentration after a fraction leaves through the outlet
and a fraction sediments to the lake bottom, both of which are a function of the new, slightly
changed concentration. According to Equation 3.10, over the long term, the lake will equilibrate
to the given loading. If the loading is changed then some time interval will be required for
equilibration to the new loading. Assuming a first order rate reaction, the time interval to 50%
(100/50) and 90% (100/10) of equilibrium will be, respectively:
(3.11)
The principal limitation with these models is determining the sedimentation rate coefficient.
All other variables can be determined directly. Thus, for a lake with known loading, mean annual
TP concentration, and flushing rate, σ could be estimated from Equation 3.10 according to:
(3.12)
However, to develop a model to describe a large number of lakes, it is useful to have some
general way to estimate sedimentation. One approach is to use a unitless retention coefficient RTP
(Vollenweider and Dillon, 1974; Dillon and Rigler, 1974a), which can be derived from Equation
3.10 by multiplying the numerator and denominator by ρ (Ahlgren et al., 1988):
(3.13)
where is the inflow concentration and is a dimensionless reduction term equal to
1 − R
TP
, the retention coefficient for TP. Thus:
(3.14)
There is still the difficulty with estimating σ, but Vollenweider (1976) found that σ could be
approximated by , where 10 has the dimensions of m/yr and is considered to be an apparent
settling velocity for TP. If the numerator and denominator in Equation 3.13 are multiplied by
and substituting for σ, it becomes:
(3.15)
The surface hydraulic loading, in m/yr, is designated as q
s
in many formulations, and the
retention coefficient is described as
t
t
50
90
2
10
=
+
=
+
ln
ln
ρσ
ρσ
σρ=−
L
zTP
TP *=
+
L
zρ
ρ
ρσ
Lz/ρρρσ/( )+
R
TP
=−
+
=
+
1
ρ
ρσ
σ
σρ
10/ z
z
10/ z
R
z
TP
=
+
10
10ρ
ρz
Copyright © 2005 by Taylor & Francis
(3.16)
where v is the settling velocity. Several estimates of v exist in the literature, e.g., 16 m/yr from
Chapra (1975) and see Nürnberg (1984) for others.
R
TP
can also be determined directly for an individual lake according to
(3.17)
where TP
i
is inflow concentration and TP is the lake concentration if assumed to equal the outflow
concentration. From Equations 3.13 and 3.14 it is clear that (see Vollenweider and Dillon, 1974):
(3.18)
R
TP
has been related to hydraulic variables in several empirical formulations, one of which
is (Larsen and Mercier, 1976; Vollenweider, 1976). With this and other such relation-
ships (Equation 3.16), R
TP
decreases as flushing rate increases. A R
TP
–flushing rate relation may
be relatively constant with loading change (Edmondson and Lehman, 1981), or vary with loading
(Kennedy, 1999). There are several forms of the steady state Equation 3.10 that are based on this
dependence of retained TP on flushing rate. Using for simplicity, three such equations,
in sequence, are
(3.19)
The negative relation between flushing rate and R
TP
is logical. That is, as flushing rate increases
there is less time for TP to settle, so R
TP
decreases accordingly. Seemingly in contrast, the sedimentation
rate coefficient is positively related to the flushing rate (σ = ρ0.5). However, to calculate actual sedi-
mentation, which is flux rate to the sediment, R
TP
must be multiplied by L, while σ must be multiplied
by lake TP. Therefore, it is readily apparent that if L is held constant, increasing the flushing rate will
give increasingly smaller TP
i
. As a result, σ must increase in order that the flux rate to the sediments
does not decrease too rapidly. Ahlgren et al. (1988) modified the relationship found by Canfield and
Bachmann (1981) that shows such a relationship between σ and both flushing rate and TP
i
:
(3.20)
The steady state mass balance model illustrated by Equation 3.18 has been verified for a large
population of lakes (Chapra and Reckhow, 1979). This suggests that the general form of the
sedimentation term is reasonable, although the error for predicting the TP content in any given lake
may be quite large (about ± 50 μg/L).
If internal loading is important, as may be the case in either oxic or anoxic lakes, then the
model may need to be modified to account for the two sources. Nürnberg (1984) formulated the
following model to account for internal load (L
int
):
R
v
qv
TP
s
=
+
R
i
TP
TP
TP
=−1
TP
()
TP
=
−LR
z
1
ρ
11
05
/( )
.
+ρ
TP /
i
= Lzρ
TP TP ( )
TP
()
iTP
.
.
=−=
+
=
+
1
1
1
05
05
R
L
z
i
ρ
ρρ
σρ= 0 129
0 549
.(TP)
i
.
Copyright © 2005 by Taylor & Francis
(3.21)
where R
pred
in 54 oxic lakes was best represented by:
(3.22)
Internal loading can also be added to Equations 3.18 and 3.19. However, there was no attempt to
separately treat oxic and anoxic lakes in the development of those models.
Solving Equation 3.21 for L
int
, using observed TP, allows calibration of Nürnberg’s model for
a particular stratified, anoxic lake. L
int
can then be compared with other estimates of internal loading
for the lake/reservoir in question, such as sediment P release rates determined from cores incubated
in the laboratory or by the observed rate of increase in hypolimnetic P concentrations. These two
methods of estimating internal loading in anoxic lakes have shown rather good agreement (Nürn-
berg, 1987). Sediment release rate in anoxic cores also has been directly related to iron-bound P
(BD-P) in sediment (Nürnberg, 1988). Lake-wide internal loading can be estimated as the product
of anoxic release rate and anoxic factor (Nürnberg and LaZerte, 2004). Such good agreement among
these different estimates of internal loading for a particular lake indicates that the model is verified
for that lake. If the agreement is poor, then an error in the estimate for sedimentation may exist
and a different modeling approach must be taken. Agreement may be poor if the lake is not in
equilibrium with its external loading.
Even if verification of a particular steady state model is satisfactory, problems are encountered
using the steady state version. First, an appropriate time interval (most often annual), when the
lake mean TP represents a steady state, is often difficult to determine, especially if flushing rate is
much greater than 1/yr. Second, internal loading usually occurs during the summer and may
contribute proportionately more to growing season TP and biomass than external loading, especially
if the lake is unstratified and external loading occurs primarily during the non productive period
(e.g., winter in the Pacific Northwest). These problems may be averted by calibrating and verifying
a transient version of Equation 3.9 including L
int
:
(3.23)
Because sedimentation is a function of TP concentration resulting from both L
ext
and L
int
at
each time step in Equation 3.23, L
int
is a gross rate. In this case, the numerator in Equation 3.10
would be L
ext
+ L
int
.
The transient version usually requires no more data, because as recommended above, TP loading
and lake concentration data are collected twice monthly as a minimum. With the steady state
approach, the data are usually reduced to annual means (or some interval consistent with ρ), whereas
TP is computed for each time interval with the transient version. Weekly time steps are preferred
in the modeling process to obtain a more realistically smooth curve even if less frequent data were
available. The model can be calibrated by determining the sedimentation rate coefficient (σ) that
gives the best fit between predicted and observed TP for the oxic period. Larsen et al. (1979) used
a constant σ among years in Shagawa Lake, Minnesota with good success. However, the model
could be verified year to year in Lake Sammamish, Washington only if σ were allowed to vary as
a function of flushing rate, i.e., σ = ρ
x
, where 0 < x < 1 (Shuster et al., 1986; Welch et al., 1986).
That is analogous to Equation 3.19 where x = 0.5. A formulation such as σ = yρ
x.
where y < 1, may
TP TP ( )
ipred
int
=−+1 R
L
zρ
R
z
pred
=
+
15
18 ρ
dTP
d
TP TP
ext int
t
L
z
L
z
=−−+ρσ
Copyright © 2005 by Taylor & Francis
be necessary if sedimentation rates are low, because as x approaches zero in the previous formu-
lation, the sedimentation rate remains around 1.0 regardless of the flushing rate.
There still may be a problem with using the transient model for stratified lakes even if it can
be verified for whole-lake TP. From predicted TP, chl a and transparency are usually predicted as
biological and physical factors defining trophic state and lake quality, and are a function of TP in
the productive zone (i.e., epilimnion) and not of whole-lake TP. Usually, epilimnetic TP declines
during the stratified period while hypolimnetic TP increases. Thus, either the epilimnion and
hypolimnion must be modeled separately with diffusion between the two strata included to account
for exchange of TP, or mean epilimnetic TP must be estimated from a relationship between that
and whole lake TP. The latter may be satisfactory, because relationships among chl a, TP, and
transparency are usually based on summer means, which are in turn most often used for management
purposes (Shuster et al., 1986).
The use of a two-layer mass balance TP model for stratified lakes is routine. The earlier TP
modeling work for Lake Sammamish described above was considered inadequate to separate the
effects of urban runoff from internal loading. The model of Auer et al. (1997) was developed for
Lake Onondaga and later applied to Lake Sammamish (Perkins et al., 1997). While internal loading
from anoxic sediments represented a substantial fraction of the annual and, especially, summer
total loading, availability of hypolimnetic P via entrainment and diffusion to the epilimnion for
algae production was much less important than external loading. A two-layer model is based on
representing the transfers shown in Figure 3.3. A quantitative estimate of the magnitude of internal
loading availability has become very important in judging the probable cost-effectiveness of in-
lake treatment techniques.
There are qualitative procedures to indicate the importance of internally-loaded P availability
in stratified lakes. The Osgood Index of mixing (OI = mean depth/√km
2
; Osgood, 1988) is a measure
of the lake volume in relation to wind fetch. As the ratio decreases, the chance for mixing
hypolimnetic with epilimnetic water increases. Based on data from 96 lakes in central Minnesota,
those with an OI < 6–7 had summer surface water TP that exceeded the concentration predicted
from external loading. All of these lakes were continuously mixed, polymictic, or weakly stratified
dimictic lakes. Dimictic lakes with OI values > 8 were strongly stratified with summer surface
water TP concentrations that conformed to values predicted from external loading.
This index works in some stratified lakes, but not others. Where wind mixing is effective low
OIs are consistent with significant transport of hypolimnetic P to surface water. Shagawa Lake is
a case in point. The eastern basin (OI = 3.6) is smaller and more wind-sheltered and was shown
to have less vertical transport than the west basin (OI = 2.3 – see Chapter 4; Larsen et al., 1981;
Stauffer and Lee, 1973; Stauffer and Armstrong, 1984). Also, no transport was consistent with a
FIGURE 3.3 TP fluxes in a stratified lake. (From Perkins, W.W. 1995. Lake Sammamish Phosphorus Model.
King County Surface Water Manage., Seattle, WA.)
External
loading
Outflow
Entrainment
Diffusion
Settlement
Internal
loading
Sedimentation
50485SM.FH4
L1625_book.fm Page 61 Tuesday, March 29, 2005 11:16 AM
Copyright © 2005 by Taylor & Francis
high OI (36.7) in Third Sister Lake, Michigan (Lehman and Naumoski, 1986). But in others, the
OI is unreliable. Where wind mixing is less important and diffusion dominates due to a large TP
concentration gradient between hypolimnion and epilimnion, transport of P may be significant in
spite of a high OI (26; Dollar Lake, Mataraza and Cooke, 1998). This is also shown for Lake
McDonald, a similarly small (7.2 ha), relatively deep (7 m mean depth) lake with an OI of 26, the
same as Dollar Lake (2 ha, 3.9 m mean depth). TP at Z
max
reached about 800 μg/L and over 1000
μg/L during the stratified period in the hypolimnia of McDonald and Dollar, respectively. Surface
TP (0–2 m) increased during the summer in proportion to the increase in hypolimnetic TP (mean
of depths 9 and 13 m) in spite of continued water column thermal stability (Figure 3.4). Surface
chl a also increased from about 6 μg/L in mid June to 32 μg/L in mid August while TP increased
from 12 μg/L to 56 μg/L. Nürnberg (1985) calculated a transport to the epilimnion via eddy diffusion
in Lake Magog (OI = 4.4) equaling 30% of gross internal loading to the hypolimnion and cited
three other examples ranging from 50–100%. In contrast, surface TP in Lakes Sammamish (OI =
3.9) and Onondaga (OI = 3.15) remained rather constant during summer, until fall turnover
approached, despite increasing hypolimnetic TP. These data can be used to indicate the availability
of internal loading and its effect on lake trophic state. Given that hypolimnetic P can be effectively
transported to the epilimnion either by wind mixing in lakes with low OIs or diffusion across large
concentration gradients, internal loading is likely to affect trophic state in most stratified lakes.
This is demonstrated with alum-treated lakes in Chapter 8.
Incorporating internal loading into a two-layer TP model is usually straightforward because
sediment release is typically rather constant during the anoxic period. That is, the increase in
hypolimnetic TP is usually linear with time. Sediment cores incubated under anoxic conditions
have rates comparable to those derived from hypolimnetic TP–time plots (Nürnberg, 1987). How-
ever, Penn et al. (2000) observed seasonal variation in core release in Lake Onondaga. While the
P release rate in stratified lakes may not always be dependent solely on iron redox reactions (Gächter
and Meyer, 1993; Gächter and Müller, 2003; Golterman, 2001; Søndergaard et al., 2002), the pattern
of release is usually consistent from year-to-year and can be reasonably simulated for a given lake.
The iron cycle usually controls sediment P release in stratified anoxic lakes, as indicated by a
strong correlation between sediment P release in anoxic cores and the Fe-P (as BD-P, indicating
the extraction reagent) fraction in sediment (Nürnberg, 1988). Release rates determined by the
increase in hypolimnetic TP have varied some from year-to-year in Lake Sammamish (Figure 3.5),
although the area of anoxia (< 1 mg/L DO) remained relatively constant. Nevertheless, post-
diversion rates were similar for most years allowing the use of an average value for long-term
FIGURE 3.4 Epilimnetic and hypolimnetic TP concentration in McDonald Lake, Washington.
600
500
400
TP ug/L, hypolimnion
TP ug/L, epilimnion
300
200
100
0
6/13
6/20
6/27
7/4
7/11
7/18
7/25
8/1
8/8
8/15
8/22
8/29
9/5
60
50
40
30
20
10
0
Copyright © 2005 by Taylor & Francis
modeling (Perkins et al., 1997). Mechanisms become important, however, when determining the
effectiveness of in-lake controls, especially hypolimnetic aeration (Chapter 18).
Simulating internal loading in shallow polymictic lakes is more difficult than in stratified lakes
because several mechanisms may operate simultaneously and the pattern of sediment P release may
not be similar among years. Moreover, macrophyte senescence and/or anoxic conditions under
macrophyte beds may provide an additional source to the sediment-water exchange processes (Frodge
et al., 1990; Stephen et al. 1997). Macrophytes may also decrease resuspension and thus internal
loading (Welch et al., 1994; Christiansen et al., 1997). However, there is not the issue of P availability
to algae in shallow lakes, because P entering the water column from the sediment is readily available
in the lighted zone. Internal loading in a shallow lake can occur through any or all of the following
processes (Boström et al., 1982; Welch and Cooke, 1995; Søndergaard et al., 1999):
• Photosynthetically caused high pH dissolving Al- and Fe-bound P
• Wind-induced entrainment of soluble P released from anoxic sediment during calm,
temporarily stratified conditions
• Temperature-driven mineralization of organic P by microbial metabolism
• Soluble P release from bacterial cells or via metabolism of organic P excreted from algal
cells in sediment
• Soluble P desorption from wind-caused resuspended particles via high particle-water
concentration gradient enhanced by high pH
• Macrophyte senescence and bioturbation (e.g., benthic fish activity)
Several of these processes may occur simultaneously and their within- and between-year
variations can be great. Much of that variation is due to changing wind speed and its effect on
water-column stability and sediment resuspension. For example, net P internal loading varied from
year-to-year by ± 100% and was strongly related to RTRM (relative thermal resistance to mixing)
over a 12-year period in largely polymictic Moses Lake, Washington (Jones and Welch, 1990).
Wind-caused mixing was a good predictor of resuspension and TP in several, large shallow lakes
(Søndergaard, 1988; Kristensen et al., 1992; Koncsos and Somlyody, 1994). High pH can enhance
desorption of P from resuspended particles (Lijklema, 1980; Koski-Vähälä and Hartikainen, 2001;
FIGURE 3.5 Sediment P release rate (mg/m
2
per day) in Lake Sammamish, Washington. (Data from Perkins,
W.W. 1995. Lake Sammamish Phosphorus Model. King County Surface Water Manage., Seattle, WA.)
25
20
15
10
5
0
Sediment P release rate
2000199519901985198019751970
Years
19651960
Copyright © 2005 by Taylor & Francis
Duras and Hejzlar, 2001; Van Hullebusch et al., 2003). Photosynthetically caused high pH was
apparently the dominating factor resulting in high internal loading in large (270 km
2
), shallow (2
m mean depth) Upper Klamath Lake, Oregon (Figure 3.6). TP was not related to calculated particle
resuspension, possibly due to the dependence of pH on algal biomass (Welch et al., 2004; Kann
and Smith, 1999). Because of the year-to-year variability in timing and magnitude of internal
loading, a time-dependent constant internal loading rate, such as used for Lake Sammamish and
other stratified lakes, could not be used in a non-steady state mass balance TP model for shallow
Upper Klamath Lake.
There are several approaches for dealing with the uncertainty in TP predictions for individual
lakes. For example, in using Equation 3.23 to predict future TP concentrations resulting from
increased development in the Lake Sammamish watershed, uncertainty was included by choosing
a range in land use yield coefficients and the 5 and 95% flow probabilities for the principal inflow
stream (Shuster et al., 1986). TP sedimentation was a function of ρ and increased/decreased flow
resulted in, respectively, dilution/concentration of the estimated TP loading. By this procedure, the
prediction of 31 μg/L TP with future development had a ± 10% error due to land use yield and a
± 20% error due to flow. Most of the year-to-year variation in loading was due to surface inflow.
Another approach is to use first order error analysis to calculate uncertainty in loading and TP
predictions based on low, high, and most likely loading estimates from yield coefficients (Reckhow
and Chapra, 1983). For a model of the type of Equation 3.22, Reckhow and Chapra (1983)
determined an error of ± 30%, which is added to the loading uncertainty. By summing those
uncertainties, confidence intervals for a single model estimate for TP can be calculated. To evaluate
small changes in TP, predicted from relatively small changes in loading, uncertainty can be applied
to the TP concentration change, rather than the before and after concentration as noted earlier.
These mass balance models described above do not predict the long-term response of lake TP
to input reduction (Chapter 4). If the lake has not yet reached equilibrium to the new reduced loading,
they may under-predict lake TP (Havens and James, 1997). Long-term response can be predicted
by including a mass balance on sediment P (Chapra and Canale, 1991; Pollman, personal commu-
nication; Walker, personal communication). However, such predictions have not yet been verified.
FIGURE 3.6 Net internal P loading versus pH in Upper Klamath Lake, Oregon. (From J. Kann, Aquatic
Ecosystem Sci., Ashland, OR 97520, personal communication.)
2500
Internal load ≥ 0
2000
1500
Jun–Sep mean internal loading (kg day
−1
)
1000
8.6 8.7 8.8 8.9 9.0
Jun – Sep mean pH
9.1 9.2 9.3 9.4 9.5 9.6
r
2
= 0.87
P = 0.001
95
97
92
91
93
96
94
98
Copyright © 2005 by Taylor & Francis
Criteria exist to describe the quality and trophic state of a lake. They include the concentration
and loading rate of nutrients, which are the cause, as well as physical and biological indices, which
are the effect, as noted above. Numerical criteria allow precise definition of a lake’s quality or
classification. Criteria are used to accurately chart the course of a lake as it becomes more or less
eutrophic and to judge if the lake is suitable or unsuitable for recreational or water supply use.
The literature is replete with indices to classify trophic state and lake quality. Porcella et al.
(1980) listed 30 different sources for trophic state criteria and there are still others. Also, goals for
lake quality may be in conflict. The aesthetically pleasing, clear, blue water of ultra-oligotrophic
lakes is usually associated with low fish production (but not necessarily small size). Compromises
may be needed between lake quality that is more favorable to fish production (meso, meso-eutrophic,
or even eutrophic) and that preferred for swimming, boating, and aesthetics. However, for cold-
water fish species in lakes with epilimnetic temperature that exceeds preferred levels, there may
be little difference between trophic state criteria appropriate for fisheries and recreational use.
The most commonly determined biological variable to define trophic state and lake quality is
chl a, and several empirical relationships between chl a and TP exist (see Ahlgren et al., 1988;
Downing and McCauley, 1992; Jones et al., 1998; Seip et al., 2000). Probably the two most often
used are by Dillon and Rigler (1974b) and Jones and Bachmann (1976), which, respectively, are
(3.24)
(3.25)
The Dillon and Rigler data set contained TP values from spring turnover and mean summer
chl a while the Jones and Bachmann set was composed of summer means for both variables. The
equations agree rather closely, despite of the difference in data averaging times. Ahlgren et al.
(1988) compared seven different TP–chl a relationships, which yield a wide range in predictions.
Some of the variability in prediction is due to the variation in cellular chl a (0.5–2% of dry weight),
due to such factors as light and nutrition, but also some of the measured TP may not be in cells.
This is an explanation why the ratio of chl a to TP and hence, the slope of the regression line, can
be expected to vary between 1.0 and 0.5. Some relationships had slopes below 0.5, presumably
because measured non-cellular P was high. Zooplankton grazing also reduces the chl a:TP ratio if
large-bodied Daphnia are abundant, and thus improves transparency relative to TP (e.g., Lake
Washington, Chapter 4) (Lathrop et al., 1999).
Because most TP–chl a relationships using large data sets are usually log-log, the accuracy of
prediction for a single lake is not great. With Equation 3.24, for example, a chl a concentration of
5.6 μg/L (10 μg/L TP) has a prediction error of ± 60–170% and 30–40% for 95% and 50%
confidence, respectively. The high correlation coefficients between TP and chl a tend to mask the
accuracy problem, which may be due to lake-to-lake and seasonal variations in cellular chl a,
zooplankton grazing (Chapter 9), and other limiting factors such as light and nitrogen (Ahlgren et
al., 1988; Jones et al., 2003). Developing a relationship for the individual lake of interest that
provides much greater accuracy of prediction is recommended where data are sufficient (Smith and
Shapiro, 1981). However, data may be insufficient for a reliable relationship so a published
relationship that provides the best agreement with the individual lake data would be preferable.
Summer means for chl a and TP are most often used to define lake trophic state, so sampling
intensively throughout the non-growing season to only determine trophic state is unjustified.
Although TP may be higher when inflows are greater during the winter and spring, the summer
mean represents the residual after sedimentation and, therefore, should be most closely related to
P in algal biomass.
The TP–chl a relationship was used by Carlson (1977) to develop a numerical trophic state
index (TSI). This is probably the most commonly used index, which includes three variables: TP,
log chl . log TP .a =−1 449 1 136
log chl . log TP .a =−146 109
Copyright © 2005 by Taylor & Francis
chl a and Secchi transparency. Carlson’s TSI and Porcella’s (1980) LEI (Lake Evaluation Index)
(Porcella et al., 1980) reduce lake trophic state to one or more numbers, in an attempt to remove
the subjectivity inherent in the terms oligotrophic, mesotrophic, and eutrophic. Instead, they empha-
size the degree of eutrophication within each classification. To classify a lake as eutrophic encom-
passes a wide range of lake conditions and just how eutrophic is not specified by the term itself,
although use of those terms in communications about lake quality is still necessary.
Carlson’s TSIs (and LEIs) represent absolute values for chl a, TP, and transparency (SD)
applicable to any lake (with minimal nonalgal turbidity), in contrast to indices for which values
are relative and confined to uses with a particular data set. Transformations of the data to log
2
were
used to interrelate these three indices within a scale of 0 to 100, so that a doubling in TP is related
to a reduction by half in SD. Representative values for TP, chl a, and SD, calculated from the
following equations for TSI are shown in Table 3.5.
TSI = 10(6 – log
2
SD) (3.26)
= 10(6 – log
2
7.7/chl a
0.68
) (3.27)
= 10(6 – log
2
48/TP) (3.28)
If annual mean values are used for TP in Equation 3.28, then 64.9 is used as the numerator
instead of 48. Note that the greatest change in SD occurs below a chl a concentration of about 30
μg/L. Above 30 μg/L, there is relatively little change in transparency with increasing chl a. Thus,
more TP must be removed from a highly eutrophic lake to see benefits in transparency than in a
moderately eutrophic or mesotrophic lake. For example, the range between 40 and 50 is most often
associated with mesotrophy. Between 40 and 50, TP concentration doubles and SD halves (4 m at
TSI of 40 and 2 m at TSI of 50), which is a change that would be obvious to lake users through
changes such as blue-green algal blooms and oxygen deficits. On the other hand, if a management
strategy proposed for a P-limited lake with a TSI of 70 will only cut the concentration in half, then
the lake users may not notice the small (0.5 m) improvement in transparency (Table 3.5).
TABLE 3.5
Completed Trophic State Index (TSI) and Its Associated
Parameters
TSI
Secchi Disc
(m)
Surface Phosphorus
(mg/m
3
)
Surface Chlorophyll
(mg/m
3
)
064 0.75 0.04
10 32 1.5 0.12
20 16 3 0.12
30 8 6 0.94
40 4 12 2.6
50 2 24 7.3
60 1 48 20
70 0.5 96 56
80 0.25 192 154
90 0.12 384 427
100 0.062 768 1183
Source: From Carlson, R.E. 1977. Limnol. Oceanogr. 22: 361–368. With permission.
Copyright © 2005 by Taylor & Francis
The Carlson index has been misused, particularly in lakes with high nonalgal turbidity or with
extensive macrophyte populations. It makes no sense to locate a sampling boat over the only
macrophyte-free patch of water and measure trophic state based on water column values for TP,
chl a, and SD. The lake could be classified as oligotrophic from these measurements, while anyone
viewing the lake would consider it highly eutrophic and unusable due to the extensive macrophyte
cover (Bachmann et al., 2001). Another problem often occurs in reservoirs where transparency is
determined primarily by nonalgal turbidity or color (Lind, 1986). In this case, the effect of nonalgal
turbidity can be determined by comparing the calculated TSIs for each of the three variables
(Havens, 2000).
Insight into nutrient limitation is also possible using the TSI. If TSI values for TP, chl a and
SD are nearly identical, this is evidence that algal biomass is P-limited and that chl a is the primary
determinant of transparency. But suppose the chl TSI is much smaller (i.e., oligotrophic) than the
TP TSI. That suggests algal biomass limitation by other factors, such as zooplankton grazing or
N limitation.
Canfield et al. (1983) proposed an index for classification of lakes largely covered by macro-
phytes. The total biomass of submersed macrophytes is determined and its P content, as determined
by tissue analysis, is then multiplied by the total biomass estimate of each species. The sum for
all species gives an amount of P associated with macrophytes. Then the P content of the water
(whole-lake mean) is added to that of macrophytes to give a total, whole-lake mean, which is then
used in the Carlson index. Canfield et al. found that macrophytes had little effect on trophic state
when they were less than 25% of the total whole-lake TP, and when mean macrophyte biomass is
less than 1 g dry wt/m
2
.
The LEI includes SD, TP, TN, chl a, DO, and macrophytes (Porcella et al., 1980). Water-
column Carlson TSIs are essentially the same as LEIs if P is limiting, but the advantage of the LEI
is if N is limiting, macrophytes are abundant, and/or if DO is important, whether stratified or
unstratified (see net DO below). Walker (1980, 1984) noted that some lakes and many reservoirs
may deviate in several ways from Carlson’s equations, perhaps due to N limitation or nonalgal
turbidity. Walker (1984) developed a 2-dimensional classification system, which appears to be
preferable to the Carlson index for reservoirs. The consultant/manager must choose the appropriate
index for the lake/reservoir in question.
Expressing lake trophic state on a probability basis may be more realistic (OECD, 1982; Chapra
and Reckhow, 1979). This approach recognizes that a high degree of uncertainty exists in trophic
state criteria. From the OECD model, for example, an annual mean TP of 40 μg/L has a 38%
chance of representing eutrophy, a 56% chance of mesotrophy, and a 6% chance for oligotrophy.
With this model, the generally accepted TP threshold for eutrophy of 25 μg/L represents a lake
with a high probability of being mesotrophic, but has a low and equal chance of being either
oligotrophic or eutrophic. A meso-eutrophic threshold by the OECD model would be a lake with
equal chance of being either eutrophic or mesotrophic, i.e., a TP concentration of almost 50 μg/L.
Although overlap and uncertainty in trophic state are realities, a threshold value of 50 μg/L
represents a condition that is far too degraded from the standpoint of recreational and water supply
use to be interpreted as mesotrophy. This represents more than a doubling in chl a from a generally
accepted eutrophic threshold (Porcella et al., 1980; Nürnberg, 1996). Carlson suggested a TSI of
40–50 for mesotrophy; 50 μg/L TP is a TSI of 60. Rast and Holland (1988) apparently recognized
that problem, recommending 35 μg/L as a meso-eutrophic threshold while advocating the OECD
model. Nevertheless, a meso-eutrophic threshold of 25 μg/L is the most frequently used criterion
(Nünberg, 1996).
TN has been used infrequently as a trophic state indicator. Except for unique cases (e.g., Lake
Tahoe, Goldman, 1981), the use of TN as an indicator would normally be pertinent only in highly
eutrophic lakes where N availability could be expected to control productivity. Smith (1982) has
presented a TP–TN–chl a predictive equation:
Copyright © 2005 by Taylor & Francis
log chl a = 0.6531 log TP + 0.548 log TN – 1.517 (3.29)
Equation 3.29 may be more useful in highly eutrophic systems than a TP-chl a relationship
alone. For example, it predicted a chl a concentration of 21 ± 9 μg/L in Moses Lake, Washington,
while Equation 3.25, based only on TP, predicted 50 ± 23 μg/L. The observed chl a value in that
N-limited lake was 23 ± 11 μg/L. Once mean TP concentration decreased below about 50 μg/L,
Equation 3.25 was a good predictor of mean chl a (Welch et al., 1989; Chapter 6). To take into account
the effect of different TN to TP ratios, Prairie et al. (1989) developed separate chl a–TP relationships
over a range in TN to TP ratios from 5 to 60. However, Prairie et al. (1995) suggested that variation
was probably due to TP and not an N fertilizing effect. Moreover, a long-term data set from 184
Missouri reservoirs show that N had a minor effect on TP–chl relations with an average summer
chl:TP ratio of 0.33, agreeing with other global TP–chl relations, so long as spring nonalgal turbidity
events are avoided. (Jones and Knowlton, in press). While N limitation may cause Equation 3.25
to over predict chl a in some cases, reduction of P is still the most appropriate approach to controlling
eutrophication. Several relationships that show chl a is dependent on TP at concentrations up to
200 μg/L support that contention (Seip, 1994; Scheffer, 1998; Welch and Jacoby, 2004).
Indices of DO have included; (1) areal hypolimnetic oxygen deficit rate (AHOD) in mg/m
2
per
day, (2) net DO, (3) minimum DO, and (4) anoxic factor (AF). Neither minimum DO nor net DO
has been correlated with TP loading or concentration, but AHOD was related to TP retention
(Cornett and Rigler, 1979) and oxygen deficit rate (ODR) to TP loading (Welch and Perkins, 1979).
AHOD is the DO index most often used for trophic state (Nürnberg, 1996; Table 3.6), and its
significance to fish was reviewed by Welch (1989) and Welch and Jacoby (2004).
AHOD is usually calculated as the slope of the linear plot of mean hypolimnetic DO against
time, multiplied by the hypolimnetic mean depth. DO sensors are not recommended, or at least
should be verified by adequate wet chemical method values, for AHOD calculation, due to the
index’s sensitivity to low DO concentrations. In some highly enriched lakes, DO may disappear
too rapidly to give an accurate estimate of AHOD, even if lake sampling is twice per month. Thus,
twice-weekly sampling in late spring and early summer may be necessary. Calculated AHODs can
vary depending on the time interval chosen, which should be held constant from year-to-year and
TABLE 3.6
Trophic State Boundary Values
Trophic State Indicator o-m m-e e-h
TP (μg/L) 10 25 100
Chl a (μg/L) 3.5 9 25
Secchi (m) 4 2 1
AHOD (mg/m
2
per day) 250 400 550
AF (days) 20 40 60
Net DO (mg/L) 4.5 5.0
Min. DO (mg/L) 7.2 6.2
TN (μg/L) 350.0 650 1200
Note: o-m, oligotrophic–mesotrophic; m-e,
mesotrophic–eutrophic; e-h, eutrophic–hypereutrophic.
TP, TN, Chl a and Secchi transparency are summer
means. AF = anoxic factor.
Source: After Nünberg, G.K. 1996. Lake and Reservoir
Manage. 12: 432–447. With permission.
Copyright © 2005 by Taylor & Francis
encompass the whole stratified period or until DO at the bottom reaches 1 mg/L. Although time
interval and hypolimnetic depth were held constant, AHODs in Lakes Sammamish and Washington
varied year to year over 20–30 years (King County, 2002; personal communication).
Net DO may answer the dilemma of a suitable DO index for unstratified lakes, because AHOD
(Chapter 18) is appropriate for stratified lakes only. Porcella et al. (1980) developed net DO, for
stratified and unstratified lakes alike, with values ranging from 0 to 10. Net DO is defined as the
absolute difference from an equilibrium condition (saturation) and is calculated by summing those
differences (equilibrium DO – measured DO) over intervals of depth, thus incorporating the
increasing tendency of supersaturation as well as deficiency in response to eutrophication.
Anoxic factor (AF) is equal to (Σt
i
• a
i
)/A
o
, where t is days of detectable anoxic conditions, a
is the sediment area and A
o
is surface area, both in m
2
(Nürnberg, 1995a,b). AF is a measure of
the lake bottom area covered by ≤ 1 mg/L DO and is more useful than AHOD in determining the
extent of conditions suitable for P internal loading and bottom area (habitat) inaccessible to bottom-
feeding fish. Year-to-year variation in AF was much less than AHOD in Lake Sammamish,
Washington (Perkins, 1995).
Boundary or threshold values for trophic states can be useful in communicating lake quality
conditions and as general management goals. Nürnberg (1996) reviewed these values and developed,
in most cases, new ones (except for minimum and net DO) based on regression equations that
related one variable to another (Table 3.6). Boundary values for SD are similar to those predicted
from 25 μg/L TP and 9 μg/L chl a using Equations 3.26–3.28 (3.6 and 1.9 m for o-m and m-e;
Table 3.6). These boundary values have recreational and water supply significance. At a mean
summer chl a greater than 10 μg/L, nuisance algal blooms with maximum concentrations > 30
μg/L begin to occur (Figure 3.7; Walker, 1985, personal communication). That mean chl a level
is directly related to a summer TP of 25 μg/L. Even beyond 10 μg/L, smaller bloom maxima may
occur. That TP threshold for a summer bloom exceeding 30 μg/L chl a was also shown for two
areas in Lake Okeechobee, Florida (Walker and Havens, 1995).
Although the trophic state per se of a lake is determined by the in situ concentration of TP,
chl a, etc., the loading rate that produces that trophic state also has trophic state implications. If
improvement of lake quality is desired, the loading (either external or internal) must be reduced.
FIGURE 3.7 Frequency of algal blooms greater than 10, 20 and 30 μg/L chl a related to summer mean chl
a; calibrated to Corps of Engineers Reservoirs. (From Walker, W.W., Jr. 1985. Empirical methods of predicting
eutrophication in impoundments. Applications Manual. EWQOS Program, U.S. Army Corps Eng., Vicksburg,
MS; and personal communication.)
100%
90%
80%
70%
60%
50%
40%
30%
20%
10%
0%
0
Bloom frequency
5 10
Mean chlorophyll-a (mg/m
3
)
15 20 25 30
>10, algae visible
>20, nuisance bloom
>30, severe
nuisance bloom
Copyright © 2005 by Taylor & Francis
Thus, the “critical” P loading (L
c
) to produce a P concentration representing a mesotrophic or
eutrophic state is often used as a goal, compared to the current or worsening state of a lake. The
critical loading rate for a particular lake and trophic state has been defined as
(3.30)
where TP
e/m
is 20 or TP
m/o
is 10 mg/m
3
for the eutrophic–mesotrophic or mesotrophic–oligotrophic
threshold, respectively (Vollenweider, 1976). However, other TP levels can be substituted, e.g., 25
μg/L. The effect of sedimentation is indicated in Figure 3.8, in which the critical inflow concen-
tration, TP
i
, is plotted against τ, or 1/ρ, according to Equation 3.19. If 1/τ is substituted for ρ in
Equation 3.19:
(3.31)
At low τ, the lines for lake concentrations of 10 and 20 mg/m
3
become parallel with the abscissa
indicating that sedimentation becomes minimal at short residence times (high flushing rates) and
the lake concentration equals the inflow concentration. As τ increases, sedimentation becomes
increasingly important in permitting higher TP
i
without exceeding the critical lake concentration.
That is, lakes become more tolerant of increased TP
i
as τ increases. See Reckhow and Chapra
(1983) for a more detailed discussion of these loading relationships.
Example calculations of P loading, lake P concentration, lake chl a, and Secchi transparency
follow.
3.2.3.1 Example 1
(a) Given a lake with a mean depth of 15 m, a flushing rate of 1.5/yr (outflow rate/lake volume),
and a mean inflow TP concentration of 80 μg/L, calculate the lake’s expected external TP loading
in mg/m
2
per yr.
From the conversion of Equation 3.18 to 3.19 we know that so
L = TP
i
zρ = 80 mg/m
3
× 15 m × 1.5/yr = 1800 mg/m
2
per yr
FIGURE 3.8 Relationship of inflow concentration (TP
i
) with water retention time (T
w
) for two lake concen-
trations (TP = 10 and 20 mg/m
3
). (From Cooke et al., 1993. With permission.)
100101.00.10.01
1000
100
10
1
TP, mg/m
3
10 mg/m
3
20 mg/m
3
τ
w
, Year
Lz
c e/m;m/o
TP=+()
.
ρρ
05
TP TP ( )
.
i
=+1
05
τ
Lz
i
/,ρ=TP
Copyright © 2005 by Taylor & Francis
(b) Using Equation 3.19, calculate the lake TP:
TP = 80/(1 + 1/ρ
0.5
) = 44 mg/m
3
If this result differs substantially from the observed TP concentration in the lake, then the model
should be calibrated to fit the existing lake data. If this model underestimates the existing lake TP
concentration and internal loading has been documented, then an equation similar to 3.21 should
be used for the lake.
3.2.3.2 Example 2
Calculate the expected average summer chl a concentration and SD in the lake from Example 1.
Using Equation 3.24, which yields nearly identical results as Equations 3.27 and 3.28 combined,
gives
log chl a = 1.449 log 44 – 1.136
= 1.28 and chl a = 19.1 μg/L
and using Equations 3.26 and 3.27 combined gives
SD = 7.7/19.1
0.68
= 1.03 m
and from Equation 3.26, or 3.27, 3.28, the TSI is 60.
The trend in the 1980s was to develop more specific P loading models for specific lake types.
Nurnberg’s (1984) separation of anoxic from oxic lakes is an example. Reckhow (1988) developed
a set of models for southeastern lakes and reservoirs that included N, P, and τ as predictors of
chl a as well as the probability of blue-greens or non-blue-greens representing the dominant
algae. Another example is Walker’s (1981, 1982, 1985, 1986, 1987, 1996) analysis of USACOE
reservoirs, which are typically quite different than lakes due to their higher average flushing rate
and hence P loading (see Chapter 2). They also tend to have higher levels of nonalgal turbidity
(Lind, 1986).
In analyzing USACOE impoundments, Walker found that the sedimentation rate of P could be
appropriately defined as a second order decay rate (rate of decrease dependent on square of the
concentration) of the lake TP concentration:
(3.32)
where P
s
is the phosphorus sedimentation rate in mg/m
3
per yr, K is the effective second order
decay rate in m
3
/mg per yr and P is the reservoir pool phosphorus concentration in mg/m
3
. According
to Walker, a second order rate gives a more general representation of sedimentation than a first
order rate, which is used in the Vollenweider type models for lakes.
An average estimate of decay rate for USACOE reservoirs was 0.1 m
3
/mg per yr. However,
the rate tended to be lower in reservoirs with low overflow rates (q
s
or hydraulic loading) and high
inorganic P (i.e., SRP):TP ratios. The overflow rate, q
s
, is calculated as the quotient of annual
outflow/reservoir area ( ). This effect of reduced settling with decreased q
s
was apparently
due to a greater algal assimilation of incoming P. To account for the differences in q
s
, Walker (1985)
developed two empirical equations:
PKP
s
=
2
or z / τ
Copyright © 2005 by Taylor & Francis