Soil and Environmental Analysis: Physical Methods - Chapter 8 pot
Bạn đang xem bản rút gọn của tài liệu. Xem và tải ngay bản đầy đủ của tài liệu tại đây (838 KB, 34 trang )
8
Bulk Density
Donald J. Campbell and J. Kenneth Henshall
Scottish Agricultural College, Edinburgh, Scotland
I. INTRODUCTION
The wet bulk density of a soil, r, is its mass, including any water present, per unit
volume in the field; its dry bulk density, r
s
, is the mass per unit volume of field
soil after oven-drying. These parameters are related to the soil gravimetric water
content, W, as follows:
r
r ϭ 100 (1)
ͩͪ
s
100 ϩ W
where W is the mass of water expressed as a percentage of the mass of dry soil.
The methods available for the measurement of soil bulk density fall into two
groups. In the first group are the long-established direct methods, which involve
measurement of the sample mass and volume. The mass M
s
of the oven-dried
sample is obtained by weighing, and the total volume, V, of the soil including air
and water is obtained by measurement or indirect estimation. The dry bulk density
r
s
is then given by
M
s
r ϭ (2)
s
V
Such methods have been used by both agricultural soil scientists (Freitag,
1971) and civil engineers (DSIR, 1964), and many of them reduce essentially to
the problem of the accurate determination of the sample volume. As these meth-
ods have not always proved entirely effective, a second group of methods has
evolved in which the attenuation or scattering of nuclear radiation by soil is used
to give an indirect measurement of bulk density. Radiation methods are capable of
Copyright © 2000 Marcel Dekker, Inc.
measuring more accurately and precisely than direct methods, but they too have
limitations of their own.
Thus there is no single measurement method suitable for all circumstances.
Sometimes a very crude but quick measurement is all that is required to charac-
terize soil conditions, but in other circumstances it may well be appropriate to use
a slower method involving expensive equipment, in order, for example, to detect
detailed differences between experimental treatments.
II. RADIATION METHODS
A. Theory
Radiation methods involve measuring either the attenuation or the scattering of
gamma radiation by the soil, both of which increase with density. Empirical cali-
bration relationships are used to relate the magnitude of such effects to soil bulk
density.
Gamma-ray photons are emitted by radioactive nuclei as they decay to form
more stable nuclei of lower excitation. A specific source will emit gamma photons
with the characteristic energy of one or more decay transitions. In passing through
any medium, the probability that these photons will interact with the atoms of the
medium is dependent on the density of the medium, as well as other factors such
as the energy of the photon and the chemical composition of the medium. These
interactions take the form either of complete absorption of the photon or of scat-
tering, where the photon loses energy in relation to the angle of deflection. Since
the photons interact principally with the electrons of the medium, the extent of the
interaction depends on the electron density, which is related to the bulk density of
the medium.
There are two main types of gamma-ray density equipment: backscatter
gauges, which are designed to detect only scattered photons, and transmission
gauges, which detect mainly unscattered photons. Depending on the level of en-
ergy discrimination, however, some simpler transmission systems also detect scat-
tered photons to different extents.
B. Backscatter Gauges
In backscatter gauges, the gamma-ray source and detector are fixed relative to, and
shielded from, each other in an assembly designed to prevent measurement of
directly transmitted photons. This assembly either rests on the soil surface or, in
some designs, is lowered into an access hole in the soil (Fig. 1). In either case, any
photons incident upon the detector must have been deflected by one or more scat-
tering interactions in the medium. Since there is only a low probability that a
photon that has travelled an appreciable distance from the source will reach the
316 Campbell and Henshall
Copyright © 2000 Marcel Dekker, Inc.
detector, it follows that only a restricted volume of the medium close to the
source/detector axis will influence the detected photon count rate. In practice, with
a probe that is used in an access hole, it is found that the zone of influence does
not extend more than about 75 mm from the source/detector axis and that 50% of
the photons penetrate soil within only about 25 mm of this axis.
The relation between count rate and bulk density is complicated, since the
degree of scattering increases with density, thereby increasing the count rate, but
absorption of both scattered and unscattered photons also increases with density
and so reduces count rate. Thus theoretical calibrations of backscatter gauges are
impracticable, and empirical calibrations must be made.
Surface backscatter gauges require only that the surface of the soil be made
perfectly level in order to exclude air gaps, but they yield little information,
merely indicating the average density of the top 50 –75 mm of the soil profile.
Their main use is in civil engineering applications where bulk densities which are
generally uniform with depth are to be measured. A typical level of accuracy for
these gauges is Ϯ0.16 Mg m
Ϫ3
(Carlton, 1961).
Bulk Density 317
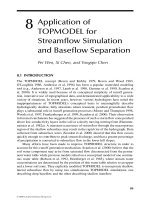
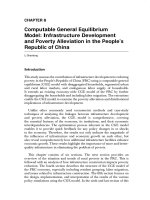
Fig. 1 Schematic diagrams of backscatter gamma-ray gauges in which the source and
detector assembly either lies on the soil surface (left) or is lowered into an access hole in
the soil (right).
Copyright © 2000 Marcel Dekker, Inc.
Single-probe backscatter gauges are normally lowered into lined access
holes in a manner similar to neutron moisture probes (Chap. 1) and are available
in combination with such probes. The major failing of these gauges results from
the bias of their zone of influence close to the source/detector axis. This means
that both the clearance gap of the probe in the liner tube and the tube itself influ-
ence the measurements unduly. The measurements are also very susceptible to any
disturbance of the soil during installation of the liner tube.
C. Transmission Gauges
In transmission gauges (Fig. 2), the sample to be tested is located between the
source and the detector of the gauge, and ideally only unattenuated photons
passing directly from source to detector are counted. In this ideal case, where
none of the photons has been degraded, the detected photon count rate, I, obeys
Beer’s law,
I ϭ I exp[Ϫmrx] (3)
0
318 Campbell and Henshall
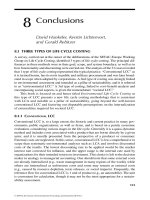
Fig. 2 Schematic diagrams of transmission gamma-ray gauges in which the detector ei-
ther remains on the soil surface and the source is lowered into an access hole in the soil
(left) or in which both the source and detector are lowered into separate access holes (right).
Copyright © 2000 Marcel Dekker, Inc.
where I
0
is the photon count rate in the absence of a sample, m is the mass attenu-
ation coefficient for the specific photon energy and sample material concerned,
r is the wet bulk density of the sample, and x is the sample length. The bulk
density of the sample can then be calculated as
Ϫ1 I
r ϭ ln (4)
ͩͪ
mxI
0
if values are available for m, x and I
0
.
In practice, several factors make such a theoretical calculation of density
impracticable. The most important of these are
1. Inclusion in the count of some scattered photons
2. Determination of a single mass attenuation coefficient for soils of vari-
able composition
3. Estimation of the photon count rate in the absence of a sample
1. Scattered Photons
With the exception of laboratory equipment in which a high degree of both colli-
mation and energy discrimination is possible, scattered photons will always be
included to some extent in the detected count rate. Scattered and unattenuated
photons have different mass attenuation coefficients, and the presence of scattered
photons therefore affects the linearity of the relationship between r and ln I/I
0
.
The reduced energy of these scattered photons also increases the dependence of
the detected count rate on the chemical composition of the soil sample, as will be
discussed later, and reduces the spatial resolution of the gauge by increasing the
volume of soil, which influences the count rate.
While it is possible to reduce the number of scattered photons by collima-
tion, limited space prevents this in field gauges. An alternative is to use an energy-
discriminating detector, set to exclude photons with energies lower than the
emission energy of the source. Gauges with this facility generally use a scintilla-
tion detector, such as a sodium iodide crystal, linked to a photomultiplier tube
and pulse height analyzer. Energy-discriminating detectors need to be stabilized
against temperature changes.
Simpler transmission gauges use Geiger–Mu¨ller detectors, which are not
capable of energy discrimination and hence are susceptible to scattered photons.
In effect, these gauges operate in both the transmission and backscatter modes
simultaneously. Provided such a gauge is calibrated empirically, its only major
disadvantage, other than a slight dependence on the chemical composition of the
soil, is its low spatial resolution, which can affect measurements close to distinct
boundaries such as the soil surface or a plow pan. For example, Henshall and
Campbell (1983) found that a Geiger–Mu¨ller based gauge overestimated the den-
sity of water by 35% at a depth of 20 mm below an air/water interface and contin-
ued to overestimate the density by more than 5% to a depth of 90 mm.
Bulk Density 319
Copyright © 2000 Marcel Dekker, Inc.
Gauges employing energy discrimination can be adjusted to give high spa-
tial resolution limited only by the dimensions of the detector, which can be as
small as 10 ϫ 10 mm cross-section. However, the need to ensure sufficiently high
count rates forces lower resolution settings which, by including some scattered
photons, results in the need for empirical calibration as with simpler gauges.
2. Soil Composition
As used in Eq. 3, the mass attenuation coefficient, m, is an overall value for the
bulk material examined. A theoretical value of m would be the mean of the indi-
vidual mass attenuation coefficients for each of the constituent elements, weighted
according to the mass fraction of each element in the sample. Differences in the
chemical composition of the soil can therefore affect the overall mass attenuation
coefficient.
The mass attenuation coefficient of a chemical element varies with the
atomic number of the element, Z, and the incident photon energy. Coppola and
Reiniger (1974) showed that m increased with increasing photon energy but that,
for photon energies above about 0.3 MeV, there was little dependence of m on
Z below Z ϭ 30, with the exception of hydrogen, which is discussed below.
Caesium-137, which emits mono-energetic photons of 0.662 MeV, is the radio-
active source most commonly employed in soil bulk density gauges. At this pho-
ton energy, calculations based on theoretical values of mass attenuation coefficient
for nine different soils show that the error in estimated density due to the effect of
composition is of the order of 0.5% in the most extreme case (Reginato, 1974).
An energy-discriminating system set to exclude photons of energy lower than the
caesium-137 emission energy would therefore not show a significant dependence
on chemical composition of the soil. In contrast, Geiger–Mu¨ller detectors, which
do not employ energy discrimination, are sensitive to photon energies as low as
0.04 MeV (Soane, 1976). Consequently, a significant proportion of the detected
count rate will include scattered photons with energies that are below 0.3 MeV
and so are susceptible to composition effects. Nevertheless, only a small propor-
tion of the detected photons will have been scattered through angles large enough
to result in such low energies so that the effect of composition on count rate is
unlikely to be serious except in backscatter gauges, where it is only the less ener-
getic scattered photons that are counted. Generally, transmission gauges, espe-
cially those with energy discrimination, are not susceptible to soil composition
effects except in soils that have a large proportion of heavy elements, such as iron
(Gameda et al., 1983).
3. Photon Count Rate in the Absence of a Sample
In order to apply Beer’s equation (Eq. 3), it is necessary to know the photon inten-
sity I
0
in the absence of a sample. The theoretical relation assumes an ideal situ-
320 Campbell and Henshall
Copyright © 2000 Marcel Dekker, Inc.
ation where none of the detected photons in I or I
0
are attenuated or scattered.
Although a measurement of I
0
directly, i.e., in the absence of any attenuation by
the soil, would be very similar to this ideal situation, safety considerations make
it impracticable. The normal method therefore is to make a reference measurement
using a material of constant density such as a steel plate. The reference count rate,
I
r
, can be written as
I ϭ I exp[mrx] (5)
r0 rr
where r
r
is the mean density, over the sample length, of the reference plate and air
gap, and m
r
is the corresponding mass attenuation coefficient. This, combined with
Eq. 3, gives
I
ϭ exp[Ϫx(mr Ϫ mr)] (6)
rr
I
r
thereby eliminating I
0
. Relating test measurements to reference measurements in
this way also allows for the gradual decrease with time in the activity of the source
and any gradual change in the efficiency of the detection system.
D. Calibration
When a gauge is calibrated relative to a standard reference plate, Eq. 6 can be
rearranged to give an expression for bulk density, namely
1 I
r
r ϭ ln Ϫ mrx (7)
ͫͩͪ ͬ
rr
mxI
or
I
r
r ϭ A ln ϩ B (8)
ͩͪ
I
where A and B are empirically determined constants. Since the gauge measures
only wet bulk density, an independent measurement of gravimetric water content
is required to give the dry bulk density r
s
from Eq. 1.
Hydrogen, which in soil is most abundant in the water, does not conform
with other elements in its attenuation of gamma photons, as it possesses only one
nucleon per electron, whereas other atoms typically possess approximately two.
While the gamma-ray attenuation system effectively measures the number of elec-
trons per unit volume, bulk density is related to the number of more massive nu-
cleons per unit volume, and so the density of hydrogen is overestimated by a factor
of approximately two. Consequently, if the greater attenuation coefficient of hy-
drogen were not corrected for, the bulk density would be slightly overestimated.
For samples with gravimetric water contents of 10, 25, and 100%, the theoreti-
Bulk Density 321
Copyright © 2000 Marcel Dekker, Inc.
cal overestimate would be 1, 2, and 5%, respectively. In many applications, this
level of accuracy may be considered acceptable, but, if required, the error can be
corrected for during calibration. Separating the effects of water and soil, Eq. 3
becomes
I ϭ I exp[Ϫx(mr ϩ mr)] (9)
0ssww
where r
w
is the mass of water per unit total sample volume, and m
s
and m
w
are the
mass attenuation coefficients for soil and water, respectively. Expressing r
w
as
(r
s
W/100) and incorporating a reference standard as in Eq. 6, we have
IW
ϭ exp Ϫx rmϩ m Ϫ mr (10)
ͭͫͩ ͪ ͬͮ
ss w rr
I 100
r
which leads to
ln(I /I) ϩ mrx
rrr
r ϭ (11)
s
x(m ϩ m W/100)
sw
which again can be simplified to
A ln(I /I) ϩ B
r
r ϭ (12)
s
100 ϩ CW
where constants A, B, and C are determined empirically.
E. Gauge Design
1. Radioactive Source
The primary requirements of a radioactive source for a soil density gauge are that
it should have a single energy peak at an energy sufficiently high to reduce com-
position effects, that the emitted photons should have a suitable penetration range
into the soil sample, and that the half-life should be long enough not to affect any
series of experimental measurements and should preferably exceed the expected
life of the gauge. Caesium-137, with a mono-energetic peak of 0.662 MeV and a
half-life of 30 years, is the source most suited to these requirements. The optimum
soil sample length for gamma photons of this energy has been suggested as 100
to 250 mm (Ferraz and Mansell, 1979).
The rate of emission of gamma photons from a radioactive source is not
perfectly constant but subject to random fluctuations about a mean value. The
resulting fractional error in count rate is inversely proportional to the square root
of the total number of photons counted (Ferraz and Mansell, 1979), and so it is
preferable to count as many photons as possible to achieve the highest level of
precision. This can be achieved by counting for long periods of time and by using
the highest possible activity of source. However, for portable field gauges, the
322 Campbell and Henshall
Copyright © 2000 Marcel Dekker, Inc.
practical limit of activity is set by safety considerations. The maximum source
activity that can be shielded to give the statutory levels of safety without the gauge
becoming unacceptably heavy for field use is of the order of 0.4 GBq (10 mCi).
In laboratory gauges, larger shields allow much larger sources to be used, in which
case the upper limit to source activity is determined by the dead time of the detec-
tion system. This results from the inability of the detector to respond within a fixed
time after detecting a photon, thereby imposing a count rate limit irrespective of
source strength. With gauges based on NaI(T1) detectors this limits source activity
to about 7 GBq (200 mCi). Although it has been suggested (Herkelrath and Miller,
1976) that this could be increased to 70 GBq (2000 mCi) where plastic scintilla-
tors are used, this proposal has never been adopted.
2. Probe Design
Portable field transmission gauges are of either single or twin probe design
(Fig. 2). In single-probe gauges, the radioactive source is lowered through the
body of the gauge into a preformed access hole, normally to a depth of about
300 mm (Fig. 2). The detector, which is generally of the nondiscriminating type,
is located on the base of the gauge body at a fixed distance from the source probe
axis, so that it is in contact with the surface of the soil. The count rate at each
depth then relates to the average bulk density between the source depth and the
surface. Such a gauge avoids some operational problems common to twin-probe
gauges but suffers from an inability to examine soil layers and also requires a
separate calibration for each measurement depth. Commercial gauges are nor-
mally supplied with factory calibrations, but users generally find that recalibration
is necessary (Gameda et al., 1983).
The probes of twin-probe gauges (Fig. 2) are normally clamped rigidly at a
fixed separation of between 140 and 300 mm so that, after they have been lowered
to any desired depth in the soil, horizontal layers of soil can be examined (Fig. 2).
These gauges are more suited to the study of soils in the context of agriculture,
forestry, and the natural environment, where considerable variation in bulk den-
sity with depth is usually found. Conversely, in civil engineering applications, the
soil is likely to be more uniform with depth, since only subsoils, either in situ or
excavated and subsequently compacted as fill material, are of concern. In such
applications, single-probe gauges have proved more popular.
Because of the fixed probe separation in twin-probe gauges, a single cali-
bration relationship is applicable to all depths, but it is essential either that the
access holes remain parallel or that any deviation is corrected for. Most popular
commercial gauges incorporate nondiscriminating detectors and are therefore sus-
ceptible to problems of lack of resolution close to either air/soil interfaces or
abrupt soil density changes with depth. However, detectors that employ energy
discrimination are available (Fig. 3).
Bulk Density 323
Copyright © 2000 Marcel Dekker, Inc.
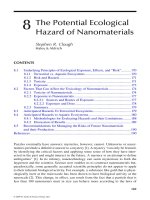
Fig. 3 Gamma-ray transmission gauge developed at the former Scottish Centre of Agri-
cultural Engineering, complete with transport box which incorporates material for making
a reference measurement and a scaler in the lid.
Copyright © 2000 Marcel Dekker, Inc.
F. Soil Water Content Determination
While water content data are normally obtained from soil samples that have been
extracted by auger and oven-dried at 105Њ C, some gauges incorporate a facility
that allows water content to be estimated by nucleonic methods. Some single-
probe gamma transmission gauges incorporate a neutron backscatter apparatus
either in the base of the gauge body or in the probe. In conditions of uniform water
content, such systems give an adequate overall estimate, but where water content
varies with depth, the neutron backscatter apparatus does not have sufficient spa-
tial resolution to allow correction of individual density measurements, since it has
a typical sphere of influence of 250 mm radius.
A much more sophisticated method of simultaneously measuring bulk den-
sity and water content involves the use of the double-energy gamma transmission
gauge. By employing a low-energy source, usually
241
Am with an energy peak of
0.06 MeV, together with a
137
Cs source (0.662 MeV), this technique makes use of
the effect of chemical composition, especially hydrogen content, on the attenu-
ation of low-energy photons. By including the effects of both soil and water, as in
Eq. 9, in separate calibrations for the two energies, the resulting simultaneous
equations can be solved for both dry bulk density and water content. The major
drawback to this method is that the dependence of the low-energy calibration on
chemical composition may necessitate different calibrations for different soils or
possibly even for different depths in the same soil. This limitation effectively re-
stricts the usefulness of this method to repeated laboratory tests on a single soil
where only a single set of calibrations would be needed. Because of their special-
ized nature, such gauges are not available commercially.
III. METHODS OF MEASURING BULK DENSITY
A. Direct Measurement of Sample Mass and Volume
1. Core Sampling
In this widely used method a cylindrical sampler is hammered or pressed into the
soil. As the volume of the cylinder is known, trimming of the soil core flush with
the ends of the cylinder allows the bulk density to be calculated (Lutz, 1947;
Jamison et al., 1950). The method works best in soft, cohesive soils sampled at
water contents in the region of field capacity. Sands and gravels cannot be sampled
satisfactorily.
A possible source of error in the method, which is difficult to quantify, is
soil disturbance, especially by compression, during insertion of the sampler. Baver
et al. (1972) have suggested that insertion by hammering may cause shattering,
while steady pressure may produce compression. In an extensive survey of core
sampling for civil engineering purposes referred to by Freitag (1971), Hvorslev
Bulk Density 325
Copyright © 2000 Marcel Dekker, Inc.
(1949) considered sample distortion to be a minimum when the sampler was
pressed steadily rather than hammered into the soil. He also built a core sampler
in which a piston was used to reduce the air pressure acting on the upper surface
of the sample in the cylinder. The diameter of the sample also influences the risk
of compression, with small diameter samples being more susceptible. Constantini
(1995) found that increasing the sample diameter beyond approximately 60 mm
did not improve the accuracy of bulk density measurement. Baver et al. (1972)
proposed a diameter of 75–100 mm as a satisfactory compromise for most work,
while Freitag (1971) suggested that the diameter should be selected to give a
sample of adequate size, and that the length should not be more than about three
times the diameter. Generally, the cylinder wall should be as thin as possible con-
sistent with being rigid (DSIR, 1964). Further aids to easy insertion of the sampler
include relieving both the inner and outer diameter immediately behind the cutting
edge (Buchele, 1961) and lightly greasing the inside of the sample cylinder (Veih-
meyer, 1929).
In order to extend the range of soils from which core samples can be taken,
rotary core samplers have been introduced for hard, brittle soils that may shatter
during conventional core sampling (Buchele, 1961; Freitag, 1971).
2. Rubber Balloon Method
In this method a hole is excavated in the soil to the bottom of the layer being
tested, and the removed soil is weighed and its water content determined. The
volume of the sample is determined by inserting a thin rubber balloon into the
excavated hole and filling it with water. For accurate results to be obtained, the
excavated hole should have a regular shape so that the balloon can reasonably be
expected to fill any irregularities which arise (DSIR, 1964; Blake, 1965; Freitag,
1971). To this end, apparatus has been developed in which the balloon is clamped
to the base of a calibrated water container that includes a pump to force the water
into the balloon (DSIR, 1964; Freitag, 1971). Generally, the method is considered
to give unreliable results.
3. Sand Replacement
In the sand replacement method, the sample is excavated, weighed, and its water
content determined as in the rubber balloon method. The hole produced is usually
about 100 mm in diameter. A metal cylinder, usually referred to as a ‘‘sand bottle’’
(Fig. 4), containing dry sand is placed over the hole and a tap in the base of the
cylinder is opened to allow the sand to fill the hole. The difference in weight of
the cylinder, before and after filling the hole, is recorded. The bulk density of the
sand is obtained from a calibration test in which sand from the bottle is used to fill
a can of known volume, and this allows the volume of the excavated hole to be
326 Campbell and Henshall
Copyright © 2000 Marcel Dekker, Inc.
calculated (DSIR, 1964; Blake, 1965). Allowance is made for the sand between
the tap and the soil surface level by opening the tap while the equipment rests
on a flat metal plate. In a variation of the method, which does not involve de-
termination of the bulk density of the sand, a container for the sand is calibrated
in terms of volume, as in a measuring cylinder, and the difference in volume
before and after filling the hole gives the volume of the hole. The method is
claimed to give smaller errors than the conventional sand replacement method
(Cernica, 1980).
Several aspects of the test procedure require to be carefully controlled if
reliable results are to be obtained. The volume of the calibration can should be
similar to that of the excavated hole, since a 25 mm decrease in the depth of the
can produces a decrease of about 1% in sand bulk density. A similar decrease
in density is produced by a 50 mm reduction in the initial level of the sand in
the cylinder (DSIR, 1964). The sand should be closely graded (typically, 0.2 to
2.0 mm material is used) to prevent segregation and hence variation in sand bulk
density, and this is considered more important than the actual size range used.
The greatest care should be taken to ensure that the sand remains dry and
uncontaminated by soil when it is recovered from the hole at the end of a test.
Frequent checks on the calibration are the best way of checking whether this is
Bulk Density 327
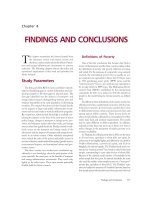
Fig. 4 Schematic section through a typical sand bottle used in the sand replacement
method showing the sliding tap in the closed position.
Copyright © 2000 Marcel Dekker, Inc.
occurring (Freitag, 1971). Although the sand replacement method is relatively
slow, with a typical test time of 30 minutes, it has the advantage that it can be used
on all soil types (Freitag, 1971).
4. Clod Method
In this method a clod is weighed and its volume is determined by coating it in
paraffin wax and immersing it in a volumenometer. The volume of water displaced
corresponds to that of the clod plus wax (DSIR, 1964). Alternatively, the waxed
clod may be weighed in air and in water. In both versions of the method the wax
coating must subsequently be removed and weighed. The wax coating is applied
by suspending the clod from a fine wire and dipping the clod in paraffin wax at
a temperature just above its melting point. Although the method gives satisfactory
results, it is limited to cohesive soils and is a rather slow method when wax is used
as the coating material. A useful summary of these techniques is given by Russell
and Balcerek (1944).
Saran F-220 resin, dissolved in methyl ethyl ketone, was used as a substitute
for wax by Brasher et al. (1966), who found that it was flexible, did not melt
duringovendryingat105Њ C, and was permeable to water vapor but not to liquid
water. It could therefore be used to study the drying and shrinkage characteristics
of a clod. Rubber solution has also been used as the coating material, with claims
of improved accuracy and convenience over the paraffin wax method (Abrol and
Palta, 1968). A flotation technique has been used in which the clods were sprayed
with a resin solution and then immersed sequentially in liquids of different relative
density. The relative densities of the two liquids in which the clods just sank and
just floated provided an upper and lower limit to the clod bulk density. As neither
clod mass nor clod volume was determined, the technique was shown to be ten
times as rapid as the wax coating method (Campbell, 1973).
It is possible to avoid coating the clod at all if the immersion fluid does not
penetrate the soil pores. Although various viscous oils and mercury have been
used, the technique is probably restricted to soils with very small pores. Thus one
successful application was in a study of the density of puddled soils (Gill, 1959).
Other published techniques for clod bulk density measurement include the use of
x-rays (Greacen et al., 1967), elutriation in a vertical air stream (Chepil, 1950),
and immersion in a bed of glass beads (Voorhees et al., 1966).
B. Radiation Methods
Several users have designed and built gamma-ray gauges to suit specific purposes.
A selection of both backscatter and transmission gauges that are commercially
available is given in Table 1.
328 Campbell and Henshall
Copyright © 2000 Marcel Dekker, Inc.
Table 1 Details of Some Commercially Available Gamma-Ray Gauges
Supplier Model Configuration Detector
Source and
strength
Maximum
measure-
ment
depth (m)
Data
recording
micro-
processor Comments
ELE Ltd
Eastman Way
Hemel Hempstead
Hertfordshire
HP2 7HB, UK
CPN Corp.
MC-3
Portaprobe
Transmission (surface
detector, single probe)
or backscatter (surface
source and detector)
Geiger—Mu¨ller
137
Cs, 10 mCi 0.2 or 0.3 Yes Incorporates neutron
backscatter gauge
with source at
surface
CPN Corp.
Strata
gauge
Transmission (twin
probe at approx.
300 mm separation)
Geiger—Mu¨ller
137
Cs, 10 mCi 0.6 Yes Incorporates neutron
backscatter gauge
with source in
probe
CPN Corp.
501B
Depthprobe
Backscatter (source and
detector in single
probe)
Geiger—Mu¨ller
137
Cs, 10 mCi 10.0 Yes Incorporates neutron
backscatter gauge
with source in
probe
Wykeham-Farrance
Weston Road
Slough, Berkshire
SL1 4HW, UK
Humbolt
Mfg. Co.
36530
Transmission (surface
detector, single probe)
or backscatter (surface
source and detector)
Geiger—Mu¨ller
137
Cs, 10 mCi 0.2 or 0.3 Yes Incorporates neutron
backscatter gauge
Troxler Electronic
Laboratories Inc
PO Box 12057
North Carolina 27709
3430
Density
gauge
Transmission (surface
detector, single probe)
Geiger—Mu¨ller
137
Cs, 8 mCi 0.2 or 0.3 No Incorporates neutron
backscatter gauge
with source at
surface
Soils Department, SAC,
Bush Estate
Penicuik, Midlothian
EH26 0PH, UK
SCAE
density
gauge
Transmission (twin
probe at 220 mm
separation)
Energy
discrimination
137
Cs, 5 mCi 0.6 No Detailed specifica-
tion to order
Copyright © 2000 Marcel Dekker, Inc.
1. Sample Preparation
For any type of nuclear density gauge it is important that the sample be always
presented to the gauge in a consistent manner. In laboratory transmission gauges,
each sample is placed in turn in a container located between the source and the
detector. In field transmission gauges, either a single access hole or two parallel
access holes must be made in the soil; equipment for this purpose is shown in
Fig. 5. Access holes can be formed by hammering solid spikes through an align-
ment jig lying on the soil surface (Soane et al., 1971). Although a certain amount
of disturbance takes place during this operation, this can be considered to be com-
pensated for by providing access holes in calibration samples in exactly the same
way, provided the soil is not fractured during spiking.
The provision of access holes by augering minimizes soil disturbance, but
the procedure can be more difficult, particularly where parallel holes are required.
Augering has several other advantages however, namely that the removed soil can
be used for water content determination, calibration samples can be smaller, and
it is easier to instal liner tubes in the access holes where they are required (Soane,
330 Campbell and Henshall
Fig. 5 Equipment used to provide two parallel access holes for transmission gamma-ray
gauges either by hammering spikes through an alignment jig (left) or by augering (right).
A liner tube has been inserted in the right-hand augered hole.
Copyright © 2000 Marcel Dekker, Inc.
1968). In loose soil conditions, liners should be inserted progressively during au-
gering to prevent soil entering the access hole.
2. Calibration
Except for laboratory gauges with high levels of collimation, for which it is pos-
sible to use theoretical values for mass attenuation coefficients, some form of
empirical calibration is required. Some gauge manufacturers supply specimen
calibrations with gauges, but most workers involved with agricultural soils have
found it desirable to recalibrate their gauges. Some manufacturers also supply
standard density blocks for calibration, which can be useful for periodic checks
on calibration stability but are unlikely to be suitable for a full calibration, because
both the mode of probe access to such blocks and their composition can be differ-
ent from that in the field.
Calibrations with field soils can be made in situ either by comparison with
a direct method, normally core sampling, or by repacking field soils into bins and
determining their density independently from measurements of sample mass and
volume (Henshall and Campbell, 1983; Soane et al., 1971). Both types of calibra-
tion are slow, and each has its merits. Comparison with core sampling has the
advantage that soils of field structure are used, but core sampling, especially at
depth, is time-consuming and unreliable. Such comparisons usually assume, with-
out justification, that core sampling results are the more accurate. Unless minimal
disturbance is ensured in the gauge method by using auger access, sampling at
different positions for the two methods is required, with the resulting complication
of accounting for the variability of field soils.
Calibration with remolded field samples packed in bins simplifies the direct
measurement of bulk density (Henshall and Campbell, 1983; van Bavel et al.,
1985), but where gauge access is by spiking, samples must be sufficiently large to
ensure that the walls of the bin do not influence the soil disturbance during spik-
ing, and tests have to be restricted to a single access position to avoid interaction
between multiple spikings. Where insertion is by augering and only unattenuated
photons are counted, samples that are only marginally larger than the probe spac-
ing can be used, and multiple access positions will compensate for inconsistencies
in the packing of the sample. It should be remembered that the zone of influence
extends horizontally as well as vertically. Generally, samples must be carefully
prepared in thin layers to achieve uniform packing (Fig. 6).
In calibration, the precision of both measurements made with the gauge
and direct methods should be similar, and there is no advantage in making exces-
sively long, precise measurements of count rate. If soil variability is high, short,
less precise measurements should be made with the gauge, and the time saved
spent in further sampling with both methods. In general, test counts normally
Bulk Density 331
Copyright © 2000 Marcel Dekker, Inc.
comprise between 2,000 and 10,000 counts, giving levels of precision of between
2.5 and 1%.
Standard reference counts should be made for each calibration sample, us-
ing the same reference plate as used with test measurements. Since the reference
count is related to all measurements in a sample, and any errors could have a
significant effect on the calibration, it is usually made over a longer period than
that for test counts.
Finally, it should be stressed that it is essential that calibration samples be
tested in exactly the same manner as the experimental samples to which the cali-
bration is applied. This is particularly important with respect to the method of
providing probe access.
3. Experimental Considerations
As with calibration, the decision between making a few highly detailed measure-
ments or more replication in less detail is determined by sample variability. Since
field soils tend to display large random variations in soil properties, it is generally
more worthwhile to replicate measurements than to make very precise measure-
332 Campbell and Henshall
Fig. 6 Calibration samples for gamma-ray gauges in which access is provided by spiked
holes (left) and by augered and lined holes (right). The alignment jig for the augered holes
is also shown.
Copyright © 2000 Marcel Dekker, Inc.
ments in a few sampling positions. Typically, more than 5000 counts per mea-
surement cannot be justified, and between 2000 and 3000 counts is adequate
(Soane, 1976). In replicated field experiments, the number of measurement posi-
tions per treatment is typically two or three, giving coefficients of variation of
about 10%, and is probably a good compromise (Soane et al.,1971). However,
measurements of soil properties in sampling positions that are close together gen-
erally tend to be more similar than those made further apart (Burgess and Webster,
1980). When such spatial dependence is allowed for, the number of measurements
required for a given level of precision can sometimes be reduced (McBratney and
Webster, 1983).
Stones may present difficulties either by preventing the provision of access
holes to the full depth or by deflecting the probes of a twin probe system and
so altering the source/detector separation. Where access holes cannot be made,
a new sampling position has to be tested instead, with the result that the mean bulk
density may be biased in favor of those samples where stones lie between, rather
than at, the positions of the two probes. Thus the bulk density of stony soil may
be overestimated. The effect will depend on both the number and the size distri-
bution of stones but appears not to have been investigated. The problem of pos-
sible probe deflection by stones can be overcome only by measuring, and correct-
ing for, the actual source/detector separation at each depth (Soane, 1968). The
statistical problems arising from soil variability and from stones have been ex-
amined in relation to the measurement of soil cone resistance; some of this infor-
mation is relevant to the measurement of bulk density (O’Sullivan et al., 1987).
4. Operational Safety
All nuclear density gauges are potential health hazards. In the U.K., it is a legal
requirement for radioactive sources to be registered with the Health and Safety
Executive (Anon., 1985). A similar situation exists in the USA. In the U.K., a
‘‘System of Work’’ which describes an approved safe operating procedure for the
gauge is normally incorporated in the registration. Most manufacturers supply an
example of such a document with the gauge, but for nonstandard gauges or pro-
cedures, a system that minimizes the exposure of the operator to radiation must be
devised, documented, and approved.
For field gauges, a safe operating procedure is one that ensures that the
source is exposed for the minimum time possible. This can be achieved by low-
ering the probes through the base of the gauge so that the source is always shielded
either by its shield or the soil, and by ensuring that, when not in use, the source is
securely located in its shield. For laboratory gauges, interlocking devices on the
shield are required to prevent accidental exposure, since much larger sources are
generally used than in the field.
Bulk Density 333
Copyright © 2000 Marcel Dekker, Inc.
C. Comparison of Methods
The difficulty in extracting soil samples from the field without disturbance to
both the sample and the wall of the remaining hole means that none of the direct
methods of measuring bulk density can be relied upon to be totally accurate. Er-
bach (1983) described the sand replacement method as ‘‘good for use in gravelly
soil,’’ but for most soils the core sampling method is generally taken to be the
standard method, despite its many forms of error. Raper and Erbach (1985) stated
that ‘‘it is disturbing that a method with this many inherent errors is referred to as
a standard.’’ Many workers, when finding that density measurements recorded by
gamma-ray gauges do not agree with direct measurements, have been inclined to
dismiss the gamma gauge as inaccurate or unsatisfactory.
Several comparisons between direct and gamma-ray measurements have
found general agreement between the two methods (King and Parsons, 1959;
Blake, 1965; Soane et al., 1971; Gameda et al., 1983; Minaei et al., 1984; Schafer
et al., 1984), with discrepancies in some soil types, which are normally attributed
to inaccuracies in the gamma gauge. King and Parsons (1959) found reasonable
agreement (Ϯ3%) between a single-probe gamma gauge and the sand replacement
method in sandy and clay soils but unacceptably large differences of 11% in grav-
elly soils. Several explanations of the discrepancy were given, such as variation in
gamma-ray absorption according to particle size, but no consideration was given
to the more probable dependence of the sand replacement test on particle size
(DSIR, 1964).
Gameda et al. (1983) compared single and twin-probe gamma gauges with
the core sampling method on three soils to a depth of 0.6 m. They found a good
correlation between the gamma and core measurements on sandy and clay soils
but not on loamy soil. The poor correlation in loamy soil was attributed to the
presence of stones in the soil and its high iron content. The data as presented
suggests that the loam was very variable, perhaps due to stones, but a significant
effect due to iron content seems unlikely. Although a good correlation was found
between core density and the density values indicated by the factory calibrations
for the gamma gauges, the test values for the gauges were significantly different
from each other, confirming the need for calibration of gamma gauges in field
soils.
Soane et al. (1971) found that, on three contrasting mineral soils, density
measurements from a twin-probe gamma gauge agreed with corresponding core
sample measurements within 3%, but that there was a discrepancy of 0.06 Mg/m
3
on low-density (0.28 Mg/m
3
) organic peat samples. The coefficients of variation
for both methods were found to be similar for a given soil. The gamma gauge
was found to be faster in operation by a factor of 2 or 3; it also had the advan-
tage that measurements could be made at close depth intervals in a soil profile
334 Campbell and Henshall
Copyright © 2000 Marcel Dekker, Inc.
with little disturbance. A single calibration relationship was applicable to all the
soils tested. In a review of gamma-ray transmission systems, Soane (1976) re-
ported that the accuracy of different laboratory measurement systems ranged from
Ϯ1.2% to Ϯ3%.
A useful indication of the potential accuracy of gamma gauges was carried
out by Schafer et al. (1984). Over a five-year period, core samples were removed
from the field and tested in an empirically calibrated laboratory gamma gauge
after direct measurement of their bulk density. For 80% of the 236 cores tested,
the discrepancy was less than 1%, and the results for only two samples disagreed
by more than 2%.
The gamma-ray transmission method is therefore potentially at least equal
in accuracy to any of the direct methods of density determination and is simpler
and quicker to use, especially where measurements at depth are required. The
twin-probe gamma gauge is more accurate than the single-probe version, allowing
much more detailed information on soil layers to be acquired, provided that the
parallel access holes are carefully prepared or nonparallelism is allowed for.
The high cost of gamma-ray gauges compared with equipment for direct
measurement and the requirement for compliance with radiation safety regula-
tions (Anon., 1985) offsets the advantages of the gamma gauges where few mea-
surements are required. In such cases, the core sampling method has proved to be
the most popular alternative except in gravelly soils or where looseness of the soil
prevents its retention within the core, in which case the sand replacement method
is the best option.
Some comparisons have been made of the various direct methods available,
in terms both of their practical advantages and disadvantages and of the errors
associated with them (DSIR, 1964; Cernica, 1980). It might be expected that the
clod method would give bulk densities greater than other measures of bulk density
that include interclod spaces. Generally, however, core sampling and the clod
method give similar results, while the sand replacement values are about 2% lower
(DSIR, 1964). The rubber balloon method has proved relatively unreliable, with
systematic errors of nearly 5% being found, in comparison with nearly 3% for the
sand replacement method or 0.5% when sand volume rather than mass is mea-
sured (Cernica, 1980).
All methods of bulk density measurement may be hindered by the presence
of stones, which may also create complications in the interpretation of treatment
means from field experiments (O’Sullivan et al., 1987). Keisling and Smittle
(1981) made measurements of the bulk density at which root growth was inhibited
in a soil with between 5.8 and 11% of stones of 3 to 13 mm size. They found that
bulk densities were between 0.097 and 0.12 Mg m
Ϫ3
lower when the presence of
stones was allowed for and that the corrected values corresponded to the limiting
values for root growth in stone-free soil.
Bulk Density 335
Copyright © 2000 Marcel Dekker, Inc.
IV. APPLICATIONS OF BULK DENSITY MEASUREMENTS
Many of the direct methods of bulk density measurement have been widely used
for civil engineering work, which generally results in little variation of bulk den-
sity within any sample. Here, the direct methods can be entirely appropriate. How-
ever, the limitations of all methods other than transmission methods employing
energy discrimination can be very important in agricultural soils, in which large
variations in bulk density can occur over very short horizontal and, especially,
vertical distances as a result of the localized effects of tillage and traffic. Thus thin
layers of soil of high bulk density, which may be very important in relation to such
matters as root penetration or water infiltration, may pass undetected when mak-
ing a mean bulk density measurement with such methods. Some examples of the
use of bulk density methods will now be considered.
A. Soil Compaction by Wheels
Soil compaction by a wheel may be assessed by measuring bulk density at regular
depth increments below the soil surface before the wheel runs over the soil and
then making similar measurements under the center line of the wheel rut pro-
duced. The measurements may then be graphed as the variation of dry bulk den-
sity with depth both before and after the passage of the wheel. Figure 7 shows the
results of such measurements made after the passage of an unladen tractor. Mea-
surements were made with gamma-ray transmission equipment both with and
without energy discrimination, and the data confirm that different results are pro-
duced by the two methods (Henshall, 1980). The depth interval between measure-
ments can be varied so that measurements are more intensive in the region of any
feature of interest, such as the top of a plow pan, but an interval of about 30 mm
has been found to be an appropriate compromise for general purposes (Campbell
and Dickson, 1984; Campbell and Henshall, 1984; Campbell et al., 1986).
Presentation of data at fixed depths in relation to the undisturbed soil surface
as shown in Fig. 7 is satisfactory for many purposes, but difficulties can arise
when comparisons are made of the effects of two or more vehicles, especially
when they produce wheel ruts of different depths. Henshall and Smith (1989)
developed a procedure in which the bulk density measurements are used to trace
vertical movement of the soil mass arising from compaction. Consequently, com-
parisons between treatments can be made on soil elements that originated from
the same depth in the undisturbed soil profile, irrespective of their depths in the
compacted profiles (Fig. 8).
A further limitation to the value of the information provided by Fig. 7 is
that it ignores the lateral distribution of compaction on either side of the center
line of the wheel rut, which is of particular interest when soil compaction is being
336 Campbell and Henshall
Copyright © 2000 Marcel Dekker, Inc.
studied in relation to crop growth. Such additional information can be obtained
by making a series of measurements along a transect at right angles to the wheel
rut. With such an arrangement, sampling positions can usually be no closer than
about 100 mm before probe access disturbs adjacent positions (Dickson and
Smith, 1986), but this limitation can be overcome with a two-dimensional scan-
ning gamma-ray system, making measurements on a regular grid at right angles
to the wheel rut. However, this requires the formation of carefully cut trenches on
each side of the soil sample, which is time-consuming (Fig. 9). Nevertheless, the
method can provide a detailed description of both the vertical and horizontal
variation in bulk density across the wheel track (Fig. 10). Soane (1973) used an
automated version of the method that employed energy discrimination and in
which the source and detector probes were mounted on an electrically powered
carriage. Readings were made on a 20 ϫ 20 mm grid. The test sample was 1.4 m
long at right angles to the wheel track, 0.3 m deep, and 0.3 m thick. This technique
was used on a simulated seedbed in a sandy loam, to compare the distribution of
compaction produced by a conventional tractor, the same tractor with the addition
of cage wheels, and a crawler tractor.
Bulk Density 337
Fig. 7 Variation of dry bulk density with depth below a wheel rut produced in a sandy
loam by an unladen tractor. Measurements were made with gamma-ray transmission equip-
ment both with (high resolution) and without energy discrimination. (Based on data from
Henshall and Campbell, 1983.)
Copyright © 2000 Marcel Dekker, Inc.
338 Campbell and Henshall
Fig. 8 Variation, for five treatments, of dry bulk density with (a) depth below the initial
soil surface and (b) initial depth of each soil element. (Based on data from Henshall and
Smith, 1989.)
Copyright © 2000 Marcel Dekker, Inc.
Fig. 9 Gamma-ray transmission system designed and constructed at former Scottish
Centre of Agricultural Engineering, which provides a two-dimensional scan of an undis-
turbed block of soil at right angles to a wheel rut.
Fig. 10 The variation in bulk density produced in a sandy loam by a tyre with an inflation
pressure of 84 kPa and a load of 2.47 t as measured with a scanning gamma-ray transmis-
sion system that employed energy discrimination. (D. J. Campbell and J. K. Henshall, un-
published data.)
Copyright © 2000 Marcel Dekker, Inc.