Báo cáo y học: " Use of Non-parametric Item Response Theory to develop a shortened version of the Positive and Negative Syndrome Scale (PANSS)" potx
Bạn đang xem bản rút gọn của tài liệu. Xem và tải ngay bản đầy đủ của tài liệu tại đây (1.34 MB, 63 trang )
This Provisional PDF corresponds to the article as it appeared upon acceptance. Fully formatted
PDF and full text (HTML) versions will be made available soon.
Use of Non-parametric Item Response Theory to develop a shortened version of
the Positive and Negative Syndrome Scale (PANSS)
BMC Psychiatry 2011, 11:178 doi:10.1186/1471-244X-11-178
Anzalee Khan ()
Charles Lewis ()
Jean-Pierre Lindenmayer ()
ISSN 1471-244X
Article type Research article
Submission date 14 March 2011
Acceptance date 16 November 2011
Publication date 16 November 2011
Article URL />Like all articles in BMC journals, this peer-reviewed article was published immediately upon
acceptance. It can be downloaded, printed and distributed freely for any purposes (see copyright
notice below).
Articles in BMC journals are listed in PubMed and archived at PubMed Central.
For information about publishing your research in BMC journals or any BioMed Central journal, go to
/>BMC Psychiatry
© 2011 Khan et al. ; licensee BioMed Central Ltd.
This is an open access article distributed under the terms of the Creative Commons Attribution License ( />which permits unrestricted use, distribution, and reproduction in any medium, provided the original work is properly cited.
- 1 -
TITLE: USE OF NON-PARAMETRIC ITEM RESPONSE THEORY TO DEVELOP A SHORTENED
VERSION OF THE POSITIVE AND NEGATIVE SYNDROME SCALE (PANSS)
Anzalee Khan
1, 2,4
§
Charles Lewis
1, 6*
Jean-Pierre Lindenmayer
3, 4, 5*
1
Fordham University, Department of Psychometrics, Bronx, NY, United States of America
2
ProPhase, LLC, New York, NY, United States of America
3
New York University, School of Medicine, New York, NY, United States of America
4
Nathan S. Kline Institute for Psychiatric Research, Orangeburg, NY, United States of America
5
Manahttan Psychiatric Center, Wards Island, NY, United States of America
6
Educational Testing Services, ETS, Princeton, NJ, United States of America
*These authors contributed equally to this work
§
Corresponding author: Anzalee Khan
Email addresses:
AK:
CL:
JPL:
- 2 -
Abstract
Background
Nonparametric item response theory (IRT) was used to examine (a) the performance of the 30 Positive and
Negative Syndrome Scale (PANSS) items and their options ((levels of severity), (b) the effectiveness of
various subscales to discriminate among differences in symptom severity, and (c) the development of an
abbreviated PANSS (Mini-PANSS) based on IRT and a method to link scores to the original PANSS.
Methods
Baseline PANSS scores from 7,187 patients with Schizophrenia or Schizoaffective disorder who were enrolled
between 1995 and 2005 in psychopharmacology trials were obtained. Option characteristic curves (OCCs)
and Item Characteristic Curves (ICCs) were constructed to examine the probability of rating each of seven
options within each of 30 PANSS items as a function of subscale severity, and summed-score linking was
applied to items selected for the Mini-PANSS.
Results
The majority of items forming the Positive and Negative subscales (i.e. 19 items) performed very well and
discriminate better along symptom severity compared to the General Psychopathology subscale. Six of the
seven Positive Symptom items, six of the seven Negative Symptom items, and seven out of the 16 General
Psychopathology items were retained for inclusion in the Mini-PANSS. Summed score linking and linear
interpolation was able to produce a translation table for comparing total subscale scores of the Mini-PANSS to
total subscale scores on the original PANSS. Results show scores on the subscales of the Mini-PANSS can be
linked to scores on the original PANSS subscales, with very little bias.
Conclusions
The study demonstrated the utility of non-parametric IRT in examining the item properties of the PANSS and to
allow selection of items for an abbreviated PANSS scale. The comparisons between the 30-item PANSS and
the Mini-PANSS revealed that the shorter version is comparable to the 30-item PANSS, but when applying
IRT, the Mini-PANSS is also a good indicator of illness severity.
- 3 -
Background
One of the most widely used measures of psychopathology of schizophrenia in clinical research is the
Positive and Negative Syndrome Scale (PANSS) [1,2]. The 30-item PANSS was developed originally for
typological and dimensional assessment of patients with schizophrenia [1] and was conceived as an
operationalized, change-sensitive instrument that offers balanced representation of positive and negative
symptoms and estimates their relationship to one another and to global psychopathology. It consists of three
subscales measuring the severity of (a) Positive Symptoms (seven items), (b) Negative Symptoms (seven
items), and (c) General Psychopathology (16 items). The PANSS is typically administered by trained clinicians
who evaluate patients' current severity level on each item by rating one of seven options (scores) representing
increasing levels of severity. The administration generally takes 30 to 60 minutes [1,3], depending on the
patient’s level of cooperation and severity of symptoms. The PANSS has demonstrated high internal reliability
[4,5], good construct validity [4], and excellent sensitivity to change in both short term [6] and long term trials
[7]. However, despite extensive psychometric research on the PANSS, until a recent Item Response Analysis
[IRT; 8], it was unclear how individual PANSS items differ in their usefulness in assessing the total severity of
symptoms.
Studies examining the psychometric properties of the PANSS have focused on estimates of scale
reliability, validity, and factor analysis using methods from Classical Test Theory [CTT; 9]. These methods rely
primarily on omnibus statistics that average across levels of individual variation. Commonly used reliability
statistics (e.g., coefficient alpha) may obscure the fact that scale reliability is likely to vary across different
levels of severity being measured [10]. Most important, CTT methods cannot weigh the quality of a scale as a
function of different levels of psychopathology in the measured disorder.
For unidimensional scales consisting of two or more items with ordered categorical response choices,
IRT is a very efficient statistical technique for item selection and score estimation [11, 12, and 13]. Methods
based on IRT provide significant improvements over CTT, as they model the relation between item responses
and symptom severity directly, quantifying how the performance of individual items and options (e.g., for
PANSS, severity levels range from one to seven) change as a function of overall symptom severity. As
schizophrenia is a multidimensional disorder consisting of various symptoms clusters, IRT can be used to test
each unidimensional subscale of the PANSS (i.e., Positive Symptoms, Negative Symptoms, and General
Psychopathology). IRT analyses can provide unique and relevant information on (a) how well a set of item
options assess the entire continuum of symptom severity, (b) whether scores assigned to individual item
options are appropriate for measuring a particular trait or symptom, and (c) how well individual items or
- 4 -
subscales are connected to the underlying construct and discriminate among individual differences in symptom
severity (see Santor and Ramsay [14] for an overview).
IRT can be used to select the most useful items for a shortened scale, and to develop a scoring
algorithm that predicts the total score on the full scale [15, 16]. Alternatively, previous IRT analysis of the
PANSS [8] identified some items that might be further improved for measuring individual severity differences.
The analyses showed that 18 of the 30 PANSS items performed well and identified key areas for improvement
in items and options within specific subscales. These findings [8] also suggest that the Positive and Negative
Symptoms subscales were more sensitive to change than the overall PANSS total score and, thus, may
constitute a "Mini-PANSS" that may be more reliable, require shorter time to administer, and possibly reduce
sample sizes needed for future research. Additionally, a more recent IRT by Levine and colleagues [17] showed
that the PANSS item ratings discriminated symptom severity best for the negative symptoms, have an excess of "Severe"
and "Extremely severe" rating options, and assessments are more reliable at medium than very low or high levels of
symptom severity.
The present study used IRT to evaluate the PANSS for use in assessing psychopathology in
schizophrenia by (a) examining and characterizing the performance of individual items from the PANSS at both
the option (severity) and item (symptom) levels and identified areas for improvement of the PANSS scale, by
(b) examining the ability of the three PANSS subscales to discriminate among individual difference in illness
severity, by (c) selecting the best performing items to be included in a briefer version of the PANSS and by (d)
constructing scoring algorithms using a summed score linking technique to directly compare results obtained
with the shortened scale to those of the original PANSS scale.
Methods
Data
Data was provided for 7,348 patients who met DSM-IV criteria for schizophrenia or schizoaffective
disorder, who were enrolled between 1995 and 2005 in one of 16 randomized, double-blind clinical trials
comparing risperidone, risperidone depot or paliperidone to other antipsychotic drugs (e.g., haloperidol,
olanzapine) or placebo. All studies were carried out in accordance with the latest version of the Declaration of
Helsinki. Study procedures were reviewed by the respective ethics committees and informed consent obtained
after the procedures was fully explained.
Data analysis included baseline PANSS item scores from 7,187 patients. Table 1 shows the total of
number of patients who were removed from the analyses due to diagnoses (other than schizophrenia or
schizoaffective disorder (0.04% - 1.09%)) and missing PANSS item scores (0.03%); the mean age, the gender
- 5 -
and mean PANSS total score of patients who were removed from each diagnoses group is also presented.
The low number of patients excluded assures that analyses would not be compromised by excluding these
patients.
Data source. The data were provided by Ortho-McNeil Janssen Pharmaceuticals, Incorporated, and
included a study identifier, de-identified patient number, gender, age at the time of study entry, age at the time
of onset of illness, medication to which the patient was randomized, the patient’s country of residence during
the time of participation in the study and the scores for each of the 30 PANSS items for a baseline visit. In the
interest of confidentiality, no treatment code information was included in the data, nor was there any exchange
of information that might identify either the patients or the investigative sites taking part in the studies. The
study was approved by the Institutional Review Board of Fordham University, New York.
Model Choice. Several key factors are involved in determining which model to use: (1) the number of
item response categories, (2) the construct being measured, (3) the purpose of the study and, (4) the sample
size [18]. Additionally, the nature of the construct being measured will affect the choice of the model.
To investigate the usefulness of each item, the relationship between scores assigned to an item (i.e.,
the score ‘‘option’’ chosen for a given patient at a given point in time, such as 1to 7) and the overall severity of
the illness (total subscale score) was assessed. For each item a set of Option Characteristic Curves (OCCs) is
generated in which the probability of choosing a particular response is plotted against the range of
psychopathology severity. OCCs are graphical representations of the probability of rating the different options
for a given item across the range of severity. Using OCCs, the behaviour of particular items across a range of
severity can be determined. If the probability of rating an option changes as a function of psychopathological
severity, the option is useful; that is, it discriminates differences in illness severity. To illustrate,
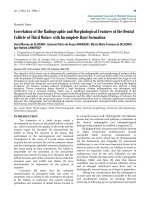
Figure 1 depicts a hypothetical “ideal” item from an item response perspective, which is characterized by a
clear identification of the range of severity scores over which an option is most likely to be rated by a clinician
(e.g., Figure 1 shows, option 1 is most likely to be rated from a score of 7 to a score of 20 on the Positive or
Negative Symptoms subscale), rapid changes in the curves that correspond to changes in severity, and an
orderly relationship between the weight assigned to the option and the region of severity over which an item is
likely to be rated. An OCC, therefore, provides a graphical representation of how informative an item (or
symptom) is as an indicator of the illness that is being measured, by expressing the probability of a particular
option being rated by a clinician, at different levels of severity.
- 6 -
For the dataset used in this analysis, the total Positive and Negative Subscale scores ranged from 7 to
45 and the General Psychopathology subscale score ranged from 16 to 80. OCCs were generated in TestGraf
[19].
Nonparametric IRT models [20, 21, and 22] provide a broad-spectrum and flexible data analysis
framework for investigating a set of polytomously scored items and determining ordinal scales for
measurement that include items that have changeable locations and sufficient discrimination power [23].
IRT models are appropriate for the analysis of questionnaire data with multiple items [23] such as the
PANSS. The data are discrete scores characterizing the ratings of
N patients to J items (items are
keyed
Jjj , 1;
=
). Many measurement instruments, like the PANSS, use items that have three or more
ordered answer categories characterized by three or more ordered scores, also called polytomous item scores.
Nonparametric IRT. A nonparametric Kernel Smoothing approach [24] to modelling responses for the
PANSS would allow for no a priori expectation about the form of rating distributions, and items with
nonmonotonic item response functions can be identified. Parametric and nonparametric approaches often lead
to similar item selection [25]. Using a nonparametric approach, an ICC can be constructed that relate the
likelihood of rating scores on each item to latent scores of psychopathology prior to examining the performance
of individual options, and OCCs relate the likelihood of rating each option on each item to latent levels of
psychopathology. Items’ OCCs and ICCs can then be examined, and items with weak discrimination can be
identified and can be considered for further item revision, or dropped from further analysis.
Approaches Used to Shorten Scales. Statistical methodologies used to shorten scales include
simple correlations and adjusted correlations between long and short forms, Cronbach’s
α
per dimension,
item total correlation and item remainder correlation for item and composite scores, and factor analysis (see
Coste et al [26] for review of methods used to shorten scales). A limitation of all these approaches is that the
scores on the shortened scales are not comparable to the scores from the original scales, because they are
not on the same metric.
Linking. Linking is a general term that refers to both equating and calibration. Whereas the
requirements for equating are stringent, calibrating two assessments of different lengths is less so, and can
easily be achieved using an IRT approach [27]. IRT is said to have a built-in linking mechanism [10]. Once item
parameters are estimated for a population with an IRT model, one can calculate comparable scores on a given
construct for patients from that population who were not rated on the same items, without intermediate
- 7 -
equating steps. Previous examples of linking have been done with the PANSS supporting the extrapolation
between PANSS and global clinical improvement and severity measures [28].
Instruments
Positive and Negative Symptoms Scale. The PANSS [1] is a 30-item rating instrument evaluating
the presence/absence and severity of Positive, Negative and General Psychopathology of Schizophrenia. All
30 items are rated on a 7-point scale (1 = absent; 7 = extreme). There are 3 subscales of the PANSS, the
Positive Symptom subscale, the Negative Symptom subscale and the General Psychopathology subscale.
The PANSS was developed with a comprehensive anchor system to improve the reliability of ratings. The 30
items are arranged as seven Positive subscale items (P1 - P7), seven Negative subscale items (N1 - N7), and
16 General Psychopathology items (G1 - G16). Each item has a definition and a basis for rating.
Rater Training. For the data being presented in this study, each PANSS rater, was required to obtain rater
certification through Ortho-McNeil Janssen Pharmaceuticals, Incorporated, and to achieve interrater reliability
with an intraclass correlation coefficient (95% CI) = 0.80 with the “Expert consensus PANSS” scores.
TestGraf. TestGraf software [19, 24] was developed to estimate parameters in IRT [29]. TestGraf was
used to estimate OCCs for nonparametric (Gaussian) smoothing kernels. This is a program for data analysis
from tests, scales and questionnaires. In particular, it displays the performance of items and options within
items, as well as other test diagnostics and utilizes nonparametric IRT techniques. Additionally, TestGraf
provides a graphical analysis of test items and/or rated responses using Ramsay's "kernel smoothing"
approach to IRT. The software, manual, and documentation are available
from
[19].
Procedure
TestGraf was used to fit the model. The highest expected total score produced by TestGraf is 45 for
the Negative subscale, 40 for the Positive subscale. The General Psychopathology subscale had the highest
expected total score of 80, at which the values of the OCCs were estimated. The estimation of the OCCs of
the expected total score of the three PANSS subscales was made using a nonparametric (Gaussian) kernel
smoothing technique [19,24] illustrated above. Examination of an item’s OCC is expected to show how each
response option contributed differently to the performance of that item [30]. The Item Characteristic Curves
(ICCs) provides a graphical illustration of the expected score on a particular PANSS item as a function of
overall psychopathology severity. ICCs were calculated in a similar manner as described above for OCCs.
Items were characterized as “Very Good”, “Good”, or “Weak” based on the criteria presented in Table 2.
- 8 -
Operational Criteria for Item Selection. Using the ideal item illustrated in Figure 1, and following
Santor and colleagues [8] operational criteria for item selection (numbers one to three presented below), items
were judged on five criteria (see Table 2).
Statistical Analyses
First, the complete dataset (n = 7,187) was randomly split into two subsamples, the Evaluation
subsample (n = 3593) and the Validation subsample (n = 3594). All data were generated for this random
sampling using SAS
®
9.3.1 [31]. The Evaluation subsample and the Validation subsample were compared for
similarities using t-tests for continuous variables and Chi-Square tests for categorical variables. The Evaluation
subsample was used for the initial 30-item IRT.
A Principal Components Analysis (PCA) without rotation was conducted to assess unidimensionality
as follows. A PCA without rotation was used as in general, an unrotated PCA is the best single summarizer of
the linear relationship among all the variables, since rotated loadings may reflect an arbitrary decision to
maximize some variables on a component while dramatically reducing others [32].: (1) a PCA was conducted
on the seven Positive Symptom items, (2) the eigenvalues for the first and second component produced by the
PCA were compared, (3) if the first eigenvalue is about three times larger than the second one, dimensionality
was assumed. Suitability of the data for factor analysis was tested by Bartlett's Test of Sphericity [33] which
should be significant, and the Kaiser-Meyer-Olkin (KMO) measure of sampling adequacy, which should be
>0.6 [34,35].
Second, the criteria presented in Table 2 were examined. OCCs were used to examine Criteria 2, 3,
and 4 presented in Table 2. For example, for Criteria 4, the options for an item are expected to span the full
continuum of severity. Some options are expected to only be scored at high levels of severity (e.g., item G6
(Depression): options 6 and 7), whereas others are expected to be scored at low levels of severity (e.g.,
options 1 and 2). If the majority of options on an item are scored at only low levels of severity or only high
levels of severity, that item was described as Weak. These items are considered Weak because they are
difficult to score or do not contribute to the overall outcome and largely insensitive to individual differences in
the lower or moderate range of symptom severity and produce floor effects. Scales comprised primarily of
Weak items are also largely insensitive to individual differences in the high range of symptom severity and
produce ceiling effects. Additional description of item selection is presented in Table 2.
Third, to confirm that most PANSS items are either Very Good or Good at assessing the overall
severity, TestGraf program was used to produce the ICCs. The ICCs provided a graphical illustration of the
expected total subscale score on a particular PANSS item as a function of overall psychopathology. ICCs were
- 9 -
examined to assess Criteria 1 and 5 in Table 2. Finally, as in parametric IRT models, the slope or steepness
of the curves indicate the item's ability to discriminate individuals along the latent continuum. Steeply
increasing curves will indicate that the likelihood of higher item scores increases in close relation to increasing
levels of psychopathology (Very Good or Good discrimination). Relatively flat curves or curves that do not
show a consistent increasing linear trend indicate that the likelihood of higher item scores does not increase
consistently as the level of psychopathology increases (Weak discrimination). The slope of the ICC was used
to assess Criteria 5 presented in Table 2.
In nonparametric IRT, the steeper a slope, the more discriminant the item is. However, there are no
specific statistical criteria to determine whether a slope is significantly steeper than another. The selection of a
slope of 0.40 would allow for greater discrimination among items. In addition to the slopes, an item biserial
correlation of items to expected total subscale scores was also produced for each item of the PANSS.
TestGraf software produces slopes and item biserial correlations. It is expected that most items (i.e., > 60%)
obtain a rating of Very Good or Good after examination of the OCCs, ICCs and item slopes for the operational
criteria presented in Table 2.
Three graphs were used to determine the sensitivity to change for each subscale: (1) the average item
information function graph, (2) the probability density function graph, and (3) the estimated standard error
graph.
The average item information function was used to determine the amount of information in the test
about severity, denoted by
)(
θ
I
This is produced in TestGraf and is a sum of item information functions
[18,24].
A plot of the probability density function indicating the relative probability that various scores will occur
was plotted to assess the score distribution of each subscale. The probability density function specifies how
probable scores are by the height of the function, and the best-known example of a density function is the
famous normal density, the “bell” curve.
Finally, for assessment of subscale performance, one of the most important applications of
)(
θ
I
was to estimate the standard error of an efficient estimate of
θ
, an efficient estimate being one which
makes best use of the information in the PANSS subscales. also produced by TestGraf [18,24].
- 10 -
Mini-PANSS
Using the IRT based methodology, an abbreviated version of the PANSS was created and scores
were linked from the Mini-PANSS to the 30-item PANSS using an IRT summed score approach [16] and linear
interpolation. Obtaining an IRT score,
θ
, corresponding to a summed score, rather than to a particular
pattern of responses, requires finding the average of a posterior distribution.
Before linking the two scales, the unidimensionality of the Mini-PANSS was assessed using PCA
without rotation, similar to the PCA conducted for the 30-item PANSS. Additionally, using the Validation
subsample, Pearson correlation coefficients between total subscale scores on the 30-item scale and total
subscale scores on the Mini- PANSS were computed. If the relationship between items (the item with item
correlation is expected to be 1.0 as the items are rated by the same rater on the same patients) and subscales
of the two instruments produce significant correlations (as identified by p ≤ 0.001) given the overlap of items,
this would suggest that the 30-item scale measures psychopathology similarly to the Mini-PANSS scale. A
Cronbach
α
≥ 0.80 for each subscale and the total scale, are expected to show similarities between the
PANSS and the Mini-PANSS.
We will be able to link the total score of the full scale PANSS, with very little bias, to scores on the
“Mini PANSS” using a summed-score IRT based methodology and linear interpolation. It is expected that the
30-item PANSS and the Mini-PANSS show statistically significant correlations and a Cronbach
α
≥ 0.80 for
each of the three subscales and total score, and that the differences in the 30-Item PANSS and interpolated
scores on the Mini-PANSS have a small range of differences (≤ 5 points) with a mean error differences ≤ 1.
Results
Subsample Comparison
Comparison of the two sub-samples (Evaluation and Validation sample) by t-test for continuous
variables and Chi-Square test,
2
χ
for categorical variables across a range of characteristics, revealed no
significant differences (Table 3).
Assessment of Unidimensionality
PCA without rotation revealed one component with an eigenvalue greater than one for the Positive
Symptoms subscale, one component with an eigenvalue greater than one for the Negative Symptoms
subscale and four components with an eigenvalue greater than one for the General Psychopathology
subscale. Bartlett's Test of Sphericity was significant (p < .001) for all three subscales and the Kaiser-Meyer-
- 11 -
Olkin (KMO) measure of sampling adequacy produced values of 0.789, 0.875, and 0.817 for the Positive,
Negative and General Psychopathology subscales, respectively. Using the criteria to assess unidimensionality
the Positive and Negative Symptoms subscales indicate unidimensionality while the General Psychopathology
subscale shows an eigenvalue on the second component of only 1.915 times larger than the first component
(see Table 4).
Positive Symptoms Subscale
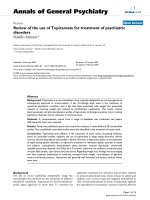
Examining Option Characteristic Curves. Figure 2 shows OCCs for items of the Positive Symptom
subscale. The OCC for option 1 (absent) was less likely to be rated than other options for patients with higher
severity scores. Option 7 (extreme) was rated infrequently, and the range of discrimination typically was above
the 95th percentile (see Figure 2) indicating option 7 is most often rated for higher levels of severity. OCCs
illustrated in Figure 2 were used to rate Criteria 2, 3, and 4 presented in Table 2.
For Criterion 2, the extent to which OCCs increase rapidly with change in overall severity was rated
“Yes,” “No” or “Somewhat” based on the probability (y-axis of Figure 2) of each option increasing as a function
of overall severity. For items, P1, P3 and P4 the probability of rating options 1 to 7 increased as severity (x-
axis: expected total score) increased and was rated as “Yes” for Criteria 2. Items P2, P5 and P6 show the
probability of ratings from options 1 to 7 to increase rapidly primarily after the 50
th
percentile of expected total
score (i.e., an expected total score of 20), and were rated as “Somewhat” for Criterion 2. In the case of P7 the
OCCs are flatter, even after the 50
th
percentile. Therefore, based on Criterion 2 and examination of the OCCs,
P7 (Hostility) does not increase rapidly with changes in overall severity, and was rated “No.”
For Criterion 3, the severity region in which each option is more likely to be rated is ordered from left to
right; the region in which option 2 is most likely to be scored should be between the regions in which option 1
and option 3 were scored. For P1, P2, P3, P4 and P6, option 2 always falls between the regions of options 1
and option 3. Additionally, option 3 falls between options 2 and 4, and option 4 falls between options 3 and 5.
OCCs for P5 and P7 were rated as “Somewhat” on Criterion 3, as a visual examination of the curve shows that
for P5, option 2 does not fall between options 1 and 3, and falls outside the curve of option 3 for lower severity
scores. For P7, option 2 (expected total score of 7 to 37) does not fall between the regions in which option 1
(expected total score of 7 to 35) and option 3 (expected total score of 7 to 35) were scored, thereby being
rated “Somewhat.”
Based on Criteria 4, the options should span the full continuum of severity from expected total scores
of seven to 40 for the Positive Symptoms subscale. An examination of the x-axis for expected total score
- 12 -
shows all items were rated from a minimum total score of seven to the maximum total score for the Positive
Symptoms subscale, and were rated as “Yes” for Criterion 4.
From examination of Figure 2 in comparison to the ideal item presented in Figure 1, it can be observed
that items P1, P3, P4 and P6 most closely resemble the ideal item. Examination of the ICCs was combined
with the results obtained for the OCCs to determine item selections for inclusion into the Mini-PANSS.
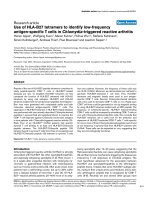
Examining Item Characteristic Curves (ICC). For Criterion 1, items for which ≥ 5 options are
scored would be rated “Yes.” For items P1, P3 and P5 of the Positive Symptoms subscale, at least six options
were selected (see y-axis to the highest point on the ICC). For example, for item P1, P3 and P5, the average
item score climbs consistently as the total subscale score increases, approaching a maximum value of six out
of the seven options. For P2, P4, P6 and P7, at least five options were selected. Therefore, for Criterion 1, a
rating of “Yes” was given for all items. The cross-hatching or bars on the ICC indicates an estimated 95%
confidence region for the true curve.
Criterion 5 of the operational criteria for item selection was identified in TestGraf by computing the
slopes for each item from the median option choice of the PANSS (i.e. option 4). For further examination, items
of the Positive Symptom subscale were ranked according to their numeric slope; the item with the largest slope
was ranked Number 1, the item with the second largest slope was ranked Number 2, and so on. This rank
ordering procedure was applied within the Evaluation subsample. For example, as shown in Table 5, item P3
was ranked first. Therefore, the item that was the most effective in discriminating individuals on the PANSS
positive subscale was item P3, representing perceptions which are not generated by external stimuli. The last
step in evaluating Criterion 5 was to determine the number of items for which the slope was ≥ 0.40. Slopes for
P1 to P6 of the PANSS Positive Symptoms subscale were ≥ 0.40 and were rated “Yes” (see Table 5 for
slopes).
Table 5 also includes the biserial correlation for each item, or the correlation between a patient’s score
on an item (option 1 to option 7) and his or her expected total score on Positive Symptoms subscale. Although
examination of the item biserial correlation is exploratory and not part of the operational criteria for item
selection, the item biserial correlations show that item P7 has the lowest correlation compared to the other
items of the Positive Symptoms subscale. The biserial correlations for the PANSS items ranged from 0.553 for
item P7 to 0.760 for item P3.
Item Selection. Global ratings of Very Good, Good and Weak, along with ratings of each of the five
criteria for the seven items of the Positive Symptoms subscale are presented in Table 6 and were summarized
- 13 -
above. Criterion 1 and 5 were based on examination of the ICCs presented in Figure 3. Criterion 2 to Criteria 4
was based on examination of the OCCs presented in Figure 2.
Negative Symptoms Subscale
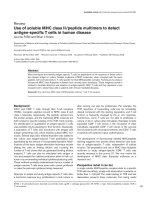
Examining Option Characteristic Curves. Figure 4 shows OCCs for items on the Negative Symptom
subscale. Option 7 (extreme) was used infrequently; the range of discrimination was above the 95th percentile
for all items, and only rated 0.1% of the time for N5 Difficulty in Abstract Thinking (Figure 4).
For Criterion 2, the extent to which OCCs increase rapidly with change in overall severity was rated
“Yes,” “No” or “Somewhat” based on the probability (y-axis of Figure 4) of each option increasing as a function
of overall severity. For items, N1, N2, N3, N4, N6 and N7 the probability of rating options 1 to 7 increased as
severity (x-axis: expected total score) increased and was rated as “Yes” for Criteria 2. In the case of N5 the
OCCs are flatter, even after the 50
th
percentile. Therefore, based on Criterion 2, N5 does not increase rapidly
with changes in overall severity, and was rated “No.”
For Criterion 3, the severity region in which each option is more likely to be rated is ordered from left to
right; the region in which option 2 is most likely to be scored should be between the regions in which option 1
and option 3 were scored. For N1, N2, N3, N4, N6 and N7, option 2 always falls between the regions of
options 1 and option 3, thereby attaining a rating of “Yes” for Criteria 3. Options for N5 were rated as “No” on
Criterion 3, as a visual examination of the curve shows that for N5, option 2 does not fall between options 1
and 3, and follows the same pattern as option 3 from the 25
th
percentile of the expected total score.
Based on Criteria 4, the options should span the full continuum of severity from expected total scores
of seven to 45 for the Negative Symptoms subscale. An examination of the x-axis for expected total score
shows that N1, N2, N3, N4, N5 and N7 were scored from a minimum total score of seven to the maximum total
score for the Negative Symptoms subscale, and were rated as “Yes” for Criterion 4. An examination of the x-
axis for the expected total score of N5 shows scoring started from a minimum expected total score of 10 and
options 6 and 7 were only scored from an expected total score of 27 to 38. Additionally, Figure 4 shows that
the probability of the OCC for item N5 is ≤ 0.3 for all options regardless of the level of severity.
Examining Item Characteristic Curves (ICC). For Criterion 1, items for which ≥ 5 options are scored would be
rated “Yes.” For all items of the Negative Symptoms subscale, at least six options were selected (see y-axis to
the highest point on the ICC). For example, for item N1, the average item score climbs consistently as the
total subscale score increases, approaching a maximum value of six out of the seven options. Similar results
are observed for all items of the Negative Symptoms subscale. Criterion 5 of the operational criteria for item
- 14 -
selection was identified in TestGraf by computing the slopes for each item from the median option choice of
the PANSS (i.e. option 4). For further examination, items of the Negative Symptom subscale were ranked
according to their numeric slope; the item with the largest slope was ranked Number 1, the item with the
second largest slope was ranked Number 2, and so on. The most effective in discriminating individuals on the
PANSS was item N6, representing a reduction in normal flow of communication. The last step was to
determine the number of items for which the slope was ≥ 0.40. Slopes for N1 to N6 of the PANSS Negative
Symptoms subscale were ≥ 0.40 and were rated “Yes.” Table 7 also includes the biserial correlation for each
item and his or her expected total score on Negative Symptoms subscale. The item biserial correlations show
the lowest correlations for item N5 (r = 0.599) and N7 (r = 0.596) compared to the other items of the Negative
Symptoms subscale. The biserial correlations for the PANSS items ranged from 0.809 for item N2 to 0.596 for
item N7.
Item Selection. Global ratings of Very Good, Good and Weak items, along with ratings of each of the
five criteria for the 7 items of the Negative Symptoms subscale were summarized above. Criterion 1 and 5
were based on examination of the ICCs presented in Figure 5. Criterion 2 to Criteria 4 was based on
examination of the OCCs presented in Figure 4. Criterion 5 was based on examination of slopes (see Table 8
for item selections for the Negative Symptoms subscale).
General Psychopathology Subscale
Examining Option Characteristic Curves. As observed with the Positive and Negative Symptoms
subscales, the OCC for option 1 (absent) also were less likely to be rated than were other for patients with
higher severity scores. Option 7 (extreme) was used infrequently; the range of discrimination was above the
95th percentile for all items.
For Criterion 2, the extent to which OCCs increase rapidly with change in overall severity was rated
“Yes,” “No” or “Somewhat” based on the probability (y-axis of Figure 6) of each option increasing as a function
of overall severity. For items, G4, G6, G7, G8, G9, G13 and G14 the probability of rating options 1 to 7
increased as severity (x-axis: expected total score) increased and was rated as “Yes” for Criteria 2. In the case
of G1, G2, G3, G11, G12, G15 and G16, the OCCs are flatter, with G1, G2, and G3 showing increases only
after the 75th percentile. Therefore, based on Criterion 2, G1, G2, G3, G11, G12, G15 and G16, does not
increase rapidly with changes in overall severity, and was rated “No” for these items. A rating of “Somewhat”
was given to G5 and G10 as these items show an increase in OCCs after the 50
th
percentile. For example, an
examination of item G12 shows that for options 1 to 7, the probability is ≤ 0.3 for the entire severity range,
- 15 -
indicating this item does not discriminate between different levels of symptom severity. Similar probabilities (≤
0.3 for across levels of severity) are seen for items G3, G15 and to a lesser extent G16.
For Criterion 3, the severity region in which each option is more likely to rated is ordered from left to
right; the region in which option 2 is most likely to be scored should be between the regions in which option 1
and option 3 were scored. For G4, G6, G7, G8, G9, and G13, option 2 always falls between the regions of
options 1 and option 3, thereby obtaining a rating of “Yes” for Criteria 3. Options for G3, G5, G10, G12, G15
and G16 were rated as “No” on Criterion 3, as a visual examination of the curve shows that for these items,
option 2 does not fall between options 1 and 3, and in some cases (e.g. G10 and G12) follows the same
pattern as option 3 from the 25
th
percentile of the expected total score. OCCs for G1, G2, G11 and G14 were
rated as “Somewhat” on Criterion 3, as a visual examination of the curve shows that for these items, option 2
does not fall between options 1 and 3, and falls outside the curve of option 3 for higher severity scores,
however, for at least four other options, the severity region is ordered left to right, thereby being rated
“Somewhat.”
Based on Criteria 4, the options should span the full continuum of severity from expected total scores
of 16 to 80 for the General Psychopathology subscale. An examination of the x-axis for expected total score
shows that G4, G6, G8, G9, G10, G12, G13, G14, and G15 were scored from a minimum total score of 16 to
the maximum total score for the General Psychopathology subscale, and were therefore rated as “Yes” for
Criterion 4. An examination of the x-axis for the expected total score of G1, G2, G3, G5, G7, G11 and G16,
shows scoring started from a minimum expected total score of 20 and for G3, options 4 to 7 were only scored
from an expected total score of 36 to 76. For example, OCCs for Items G2, G5, and G16 do not span the
continuum of possible total scores as scoring options 2 to 7 begin between the 5
th
to 25
th
percentiles. As a
result, these items were rated “No” for Criterion 4. Results indicate that these items are only rated at higher
levels of severity. It should be noted that seven out of the 16 General Psychopathology subscale items
(43.75%) rated “Yes” on Criterion 2 (i.e., G4, G6, G7, G8, G9, G13 and G14), six out of the 16 subscale items
(37.50%) rated “Yes” on Criterion 3 (i.e., G4, G6, G7, G8, G9, and G13), and nine out of the 16 subscale items
(56.25%) rated “Yes” on Criterion 4 (i.e., G4, G6, G8, G9, G10, G12, G13, G14, and G15) based on
examination of the OCCs.
Examining Item Characteristic Curves. For Criterion 1, items for which ≥ 5 options are scored
would be rated “Yes.” For items G2, G4, G6, G7, G8, G9, G10, G14, and G15 of the General Psychopathology
subscale, ≥ 5 options were selected (see y-axis to the highest point on the ICC, Figure 7); a rating of “Yes” was
given for these items. Criterion 5 of the operational criteria for item selection identified nine items with slopes <
- 16 -
0.399; these items included G1, G7, G10, G3, G11, G15, G16, G5 and G12 in order of ranking of slopes and
were rated “No” for Criterion 5. The item that was the most effective in discriminating individuals on the
PANSS General Psychopathology was item G2, representing physical manifestations of nervousness, worry,
apprehension or restlessness. The item least effective in discriminating individuals on the PANSS General
Psychopathology subscale is G12, representing impaired understanding of one’s psychiatric condition or
illness (see Table 9 for slopes).
Table 9 shows item biserial correlations with the lowest correlations for item G16 (r = 0.366) and G12
(r = 0.381) compared to the other items of the General Psychopathology subscale. The largest biserial
correlations was for item G8 (r = 0.617).
Item Selection. Global ratings of Very Good, Good and Weak items, along with ratings of each of the
five criteria for the 16 items of the General Psychopathology subscale are presented in Table 10. Although the
slope and item biserial correlation for G7 Motor Retardation is low, this item was retained for the Mini-PANSS
as ≥ 3 criteria were scored “Yes” (see Table 10).
Table 11 provides a summary of PANSS items which were rated Very Good, Good or Weak based on
the operational criteria in Table 2. Nineteen items (63.33%) were rated as Very Good or Good.
PANSS Positive Symptoms Subscale Performance
Figure 8 shows the average item information function for the Positive subscale as a function of the
total subscale score. For the positive subscale, the curve has one peak, around total score subscale scores of
8 to12, indicating that the scale is more informative for patients with lower scores, however the information
function increases again after a total subscale score of 30, indicating the subscale contains discriminating
items for patients with higher scores. Despite the peaks, the item information function is above 0.11 and below
0.20 with a difference of only 0.09 in information function.
Figure 9 shows the distribution of Positive symptom scores and that this distribution is slightly skewed
to the right, indicating that patients with very high Positive Symptoms subscale scores are rarer than patients
with low subscale scores. The lowest score, a score of 7 (vertical line), and the scores in the 15 to 24 range
are most probable.
Finally, Figure 10 shows that the standard error for a total subscale score of 17 to 34 is approximately 3.0,
which includes 70% of patients. The standard error falls below 3.0 for patients scoring below 17 and above 34
possibly due to the poor quality of information in this subscale for patients with scores at the extremes of this
subscale total score.
- 17 -
PANSS Negative Symptoms Subscale Performance
Figure 11 shows the average item information function for the Negative Symptom subscale as a
function of the total subscale score. For this subscale we see that the curve has two peaks, around the total
subscale scores 9 to 13 and then again around the total subscale scores of 36 to 42, indicating that the
subscale is more informative for patients with lower scores (9 to13) and higher scores (36 to 42). An item
information function of greater than 0.14 and less than 0.29 on the theta scale is observed for scores on the
Negative Symptom subscale.
The probability density function for the Negative Symptom subscale shows the highest peak around scores in
the 18 to 27 range indicating these score are the most probable, and that the probability trails off more
gradually above this region than below, indicating positive skewness, and is a consequence of the rating
relatively more higher scores than lower scores for this subscale (see Figure 12).
Figure 13 shows the estimated standard error or sampling standard deviation of the total score as a
function of severity. The standard error is approximately 2.4 for patients scoring in the range 15 to 37, which
includes 80% of the patient scores. The standard error falls below 2.4 for patients scoring below 15 and above
37 possibly due to the poor quality of information in this subscale for patients with scores at the extremes.
General Psychopathology Subscale Performance
Figure 14 shows the average item information function for the General Psychopathology subscale as a
function of the total subscale score. For this subscale, the curve has one peak, around the scores ranging from
22 to 32, indicating that the scale is more informative for patients with lower scores, however the test
information function increases again from a total score of 60, indicating the subscale contains many
discriminating items for patients with higher scores. Compared to the range of information function for the
Positive (0.20 to 0.09) and Negative (0.29 to 0.14) subscales, the information function for the General
Psychopathology subscale shows a smaller range from approximately 0.04 to 0.09.
Figure 15 shows the distribution of General Psychopathology subscale scores, which is slightly
skewed to the right, indicating that patients with very high General Psychopathology subscale scores are rarer
than patients with mid to low subscale total scores. The scores in the 32 to 48 range are most probable.
Figure 16 shows that the standard error for a total subscale score ranges from 1.0 to 5.0, and is above
3.0 for 95% of the sample. Smaller ranges of the standard error were observed for the Positive (< 0.01 to 3.0)
and Negative subscales (0.2 to 2.4).
Examination of the item information function, probability density function and standard error of the PANSS
subscales indicate that Positive and Negative subscales operate in a similar manner and are more
- 18 -
discriminating than the General Psychopathology subscale scores, and may be more sensitive to change than
the PANSS General Psychopathology subscale scores.
Mini-PANSS
Based on the results of the nonparametric IRT presented above, 19 items were selected for inclusion
in the Mini-PANSS. Only items selected, which were either Very Good or Good items (see Table 11). The
Validation subsample (n = 3,494) was used to examine some of the psychometric characteristics of the 19
items selected for the Mini-PANSS. As a first step, a PCA without rotation similar to the PCA performed for the
30-item scale was conducted on the abbreviated 19-item PANSS to assess unidimensionality. Second,
similarities between the two scales were examined by Pearson correlation coefficients between the 30-item
scale and Mini-PANSS scale using the Validation subsample.
The mean PANSS scores of the Validation subsample for the 19-item PANSS are as follows, Positive
subscale 17.52 (SD = 6.08) (6 to 36 score range), Negative subscale 19.01 (SD = 6.17) (6 to 39 score range),
General Psychopathology subscale, 17.54 (SD = 4.85) (7 to 33 score range), and total PANSS 54.07 (SD =
13.27) (19 to 98 score range). Using the Validation subsample (n = 3,594), Bartlett's Test of Sphericity was
significant (p < .001) for the six items of the Positive subscale, the six items of the Negative subscale, and the
seven items of the General Psychopathology subscale. The Kaiser-Meyer-Olkin (KMO) measure of sampling
adequacy produced values of 0.808, 0.858, and 0.804, for the Positive, Negative and General
Psychopathology subscales, respectively. Using the criteria to assess unidimensionality of the eigenvalue for
the first component being three times larger than the second component, the Positive, Negative and General
Psychopathology subscales all indicate unidimensionality (see Table 12). The General Psychopathology
subscale for the Mini-PANSS shows unidimensionality, compared to the assessment of unidimensionality for
the 30-item PANSS (see Table 4) which did not show unidimensionality.
Correlations were computed for the Positive, Negative, and General Psychopathology subscale
scores, along with total PANSS scores for the 30 item PANSS and the Mini-PANSS. Significant correlations
were observed between the respective subscale scores and the total scores of the two scales. Cronbach alpha
α
, between the 30-item PANSS and Mini-PANSS, ranged from .830 for the General Psychopathology
subscale, .938 for the Positive Symptoms subscale, and .991 for the Negative Symptoms subscale suggesting
that the subscales of the 30-item PANSS compared to the subscales of the Mini-PANSS all have high internal
consistency as indicated by Cronbach’s
α
≥ 0.80.
- 19 -
Summed Score Linking
The item parameters from the 30-item scale and the item parameters from the 19-item scale were
produced by TestGraf (expressed as,
θ
or IRT Score, ranging from – 3 to 3) and were used to estimate the
IRT score corresponding to each summed score for each of the three subscales for the Validation subsample.
After applying linear interpolation methods, Table 13, Table 14 and Table 15 display summed-score translation
tables for the Positive Symptoms, Negative Symptoms and General Psychopathology subscales, respectively.
IRT Score (
θ
) corresponding was converted to each expected total scores (summed score) for each subscale
of the PANSS to the Mini-PANSS subscales prior to the application of linear interpolation (see Additional file 1,
Table S1, Additional file 1, Table S2, Additional file 1, Table S3 for Conversion Table).
As a final measure of comparison between the interpolation scores of the Mini-PANSS to the 30-item
PANSS, the differences between the interpolated value from the Mini-PANSS and the actual score on the 30-
item PANSS using the Validation subsample, was computed. For Positive Symptoms subscale, the mean
difference between the interpolated score from the Mini-PANSS and the 30-item PANSS was -0.382 (– 4 to 3
range of scores). For the Negative Symptoms subscale, the mean difference between the interpolated score
from the Mini-PANSS and the 30-item PANSS was -0.398 (– 4 to 4 range of scores). For the General
Psychopathology subscale, the mean difference between the interpolated score from the Mini-PANSS and the
30-item PANSS was -0.407 (– 4 to 5 range of scores). For the PANSS total score, the mean difference
between the interpolated score from the Mini-PANSS and the 30-item PANSS was -0.428 (-4 to 5 range of
scores). The small mean differences and range of scores from the interpolated values support the similarities
with the original scale.
Discussion
The primary purpose of this study was to demonstrate that most of the items of the PANSS are Very
Good or Good at assessing overall illness severity throughout the spectrum of increasing levels of severity. A
second purpose was to create an abbreviated version of the PANSS using a nonparametric IRT in the
TestGraf software. Shortened versions of this standardized and widely disseminated scale provide an
interesting avenue, which could be more fully explored before investing resources in the development of
completely new instruments.
Our results confirmed that a majority of PANSS items (63.33%; 19 out of 30 items) are either Very
Good or Good at assessing the overall illness severity. Our results agree with the ones found by Santor and
colleagues [8] who conducted the first IRT analysis of the PANSS. Not surprisingly our present nonparametric
- 20 -
IRT showed that the Negative Symptom items (particularly, N1, N2, N3, N4, N6, and N7) showed good
discriminative properties across almost the entire range of severity (i.e. increases in symptom intensity
correspond to increases in illness severity), and it is these items that most closely approximates the “ideal”
item illustrated in Figure 1. In addition, items of the Positive Symptoms subscale, P1, P3, P5, and to a lesser
degree, P2, P4 and P6, also showed good approximation to the “ideal” item presented in Figure 1. For these
items, the probability of rating a particular option (level of severity) corresponded to a relatively well defined
and narrow range of severity.
In contrast, as demonstrated by Santor and colleagues [8] many items (P7, N5, N7, G1, G5, G6, G9,
G10, G11, G12, G13, and G15) demonstrate problematic features and some fundamental issues remain with
regard to the use of the PANSS total score as a measure of overall level of psychopathological severity in
schizophrenia. Several items from the General Psychopathology subscale failed to show good discriminative
properties across the range of severity assessed in the present study. Of the 16 items of the General
psychopathology Subscale, only seven (43.75%) were found to be either Very Good or Good and were
retained in the Mini-PANSS. For example, for item G3 (Guilt Feelings), OCCs were flat (not peaked) across
almost the entire severity range, and was dominated by a single response option throughout most of the
distribution of scores. One may argue that this is a result of the severity of the patient population used for this
study, however, the levels of psychopathology in this study ranged from the lowest levels of severity (a total
PANSS score of 32) to very high levels of severity (a total PANSS score of 161).
A consistent observation across all items was that very extreme symptomatology (option 7) was rarely
rated. Additionally, Santor and colleagues [8] and Obermeier and colleagues [36] recommended rescaling the
PANSS options as option 7 is rarely endorsed and some options present ambiguous definitions. For example,
on item P1, patients scoring at the highest range of Positive Symptoms total score were far more likely to score
a 5 or 6 on this item, suggesting that option 7 was underutilized. Additionally, a large number of items showed
an overlap in OCCs for options 3 and 4 (some examples include G2, G3, G12). These result were not
unexpected, because the definition of option 3 includes “little interference with patient’s daily functioning,’
whereas option 4 “represents a serious problem but occurs occasionally” (Kay et al., 1987). This phrasing
appears to create greater overlap as the terms “little interference” and can be difficult to differentiate from
“occurs occasionally.” Results also demonstrate overlap between a number of adjacent OCCs. In particular,
items P7, N5, G1, G3, G10, G11, and G12 display significant overlap between most options suggesting these
levels of severity are poorly differentiated. Also, results show that some items are predominantly rated at
- 21 -
higher levels of severity and do not span the entire continuum of expected scores. For example, G2, G5, and
G16, have OCCs starting from expected scores on the General Psychopathology subscale of approximately
25.
It is noteworthy that results of the current investigation offered a high degree of agreement with other
psychometric research of psychopathology in schizophrenia. Specifically, like the present IRT, previous
psychometric investigations have indicated that PANSS items P7, N5, G1, G5, G10, G11, G12, G15 either do
not discriminate well in terms of assessing overall severity or do not reflect dimensional individual differences
between patients with schizophrenia [2,8,37]. Also, like the present IRT, previous psychometric investigations
have indicated that PANSS items of N1, N2, N3, and N4 discriminate well and reflect dimensional individual
differences [19,37,38]. The present results have implications for psychopathology measurement and clinical
assessment. Researchers and clinicians evaluating psychopathology in schizophrenia using the 30-item
PANSS may choose to focus only on items that performed well in IRT analyses.
The effectiveness of item options has a direct bearing on the effectiveness of their respective item and,
therefore, on the effectiveness of the Positive, Negative, and General Psychopathology subscales. In this
case, the Negative Symptom subscale was found to provide maximum information at the low and high ends of
the construct. The low standard error of estimate supports the conclusion that these items form a well-defined
subscale. Similar observations are noted for the Positive Symptom subscale with test information functions
0.10, and better for the lower 10% and upper 5% of the severity. The General Psychopathology subscale had
the least test information function of the three subscales, ranging from 0.04 to 0.09 of the severity level.
Additionally, standard error of estimate for the General Psychopathology subscale increased progressively
from 1.0 at the lower end of the trait level up to 6.0 at the higher end of the severity level, thus indicating
increased errors of measurement along higher levels of the severity continuum. These subscale performance
results are similar to those found by Santor and colleagues [8], who observed better subscale performance for
the Positive and Negative subscales over the General Psychopathology subscale. It appears then that the two
subscale scores reflect the overall severity spectrum more appropriately than the total PANSS score. The use
of the two Positive and Negative subscales independently from the rest of the scale is seen at times in clinical
trials considering that these two symptom domains are key components of the disease [2] and which are
primarily targeted in drug development.
Although the PANSS was originally designed with three subscales (Positive, Negative, and General
Psychopathology), studies examining the internal structure of the scale [39] have all identified the same two
- 22 -
underlying factors, a positive and negative factor. Other factors have varied and included Disorganized,
Excitement, Hostility, Dysphoric, Catatonic and many more [2]. Given that OCCs depend on how symptom
severity is defined, the appropriateness of modelling of items via their subscale scores, rather than a total
PANSS score was confirmed by conducting PCA on each subscale to assess unidimensionality. The PCA of
the General Psychopathology subscale did not assume unidimensionality, which supports to some extent the
common practice in clinical trials to examine the Positive and Negative subscales independently from the rest
of the scale since these symptoms are considered a key component of the disease [2] and are symptom
clusters which are primarily targeted in drug development.
Our results of the nonparametric IRT provided valuable information regarding whether each item on
the PANSS subscales was useful in the assessment of the overall severity of schizophrenia and in scale
construct. In addition, it allowed us to select the PANSS items having utility across a broad range of illness
severity and to include them in a shortened version of the scale (termed, Mini-PANSS). The similarities and
differences between the 30-item PANSS and the Mini-PANSS were examined with a series of descriptive
analyses, including high correlations between subscale and total scores. Results of the PCA of the Mini-
PANSS assumed dimensionality for all three of the subscales. We deleted those PANSS items, which did not
appear to contribute significantly to the symptom structure of schizophrenia based on their option curves.
Exclusion of these less specific items (P7, N5, G1, G2, G3, G5, G10, G11, G12, G15 and G16) resulted in high
internal reliability between PANSS 30-item subscales and Mini-PANSS subscales, indicating that omission of
these items in future clinical trials is not likely to significantly alter the PANSS subscales. The performance of
the Mini-PANSS relative to the original by comparing correlations and reliability of the 30-item PANSS
subscales with the Mini-PANSS subscales was demonstrated by significant correlations and good reliability
between the respective subscales, and the examination of the mean score differences between the
interpolated scores and the actual PANSS scores show little bias in linking methods used.
This study illustrates a method of calibrating scales on the summed-score scale using an IRT
approach.
This method has been used in previous studies as the basis for the computation of IRT scaled
scores for each summed score [16,40,41]. Although one may argue that some loss of information follows from
the simplification of scoring from response patterns to summed scores, that loss of information is small and the
corresponding change in the reported standard error would often not result in a visible change in the number of
decimals usually reported.
- 23 -
We also developed a summed-score linking method to enable the transformation of the mini-PANSS
scores for each of the subscales to the subscale scores of the full PANSS. This linking method will allow
comparing data scored with the mini-PANSS to be transformed to the full PANSS allowing for comparison of
results from studies using the two versions of the PANSS or to transform data from one study using the Mini-
PANSS to data with the full PANSS. Future studies may benefit by incorporating a shortened version of the
PANSS based on the items that performed as Very Good and Good in the IRT analyses. For example,
abbreviating the measure in a meaningful way could serve as a screening instrument, increase rater reliability
of assessment in research settings as well as offer an objective approach to measuring psychopathology in
primary care and other clinical settings.
Limitations
First, despite its advantage as a shorter instrument, the Mini-PANSS should not be considered as a
replacement for the original scale. The decision to produce a short IRT- based form of the PANSS could be
seen as a loss of the multidimensional construct. The PANSS dimensions of Anxiety/ Depression,
Excitement/Hostility, and Cognition are not fully represented in the Mini-PANSS. Even if a theoretical criterion
was applied to select, among the most effective items, the different items that would eventually form a Mini-
PANSS, one would need to re-examine these items from a theoretical perspective. Furthermore, there are still
no definitive criteria to establish whether measures developed from IRT are theoretically and empirically
superior to instruments developed with CTT.
Second, the present sample was based on patients included in clinical trials according to specific
inclusion and exclusion criteria, and may therefore not accurately represent all patients with schizophrenia
encountered in clinical practice and not be generalizable. Because of the large number of sites and
investigators, interrater reliability among raters at different sites may not have been consistently optimal.
Third, our examination of OCCs showed that options in some items (e.g., item N5) were problematic,
and that option 7 was rarely used at all levels of psychopathology. This may reflect the fact that patients
included in clinical trials do usually not present with extreme levels of psychopathology. They could not be
recruited and adequately consented at extreme levels of item severity. On the other hand, some adjustments
may be necessary; for example, option 7 could be reformulated (e.g., combining options 6 and 7), and the
effectiveness of these modifications will have to be empirically tested.
Fourth, Cella and Chang [42] warned of the possible limitations of using IRT methods in the evaluation
of health measures since IRT methods were originally developed to be used with a fairly homogeneous
educational assessment population. When we apply these methods to more heterogeneous clinical
- 24 -
populations there may be limitations to obtain item-free estimates of sample latent traits. Cella and Chang [42]
also remarked that the context, selection and sequence of items, considering both item diversity and clinical
diversity, may produce sample-dependent item difficulty estimates and, therefore unreliable item-dependent
estimates of patients’ severity of illness. The continuous monitoring of item calibrations involved in the process
of item banking will help to solve these uncertainties.
Finally, the full range of psychometric properties of the Mini-PANSS needs to be carefully studied
before this new scale can be clinically used. We are presently planning to test these properties. For example,
further examination of validity, reliability, sensitivity, specificity, schizophrenic categories and assessment of
cut-off scores for the Mini-PANSS can be examined in a clinical trial framework.
Conclusions
The primary purpose of this study was to demonstrate the utility of non-parametric IRT in examining
the item properties of the 30 PANSS items and to select items for an abbreviated PANSS scale. We also
provide a scoring algorithm for comparing total and subscale scores on the full scale to the total and subscale
scores of the abbreviated scale. The comparisons between the 30-item PANSS and the Mini-PANSS revealed
that the shorter version, when applying IRT, is also a better indicator of the latent trait, i.e. psychopathology
severity.
One of the implications of our results is that some of the PANSS items need to be better defined in
terms of item options and that it is possible to develop a shorter scale based on sound psychometric
procedures. The availability of a Mini-PANSS will offer reduced administration time resulting in less clinician
and patient burden during participation in clinical trials and in clinical practice. Future studies will focus on
examining the psychometric properties of the mini-PANSS and on the improvement of some of the weaker
PANSS items.
Competing interests
Financial competing interests
• In the past five years AK, CL or JPL have not you received reimbursements, fees, funding, or salary
from an organization that may in any way gain or lose financially from the publication of this
manuscript, either now or in the future.
• AK, CL or JPL do not hold any stocks or shares in an organization that may in any way gain or lose
financially from the publication of this manuscript, either now or in the future.