báo cáo khoa học: " A cluster randomized controlled trial aimed at implementation of local quality improvement collaboratives to improve prescribing and test ordering performance of general practitioners: Study Protocol" docx
Bạn đang xem bản rút gọn của tài liệu. Xem và tải ngay bản đầy đủ của tài liệu tại đây (297.73 KB, 14 trang )
BioMed Central
Page 1 of 14
(page number not for citation purposes)
Implementation Science
Open Access
Study protocol
A cluster randomized controlled trial aimed at implementation of
local quality improvement collaboratives to improve prescribing
and test ordering performance of general practitioners: Study
Protocol
Jasper Trietsch*
1
, Trudy van der Weijden
1
, Wim Verstappen
2
, Rob Janknegt
3,4
,
Paul Muijrers
3
, Ron Winkens
1,5
, Ben van Steenkiste
1
, Richard Grol
1,6
and
Job Metsemakers
1
Address:
1
Maastricht University, Dept. of General Practice, School for Public Health and Primary Care (CAPRHI), Maastricht, The Netherlands,
2
GP out-of-hours centre, Den Bosch/Eindhoven, the Netherlands,
3
OWM Centrale Zorgverzekeraars group, Zorgverzekeraar UA, Tilburg, The
Netherlands,
4
Maasland Hospital, Sittard, The Netherlands,
5
Diagnostic Centre and department of Integrated Care, Maastricht University Medical
Centre, Maastricht, The Netherlands and
6
Radboud University Nijmegen Medical Centre, Centre for Quality of Care Research, Nijmegen, The
Netherlands
Email: Jasper Trietsch* - ; Trudy van der Weijden - ;
Wim Verstappen - ; Rob Janknegt - ; Paul Muijrers - ;
Ron Winkens - ; Ben van Steenkiste - ; Richard Grol - ;
Job Metsemakers -
* Corresponding author
Abstract
Background: The use of guidelines in general practice is not optimal. Although evidence-based methods to improve
guideline adherence are available, variation in physician adherence to general practice guidelines remains relatively high.
The objective for this study is to transfer a quality improvement strategy based on audit, feedback, educational materials,
and peer group discussion moderated by local opinion leaders to the field. The research questions are: is the multifaceted
strategy implemented on a large scale as planned?; what is the effect on general practitioners' (GPs) test ordering and
prescribing behaviour?; and what are the costs of implementing the strategy?
Methods: In order to evaluate the effects, costs and feasibility of this new strategy we plan a multi-centre cluster
randomized controlled trial (RCT) with a balanced incomplete block design. Local GP groups in the south of the
Netherlands already taking part in pharmacotherapeutic audit meeting groups, will be recruited by regional health
officers. Approximately 50 groups of GPs will be randomly allocated to two arms. These GPs will be offered two different
balanced sets of clinical topics. Each GP within a group will receive comparative feedback on test ordering and prescribing
performance. The feedback will be discussed in the group and working agreements will be created after discussion of the
guidelines and barriers to change. The data for the feedback will be collected from existing and newly formed databases,
both at baseline and after one year.
Discussion: We are not aware of published studies on successes and failures of attempts to transfer to the stakeholders
in the field a multifaceted strategy aimed at GPs' test ordering and prescribing behaviour. This pragmatic study will focus
on compatibility with existing infrastructure, while permitting a certain degree of adaptation to local needs and routines.
Trial registration: Nederlands Trial Register ISRCTN40008171
Published: 17 February 2009
Implementation Science 2009, 4:6 doi:10.1186/1748-5908-4-6
Received: 1 October 2008
Accepted: 17 February 2009
This article is available from: />© 2009 Trietsch et al; licensee BioMed Central Ltd.
This is an Open Access article distributed under the terms of the Creative Commons Attribution License ( />),
which permits unrestricted use, distribution, and reproduction in any medium, provided the original work is properly cited.
Implementation Science 2009, 4:6 />Page 2 of 14
(page number not for citation purposes)
Background
With the ever-growing volume of evidence from medical
research, it has become impossible for physicians to
remain fully up to date. Reviews and guidelines therefore
summarize large quantities of information, making it
more easily available to field workers. In the Netherlands,
general practitioners (GPs) now have access to more than
80 evidence-based medical guidelines developed by the
Dutch College of General Practitioners (NHG). Although
general adherence to these guidelines is approximately
70%, the inter-physician variation is large, and adherence
to certain aspects of these guidelines proves to be difficult
[1-3]. Although there may be sensible reasons to deviate
from guidelines, such as multi-morbidity in a patient, a
physician's level of uncertainty tolerance and patients'
preferences, there seems to be room for improvement. The
inter-physician variation can be regarded as underdiag-
nosing or undertreating one group of people and at the
same time overdiagnosing and overtreating another
group, both leading to inappropriate care [4]. There is
considerable inter-physician variation in general practice
with regard to test ordering and prescribing [5,6].
Many studies have tried to find evidence for effective
implementation strategies to improve quality of care. A
multifaceted clustered RCT by Verstappen et al. aimed at
optimizing GPs' test ordering behaviour by means of local
quality improvement collaboratives (LQICs), found a
decrease of 8 to 12% in test volumes over a period of six
months [7]. This strategy was tested using six topics for
continuing medical education (CME). Other studies have
tested several implementation strategies to improve test
ordering and prescribing behaviour. Passive dissemina-
tion of guidelines or recommendations does not seem to
influence test ordering behaviour. Audit and feedback
have often been used and showed mostly a modest effect
in terms of influencing test ordering or prescribing. The
effect of audit and feedback on adherence to desired prac-
tice ranged from -10% to +68% (median +16%) [8-12]. In
other studies, the introduction of a problem-based test
ordering form proved to be a promising tool to improve
test ordering [7,13-18]. Similar effects on volumes of tests
ordered as those in the Verstappen study have been found
for more or less similar multifaceted implementation
strategies [19,20]. Small group peer review using direct
individual feedback seemed to reduce inappropriate pre-
scribing [12,21,22]. Lagerlov found a 6 to 13% improve-
ment in adherence to guidelines for the prescription of
anti-asthmatic drugs and antibiotics for urinary tract
infections in an RCT using reflection on guidelines and
prescription feedback in small groups [23].
The Cochrane Effective Practice and Organization of Care
group (EPOC) systematically reviews studies on imple-
mentation strategies to improve quality of care. Their
work has generated the general insight that multifaceted
strategies are usually more effective than single interven-
tions [12,24], although this was not entirely confirmed by
an NHS HTA review by Grimshaw et al. [16]. The prevail-
ing insight is that the effect of an intervention is larger
when tailored strategies are used and when barriers to and
facilitators of change are addressed.
Grol has identified in his model of effective implementa-
tion six stages in quality of care improvement[25]. In the
first stage, new research findings, new guidelines, experi-
enced weaknesses, or best practices create an opportunity
for quality improvement. In the second stage, after the ini-
tial implementation process has been planned, targets for
improvement or change are set. Prior to the actual imple-
mentation, the performance, target group, and setting are
analysed. In the fourth stage, the strategies that are to be
used are identified and tested. The implementation is
developed, tested, and executed. Finally, the implementa-
tion is evaluated and adapted, if necessary [25]. The
present study will deal with the actual sustainable transfer
of a successful implementation strategy to the field. We
are not aware of published studies testing this process, or
whether effects are sustainable when transferred to the
field. Nor are we aware of published studies on the imple-
mentation of a large-scale strategy aimed at influencing
both the test ordering and prescribing behaviour of GPs
simultaneously, using peer review and social influencing
in primary care collaboratives.
In the Netherlands, existing networks of pharmacothera-
peutic audit meetings (PTAM) can be used to disseminate
and implement guidelines on test ordering and prescrib-
ing. The goal of setting up these meetings by primary care
providers was to improve the quality of their prescribing
behaviour [26]. The local groups usually consist of six to
ten GPs with affiliated community pharmacists [27]. Dur-
ing the meetings, they discuss the choice of drugs in the
context of a specific illness or disease. In recent decades,
this form of CME has gained widespread acceptance
amongst GPs and policymakers in the Netherlands. How-
ever, these sessions tend to offer little or no room for dis-
cussions on test ordering. Because no other system of
regular meetings exists, the possible underuse, overuse,
and misuse of diagnostic services is not discussed by pri-
mary care providers on a regular basis.
The Dutch Institute for the Proper Use of Medicine (DGV)
supports and initiates local or regional implementation of
quality improvement projects on the use of drugs and sup-
ports local PTAM groups by supplying them with informa-
tion and educational materials [28]. Performance levels of
PTAM groups are assessed once a year and rated on the
basis of four levels, level one being the poorest level of
performance and level four the highest. We will use this
Implementation Science 2009, 4:6 />Page 3 of 14
(page number not for citation purposes)
division into levels as a parameter for pre-randomization
stratification.
Participation in PTAM groups by GPs is facilitated by
national and regional support organizations for primary
care, as well as by the government and through incentives
by insurance companies. Attendance at PTAM meetings is
rewarded by accreditation. Currently, approximately 50%
of the group meetings reach the desired level of perform-
ance described by policymakers [27]. To reach this level,
groups must at least use feedback on prescribing, create
working agreements, discuss barriers to change, and eval-
uate working agreements. Most groups are stable and
remain together for 10 years or more, with members
mostly being replaced gradually [27]. Because of the
nature and stability of these groups, they provide an excel-
lent and safe environment for participants to discuss their
own behaviour and barriers to change. We expect this
existing system of PTAM groups will ensure sustainability
of the implementation itself. Therefore, we plan to use
these groups in a large pragmatic trial on the implementa-
tion of guidelines, using the strategy previously tested by
Verstappen et al. [7]. However, we will expand the strat-
egy, using social interaction and external influencing as
key approaches for establishing behavioural change, to
both test ordering and drug prescribing. In our view, the
groups will no longer function merely as a PTAM group,
but rather begin acting as LQICs. This trial is expected to
show whether the effects found in less pragmatic trials can
be confirmed. Aiming at both test ordering and drug pre-
scribing, our combination strategy could lead to an even
larger effect because of synergy. We will also evaluate the
costs of implementing the strategy on a large scale.
Objectives and research questions
Hypotheses
We expect that the transfer of the strategy of LQICs to
stakeholders in the field will be feasible. We hereby hope
to create a solid basis for continuation after the end of the
study.
We also expect that large-scale implementation, giving
attention to both test ordering and prescribing behaviour,
will lead to similar changes in performance as those found
on test ordering in the trial by Verstappen et al. [7].
Successful implementation will be positively related to
the level of group performance of the groups included, in
terms of level of attendance, number of meetings, drawing
up working agreements, discussing barriers to change, and
evaluating working agreements.
Objectives
1. To implement the LQIC strategy in the south of the
Netherlands, stimulating the relevant parties in the field
to take the lead.
2. To determine the critical conditions for effective nation-
wide implementation.
3. To improve the level of group performance in the par-
ticipating groups.
4. To reduce undesirable physician variation in test order-
ing and prescribing; and to reduce underuse or overuse of
specific tests and drugs.
5. To examine the costs of large-scale implementation of
this strategy, and thus to be able to predict future costs for
expansion and maintenance of the strategy.
Research questions
Process
1. Was the strategy implemented as planned?
2. What were the barriers to and facilitators of the imple-
mentation of the strategy?
3. Has the level of group performance been improved in
the participating groups?
Effect
1. Do the volumes of tests ordered and drugs prescribed
change in the preferred direction, as described in the
working agreements of the LQICs, compared to baseline?
2. What is the effect of this strategy on GPs' test ordering
and prescribing behaviour in terms of interphysician var-
iation and total volumes of tests and prescriptions with
respect to specific clinical topics, compared to that among
GPs exposed to the same strategy but for other topics?
3. Is any gain in the level of group performance predictive
of the effect achieved?
Cost
What are the costs of implementing the strategy?
Methods
Design and ethics
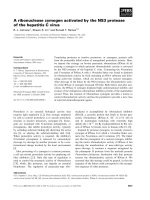
This multi-centre study will use a balanced incomplete
block design, consisting of two arms (Figure 1). LQICs
will be allocated at random to one of these two arms. All
LQICs allocated to arm A will receive the intervention
with respect to the clinical topics associated with arm A.
All LQICs allocated to arm B will receive the same inter-
vention, but with respect to the topics associated with arm
B (table 1). Each arm will have five different CME topics
to choose from. Each LQIC will choose three different
topics for their discussions, and serve as a control for the
other arm. The GPs will not be aware of the topics they are
serving as controls for, to avoid the Hawthorne effect [29].
Implementation Science 2009, 4:6 />Page 4 of 14
(page number not for citation purposes)
The Maastricht Medical Research Ethics Committee has
approved this study. All participating GPs will be asked to
sign a written informed consent form.
Population
LQIC groups will be recruited by regional medical coordi-
nators, which are regional health officers or managers
often employed by regional hospitals or primary care lab-
oratories. We have identified 24 organizations offering
diagnostic facilities in the south of the Netherlands. All
organizations will be visited by the researcher and asked
to cooperate. Each medical coordinator then will be asked
to recruit two to four LQIC groups. They will only be
included when all group members consent to participate.
The area from which groups can be recruited will be
restricted to the three southern provinces of the Nether-
lands (Limburg, Noord-Brabant, and Zeeland) because
these are covered by the insurance companies who pro-
vide data for the pharmaceutical database at Maastricht
University (UM). A representative with special expertise in
and knowledge of diagnostic testing, recruited by the
medical coordinator, will attend each LQIC meeting. This
representative will receive copies of the feedback forms of
all GPs in a LQIC, to enable him or her to prepare the ses-
sions. The representative will act as a moderator during
the sessions devoted to diagnostics, after having been
trained to do so (see under 'training'). The medical coor-
dinator will finally also liaise between their diagnostic
centre and the research team. Other stakeholders in our
strategy include community pharmacists, UM, the DGV,
insurance companies, PTAM groups, and individual GPs.
Community pharmacists play a major role in PTAMs in
the Netherlands, providing expertise and sometimes feed-
back on prescriptions to the participating GPs. Our inter-
vention will leave the role of the pharmacists more or less
unchanged. They provide easily accessible knowledge for
GPs, thus breaking down barriers which might be inher-
ent in distance support such as academic detailing. Like
the medical coordinator, a pharmacist will function as a
moderator in the LQIC. All community pharmacists will
receive training prior to the first session, as described
above. The pharmacists will receive copies of the feedback
forms of all participating GPs in a group, to enable them
to prepare the sessions.
The initiator of this trial is the Department of General
Practice of Maastricht University. The design and mainte-
nance of the database on diagnostics and the data gather-
ing process are coordinated by the first author. The
Maastricht University Centre for Information and Data
Management (MEMIC) will host the diagnostics database,
as they already do for the prescriptions database.
Randomization
LQIC groups will be randomized as such (cluster ran-
domisation). The intervention is aimed at these groups.
Pre-randomization stratification will be performed on
group size and level of group performance using a pre-ran-
Table 1: Modules and distribution over the research arms.
Modules
Topic Examples of tests Examples of drugs
Arm A Hypercholesterolaemia LDL Statines
Anaemia haemoglobin ferro medication
Rheumatic complaints Waaler-Rose NSAIDs
Urinary tract infections Urinary cultures Antibiotics
Prostate complaints PSA α-blockers
Arm B Type 2 Diabetes Mellitus HbA1c Metformin
Dyspepsia gastroscopy proton-pump inhibitors
Chlamydia infections chlamydia cultures Antibiotics
Thyroid problems TSH Levothyroxine
Perimenopauzal complaints FSH Estradiol
For a complete list of all tests and drugs for the modules [See additional file 2]
Implementation Science 2009, 4:6 />Page 5 of 14
(page number not for citation purposes)
Flowchart of randomization and interventionFigure 1
Flowchart of randomization and intervention.
50 groups
R
Baseline
measurements
on all topics
Baseline
measurements
on all topics
Baseline
Intervention on
topics from
arm A, no
intervention on
topics from
arm B
Intervention on
topics from
arm B, no
intervention on
topics from
arm A
Follow-up on
all topics
Follow-up on
all topics
Arm A Arm B
Intervention
Follow-up
stratification
Implementation Science 2009, 4:6 />Page 6 of 14
(page number not for citation purposes)
domization questionnaire [See additional file 1] prior to
the intervention. The levels of group performance are as
determined by DGV [28]. This level is a known con-
founder for an effective intervention on medical educa-
tion among groups of GPs [30,31]. After stratification, all
groups within a stratum will be randomly allocated to
either arm A or arm B (Figure 1).
Sample size
A sample size calculation is not really possible before-
hand, because it is not yet known what working agree-
ments will be created and with respect to what tests or
drugs. The specific targets, incorporated in working agree-
ments will probably be based on extreme overuse or
underuse of certain tests or drugs by some or all group
members. It is possible, for instance, that the group will
decide to eliminate a particular obsolete test or drug or
create a working agreement to decrease or increase the
mean volume of tests ordered or drugs prescribed by 20%,
from 35% to 55%.
The sample size calculation used in this trial is as follows:
to detect an improvement of 20% in a certain target
between groups, assuming an ICC of 0.10 [5], an alpha of
0.05 and a beta of 0.1 and a mean group size of seven, 44
LQICs would be needed. Anticipating a dropout of 10%,
we would need to recruit 50 groups. A population this
large would account for approximately 900,000 registered
patients.
Intervention
Several theories have been postulated on how change in
healthcare can be accomplished, and how effective change
strategies can work in implementation of innovation. In
cognitive theories, professional behaviour is considered
to result from rational processes and experiences from ear-
lier caseloads. In social interaction theories, change of
professional behaviour is thought to be strongly mediated
by peers in a group, the strength of inter-individual ties
within groups, the existence of opinion leaders, and how
much the desired behaviour is consistent with, and fits in,
everyday practice. In total quality management theories,
the use of systematically gathered data is considered to be
crucial to facilitate effective professional development.
These data can then be used in plan-do-study-act cycles
(PDSA cycles) to provide insight into displayed behaviour
and help identify areas where improvement is possible.
This leads to the description of targets. These theories may
overlap or may be complementary. In implementation
science, the use of these theories as a framework is consid-
ered obligatory [32]. This intervention therefore will be
multifaceted and consist of audit, comparative graphical
feedback, and small group work with peer review of each
other's performance, discussion of barriers to change,
reaching agreement on future policy, and testing the
agreement. After randomization to arm A or B, each group
can choose from the corresponding set of five clinical top-
ics allocated to that arm, to decide which three topics they
want to discuss. Two balanced sets of topics, one for each
arm, have been defined by the researchers. Each set con-
sists of three major topics, from which the group has to
choose two, and two minor topics, one of which has to be
chosen. Thus, each LQIC will be asked to complete the
entire strategy for three clinical topics of their choice dur-
ing the intervention period. They are free to schedule extra
meetings on topics not included in this trial, but these
meetings will not be included in the final analysis. Feed-
back on the topic under discussion will be sent to the
medical coordinator (diagnostic feedback) or local com-
munity pharmacists (prescription feedback) two weeks
prior to the test ordering or the prescribing session of the
LQIC, together with the relevant educational materials
(see under 'clinical topics'). The first session, which will
last approximately 90 minutes, will address the diagnostic
test ordering behaviour of the individual GPs and will
have the structure described under 'session structure'
(Table 2). During this session, the GPs will discuss their
diagnostic test ordering patterns and relate them to the
guidelines provided. Individual and group working agree-
ments will be created after barriers to change have been
discussed. The second session will have the same struc-
ture, but the subject for discussion will be physicians' pre-
scribing performance. This session will end by creating
group and individual working agreements about preferred
medication. Barriers to change from an individual per-
spective will again have to be discussed. After this first
topic has been completed, the cycle will be repeated, for a
new topic, as shown in Table 3. At the start of this new
cycle, the group will reflect on the previous agreements,
and revise them if necessary. The working agreements will
then be prepared for further dissemination in the prac-
tices. Each session will be chaired by a member of the
LQIC itself. When test ordering is discussed, a local repre-
sentative from the diagnostic centre will be present, while
a local community pharmacist will be present when phar-
macotherapy is discussed. They will act as moderators, not
as chairpersons.
We will test the model and the logistics needed prior to
the large-scale implementation. We plan to do this in a
small pilot study involving five groups of GPs. This pilot
study will run for four months, during which period the
participating GP groups will schedule two meetings. Each
session will be structured according to the method pro-
vided by the researchers. The first session will address test
ordering, while the second session will address prescrib-
ing. For reasons of efficiency, a set of only three topics will
be used for the pilot study. The topics, which have been
proposed by the project team members, are anaemia, dys-
Implementation Science 2009, 4:6 />Page 7 of 14
(page number not for citation purposes)
pepsia, and asthma in combination with chronic obstruc-
tive pulmonary disease (COPD).
Clinical topics
The set of clinical topics the GP groups can choose from
in the main study has been proposed by the authors. After
eligible topics were selected and divided over the two trial
arms, both arms were balanced in terms of the weight of
the topics. The weight depends on the prevalence of the
underlying disease and whether the emphasis within the
topic is on either the volume of tests ordered or the drugs
prescribed. The two sets of topics are also balanced in
terms of subjects, emphasising diagnostic or prescribing
features (Table 1). Each topic includes a number of tests
[See Additional file 2] and drugs [See Additional file 3]
predefined by the project group. For the purpose of feed-
back and education, these include both well-accepted and
commonly not accepted (or even obsolete) tests and
drugs. Educational materials on each topic will be based
on the relevant national primary care guidelines from the
Dutch College of General Practitioners, guidelines from
the Dutch Institute for Healthcare Improvement (CBO),
and international guidelines if applicable. Guidelines will
be read and 'condensed' into short versions called mod-
ules. These modules have been drafted by one of the
authors (JT) and then commented on by an expert on the
topic. Indicative prices for each test and drug will be pro-
vided, as well as a short description of its values and draw-
backs, given the indication. Each module will consist of a
maximum of six easily searchable pages.
Extraction of feedback data
Data on test ordering behaviour will be extracted by the
regional coordinators from the various databases availa-
ble at the participating hospital laboratories or primary
care diagnostic centres. Each centre will receive a data fact
sheet prescribing the required data format. This format is
based on rational criteria for laboratory test registration to
facilitate the integration of the individual databases into
one main database. All datasets on diagnostics will be
combined into one newly formed database, to be main-
tained by UM (Figure 2). Data on prescribing behaviour
will be extracted from the databases of health insurers and
collected into one database, as has already been done at
our institute. This database consists of the reimburse-
ments for prescriptions written by GPs for approximately
5.5 million persons in the south of the Netherlands. Feed-
back will then be derived from the two main databases
and processed into graphical comparative feedback
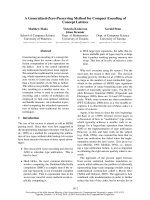
reports. Data will be presented as the volume of tests
ordered (e.g., haemoglobin) or defined daily dosages
(DDDs) prescribed per 1000 patients per six months. Par-
ticipating GPs will receive their data as clustered column
charts, each cluster presenting the data for the individual
GP, the practice in which he or she works, the small group
Table 2: Session structure
90 minutes 5 min Explaining the method/reflection on previous topic
5 min Critical look at participants' own feedback
5 min Pairwise/group discussion on inter-individual differences
25 min Plenary discussion, relating feedback to guidelines
10 min Pairwise discussion on barriers to change
25 min Plenary discussion on barriers to change, aimed at problem solving
15 min Drawing up individual and group working agreements
Table 3: Example of a schedule for the intervention
Topic GPs Medical coordinator Community pharmacist
1. Anaemia 1. Meeting on tests Moderator Prepares second session
2. Meeting on drugs Prepares third session moderator
2. Chlamydia infections 3. session on test and drugs (anaemia)
1. session on tests (Chlamydia)
moderator Present as expert
Implementation Science 2009, 4:6 />Page 8 of 14
(page number not for citation purposes)
and the wider region. An example of such a graphical feed-
back report is shown in Figure 3.
LQIC meeting structure
Each meeting will be structured according to a uniform
schedule. After participants have studied the feedback in
pairs or as a group, they will discuss it. Subsequently, the
guidelines as described in the educational materials will
be discussed in relation to the feedback. A plan will then
be formulated to improve the test ordering or prescribing
behaviour. The next step will involve addressing and dis-
cussing all the barriers to change at individual and group
levels. Finally, working agreements will be created regard-
ing test ordering and prescribing behaviour for the tests
and drugs discussed. A standardized group meeting struc-
ture card will be provided to each LQIC, showing the
structure as recommended by the researchers. However,
groups will be free to adapt the structure to their own pref-
erences or needs.
Training
The participating medical coordinators and local commu-
nity pharmacists will be trained prior to the first LQIC ses-
sion, in a two- to three-hour standardized training session
covering three main subjects. The first subject will involve
an explanation of the structure of the trial, the objectives,
the development of the outlines, the source of the feed-
back data, and the process of data gathering. The second
subject will be the preferred structure for the meetings, the
tools that are to be used, how to read the feedback reports
and relate the feedback to the guidelines. The final subject
of the training session will be how to act as a moderator
instead of a chair during a meeting. Training sessions will
partially be constructed like a LQIC meeting, with the
trainees acting as GPs and the trainer as the moderator.
Variables
Outcome measures
Process evaluation
1. The performance level of the small group collaborative.
Data and Knowledge flowchartFigure 2
Data and Knowledge flowchart.
Implementation Science 2009, 4:6 />Page 9 of 14
(page number not for citation purposes)
2. Process data such as attendance at meetings, actually
creating working agreements, following the LQIC strategy,
the number of groups that complete participation, and
the number of regions actually participating.
Effect evaluation
1. The volumes of particular tests ordered and particular
drugs prescribed for which the group has agreed that
change, either decrease or increase, would be necessary.
2. The total volumes of tests ordered and drugs prescribed
by the participating GPs for the clinical topics chosen.
3. The inter-physician variation in test ordering and pre-
scribing behaviour for the clinical topics chosen.
Cost evaluation
The costs of implementing the LQIC strategy.
Explanatory variables
We will monitor data that are known to moderate quality
assurance strategies. Therefore the following data will be
gathered prior to the intervention: group size, age and
gender of GPs, type of practice, number of patients regis-
tered with the practice, number of patients a GP is
accountable for, number of working hours a week per GP,
number of working hours a week for the group practice as
a whole, distance to the hospital/diagnostic centre,
responsibility for training GP trainees, total number of
GPs collaborating in the practice, whether a GP admits
sales representatives from pharmaceutical firms and if so
how often, involvement in developing national guide-
lines, and GPs field(s) of special expertise.
All medical coordinators will be asked if problem-based
test ordering forms are used in their region and to send us
a copy of such a form.
Measurements
Prior to randomization, the chair of the group will be
asked to fill out a short pre-randomization form, with
which we will be able to determine the number of GPs in
the group and be able to assess the level of group perform-
ance [See Additional file 1]. Data on test ordering and pre-
scribing behavior will be extracted from the existing
databases at baseline (t = 0) and t = 6 months, t = 12
months and t = 18 months. The dataset obtained at t = 0
and the final set will be used for a before-after analysis. A
new questionnaire will be sent to the chair, assessing the
level of group performance after the intervention. After
each meeting, the chair will be asked to fill out a form
with questions about the structure of the session, whether
Example of a graphical comparative feedback sheetFigure 3
Example of a graphical comparative feedback sheet.
module A, July-Dec 2007
0
10
20
30
40
50
60
70
80
t
e
s
t
A
t
e
s
t
B
t
e
s
t
C
per 1000 patients
GP
practice n=2
group n=10
region n=30
Implementation Science 2009, 4:6 />Page 10 of 14
(page number not for citation purposes)
working agreements were created, whether barriers to
change were discussed and if so what the nature of these
barriers was, what educational materials were used, and
the group members' experiences with the strategy.
The process of implementing the strategy in the south of
the Netherlands will be monitored. Participants will be
questioned about their experiences with the strategy. Par-
ticipating GPs will be asked to report their experiences
with the strategy, and to provide us with the necessary
details on the sessions they have attended. After each ses-
sion, the targets set by each group will be recorded.
Analysis
Analysis will be based on the intention-to-treat principle.
Data on GPs lost to follow-up will be extracted from the
various databases if possible.
We will analyse covariance using test and drug volumes
during the intervention period as the dependent variables,
and the baseline data and the explanatory variables as
independent variables. The analysis will be repeated using
proportions stemming from prescription performance
indicators, if available. The unit of allocation to the trial is
the LQIC. In larger practices with more than one GP, not
all volumes of tests ordered and drugs prescribed will be
traceable to an individual GP. In these cases, the unit of
analysis will be the practice as a whole. Because of this
unit of analysis error, the data will be analysed using mul-
tilevel modelling. Data on drugs and tests will be clustered
to individual GPs at level one, the practice at level two, the
LQIC at level three and the region at level four.
The nature of this study makes it difficult to blind the par-
ticipants, except for the tests or drugs serving as controls
in the other arm. The data analyst will be blinded for the
allocation result. Costs of the intervention will be calcu-
lated. A cost-effectiveness analysis will be based on these
figures. We will use cost minimization analysis from a
societal perspective, assuming that the strategy will reduce
redundant testing and prescribing. If there are signs of
improvement of care (higher scores on the performance
indicators), the impact on health may be estimated by
modelling the future gains and benefits. Data include
costs of coordinating the strategy by the regional contact
group, of preparing feedback reports and of chairing the
GP groups. The costs of the entire test ordering strategy by
Verstappen were 554.70 per GP per six months (three
meetings). The major part of the cost of this strategy con-
sisted of opportunity costs, viz the costs of the GPs' time
spent attending the session. Because GPs were already
attending these meetings and were financially compen-
sated, it seems fair to ignore the opportunity costs. This
results in costs of the test ordering strategy of 92.70. The
gains obtained by improving test ordering behaviour were
301.00 per GP per six months. Introducing the test order-
ing strategy would save 208.30 (92.70 to 301.00) per GP
per six months [33]. Because prescribing costs are higher,
the cost reductions gained by reducing superfluous pre-
scribing should also be higher.
Time schedule
The intervention period will start in September 2007 and
run through the spring of 2009. Process evaluation will
start when all groups are included. During the interven-
tion, new datasets will be obtained every six months in
order to keep the databases up-to-date for future use in
new sessions.
Discussion
To our knowledge, few studies have been published on
the transfer of effective implementation strategies to the
field. Our strategy has proved to be effective in an earlier
trial on test ordering by GPs in the Netherlands. However,
because this strategy was disseminated and controlled by
academics, it remains unclear how large its effect will be
when transferred to the field. We set up a pragmatic design
in order to test this final step in implementation research,
giving the diagnostic centres a leading role and leaving
GPs much room to adapt and to internalise the strategy.
The project team will act as facilitators to these centres, the
pharmacists involved, and the LQICs. The strategy is tar-
geted first on test ordering and second on prescribing,
which is the natural order followed by GPs when con-
sulted by a patient.
Our strategy is based upon several theories on effective
behaviour change and on effective implementation. These
theories can be identified at several levels of organisation
in our trial. At the level of diagnostic centres and the
LQICs, we expect the innovators and early adopters to join
the trial, which refers to Roger's innovation-diffusion the-
ory [34]. Within groups we expect to see change according
to theories such as Ajzen's theory of planned behaviour
and the PDSA-cycles [25,35]. During a meeting, we expect
to see the preparation for change based on performance
data and actual actions towards change. When new data
will be provided to the groups, we expect reflection on the
goals previously set. The theory of planned behaviour
states that individuals are willing to show change in
behaviour dependent on the perceived control over the
behaviour itself, the attitude of the individual to the
desired behaviour, and the perceived social norms. By
providing graphical comparative feedback, we target at
these perceived social norms. Comparative feedback sets
the norm for a group, and through the phenomenon that
one does not like to be an outlier we expect regression to
the mean with regard to the inter-physician variation. The
moderator who is also an expert on the subject under dis-
cussion is expected to act as opinion leader. Furthermore,
Implementation Science 2009, 4:6 />Page 11 of 14
(page number not for citation purposes)
even a GP from within the group itself can act as a local
opinion leader and thus influence the rest of the group.
The existing PTAM group structure in the Netherland is
widespread and functions reasonably well. However the
need to improve the functioning of these groups is clearly
present. Our strategy is known to improve test ordering
behaviour of GPs, but is not used widely. Transferring
PTAM groups into LQICs gives us the opportunity to add
a discussion on test ordering behaviour to existing discus-
sions on prescribing by GPs in PTAMs. The constitution of
LQICs therefore is not 'old wine in new bottles' but a com-
pletely new approach within existing structures.
Several methodological challenges were encountered
when we designed this trial. First, individual GPs are
known to choose topics for CME in which they already
show good performance [36]. This might result in a 'ceil-
ing effect', meaning that little or no improvement in test
ordering or prescribing behaviour would be possible.
However, because the LQIC will have to reach consensus
on the clinical topics they choose, the risk of such a ceiling
effect is probably not very great.
Second, using an implementation strategy on ten different
clinical topics from which GPs can choose introduces
challenges to the sample size calculation. We chose to
leave the LQICs some freedom of choice with regard to
the topics. All clinical topics are well-described in the
national guidelines for each topic. We will use a set of 204
tests and drugs to generate feedback [See Additional files
2] [See additional file 3]. Because we do not know what
agreements local groups will come to, and do not know
beforehand what the desired direction for change is, sam-
ple size calculation is very difficult. Because we intend to
improve care by using the national guidelines, we do not
expect to decrease quality of care by this study. However,
it is impossible to predict if change will be towards better
care.
Third, the databases we use are complex, as are the origins
of the data. Most local databases on diagnostics used in
this trial are intended primarily for billing purposes. This
might create problems when extracting data, reading it
into a central database and translating it into feedback. In
the past, no significant problems were encountered when
extracting data from laboratories (personal communica-
tion by Verstappen). Data on tests not performed within a
laboratory (e.g., gastroscopy and X-rays), however, are
often stored in separate databases and might not be linked
to a GP but to a patient. In these cases, tracing the GP who
ordered the test is possible but will require an extra effort
from the diagnostic centres. It is possible that recruiting
groups, supplying a moderator for the sessions and imple-
menting this time-consuming data extraction process
might prove to be too much of an effort for the centres.
Most contact persons of the centres, however, have indi-
cated that they were most willing to cooperate and were
aware of the opportunities offered by this trial.
Fourth, the database on prescriptions consists of data
from the large insurance companies in the south of the
Netherlands. Using these records as a basis for feedback
might create several problems. Although most inhabitants
of the southern provinces are insured by one of these com-
panies, prescription data for patients insured with other
companies will not be included in our database on pre-
scriptions. This problem might be solved in the future by
adding more insurance companies to the database.
Another potential problem may be that recording errors
are likely to be present in the databases. Desk staff at local
pharmacies often links a prescription to one of the GPs in
a practice, and often almost all prescriptions for a practice
are thus linked to one physician, even when several phy-
sicians collaborate in the practice. This creates an inaccu-
racy in the database, but only for GPs sharing an office. To
solve this problem, we will also aggregate to an extra level
in these cases, viz the subgroup of GPs sharing an office,
thus creating a fourth column on the graphical feedback
sheet. The last problem we expect to encounter using a
large database on prescription is that we do not know the
indication for which medication was prescribed; these
indications are not known to pharmacists and thus are
not stored in any database. This makes it impossible to
trace a prescription back to a specific disease. By building
a similar database on tests ordered by GPs, we will
encounter this problem as well. We do not however expect
this to be a problem because we will use graphical com-
parative feedback. All data from all participating GPs are
expected to be equally be affected by this problem and
thus the feedback will be comparable.
Fifth, the tests of the diabetes and hypercholesterolemia
topics partly overlap. We accepted this, however, because
in diabetes, the glucose and HbA1c items are the primary
indicators, whereas cholesterol, LDL, HDL, and the ratio
are the primary indicators in the hypercholesterolemia
topic.
Sixth, we have to be aware of the Hawthorne effect. As dis-
cussed above, we chose to use a balanced incomplete
block design to overcome this problem. The complexity of
the strategy, however, would make it more attractive to
use a different design and start the trial in phases. This
would mean that different regions would enrol in the
strategy successively, so we could learn from the early
regions what the weaknesses of our design were and what
we would have to alter. This would create an opportunity
to ameliorate the strategy with each new phase. To this
end, a dynamic wait-listed design could have been more
Implementation Science 2009, 4:6 />Page 12 of 14
(page number not for citation purposes)
appropriate and beneficial [37]. Conversely, we would
then have had to wait after completing enrolment and
intervening in one region for new data to be added to the
database. The delay would be six months after each
region. This left us with no choice but to start with the
entire population in the same period. In this situation, we
considered the balanced incomplete block design to be
most useful.
Finally, GPs and moderators cannot be sufficiently
blinded in our present design. However, because GPs do
not know what clinical topics are available in the arm they
are not allocated to, we do achieve some level of blinding.
Notwithstanding these methodological challenges, there
are also opportunities in the Dutch healthcare system that
make it attractive to start this trial now. First, the strategy
we intend to use fits in well with the new Dutch health-
care system. After the recent reform, healthcare has turned
into a competitive business, in which financial profits and
market shares may influence decision-making. Our study
might create profiling opportunities for centres, which
might bind GPs more tightly to them, and thus might be
a way for the centres to improve their chances in this mar-
ket. Finally, diagnostic centres are under increasing pres-
sure from various parties in the healthcare system to
provide feedback to GPs. GPs want feedback to monitor
and claim results when treating chronically ill patients
(e.g., diabetics), while insurance companies want labora-
tories to provide feedback in order to influence test order-
ing behaviour, and primary care organizations need GPs'
performance data for various reasons, such as certifica-
tion.
A preliminary investigation identified 24 eligible diagnos-
tic centres in hospitals, all of which provide diagnostic
facilities to GPs. All were contacted and appointments for
personal visits were made. Two centres were not interested
in participating, and were therefore not visited. Two cen-
tres expressed an interest but faced major strategic chal-
lenges and found no time to participate. The remaining 20
centres all agreed to participate. One of the participating
centres will not be asked to recruit groups, however,
because it is not linked to a region like the other centres,
which means that knowledge of local PTAM group struc-
tures is lacking. This centre will, however, participate in
the large database on diagnostics.
In the south of the Netherlands, health insurance is
offered predominantly by two companies, which insure
the majority of the inhabitants of these provinces. These
insurance companies regularly send updated reports on
prescription data to UM. These files are and will be com-
bined into one research database on prescriptions, main-
tained by MEMIC. Because the recent health care reform
in the Netherlands, insurance companies have been given
a large role in guarding and improving the quality and
continuity of care. They promote the existence of PTAM
groups in order to improve the quality of care, giving
financial incentives to GPs for attending such group meet-
ings. In some cases, extra incentives are given if working
agreements are created and adhered to. However, the
insurers are unable to evaluate the quality of the group
work. The strategy evaluated in the proposed study should
provide them with a tool to ensure high quality group
meetings.
Competing interests
The authors declare that they have no competing interests.
Authors' contributions
JT drafted the manuscript, participated in its design and is
the researcher on the trial. TvdW conceived of the study,
participated in the design and coordination and helped to
draft the manuscript. WV, RJ, PM, JM, BvS and RG all con-
ceived of the study, participated in its design and read and
corrected earlier versions of the manuscript. RW read and
corrected earlier versions of the manuscript. All authors
have read and approved the final manuscript. The Addi-
tional Files below (4, 5 and 6) refer to information regard-
ing The Funding approval ZonMw, The Approval ethical
committee and The CONSORT Cluster RCT Checklist.
Additional material
Additional file 1
This file displays the pre-randomization questionnaire as it was sent
to the chair of each LQIC.
Click here for file
[ />5908-4-6-S1.pdf]
Additional file 2
The impact of local quality improvement collaboratives additional file
2. This file includes all the diagnostic tests used in this trial, the diversion
over the modules and how each item is labelled on the feedback form.
Click here for file
[ />5908-4-6-S2.pdf]
Additional file 3
The impact of local quality improvement collaboratives additional file
3. This file includes all the farmaceuticals used in this trial, the diversion
over the modules and how each item is labelled on the feedback form.
Click here for file
[ />5908-4-6-S3.pdf]
Additional file 4
Funding approval ZonMw. Scanned letter of ZonMw in which the fund-
ing of this trial is confirmed.
Click here for file
[ />5908-4-6-S4.pdf]
Implementation Science 2009, 4:6 />Page 13 of 14
(page number not for citation purposes)
Acknowledgements
Funds for this trial were obtained from a unrestricted grant from OWM
Centrale Zorgverzekeraars group, Zorgverzekeraar U.A, Tilburg, the
Netherlands and ZonMw, the Netherlands organisation for Health
Research and Development.
References
1. Braspenning JCC, Schellevis FG, Grol R: Kwaliteit huisartsenzorg
belicht [Quality in primary care revised]. Nivel 2004.
2. Burgers JS, Grol RPTM, Zaat JOM, Spies TH, Bij AK van der, Mokkink
HGA: Characteristics of effective clinical guidelines for gen-
eral practice. Br J Gen Pract 2003, 53:15-19.
3. Muijrers PE, Grol RP, Sijbrandij J, Janknegt R, Knottnerus JA: Differ-
ences in prescribing between GPs. Impact of the coopera-
tion with pharmacists and impact of visits from
pharmaceutical industry representatives. Fam Pract 2005,
22:624-630.
4. Harteloh PPM: Kwaliteit van zorg: van zorginhoudelijke bena-
dering naar bedrijfskundige aanpak [Quality of care: from a
care standpoint towards a business management stand-
point]. In Maarssen 4th edition. Elsevier/De Tijdstroom; 2001.
5. Verstappen WH, ter Riet G, Dubois WI, Winkens R, Grol RP, Wei-
jden T van der: Variation in test ordering behaviour of GPs:
professional or context-related factors? Fam Pract 2004,
21:387-395.
6. Martens JD, van-der-Weijden T, Severens JL, de-Clercq PA, de-Bruijn
DP, Kester AD, Winkens RA: The effect of computer reminders
on GPs' prescribing behaviour: A cluster-randomised trial.
International Journal Medical Informatics 2007, 76:S403-416.
7. Verstappen WHJM, Weijden T van der, Sijbrandij J, Smeele I,
Hermsen J, Grimshaw J, Grol RPTM: Effect of a Practice-Based
Strategy on Test Ordering Performance of Primary Care
Physicians: A Randomized Trial. JAMA 2003, 289:2407-2412.
8. Baker R, Falconer Smith J, Lambert PC: Randomized controlled
trial of the effectiveness of feedback in improving test order-
ing in general practice. Scan J Prim Health Care 2003, 21:219-223.
9. Sondergaard J, Andersen M, Stovring H, Kragstrup J: Mailed pre-
scriber feedback in addition to a clinical guideline has no
impact: a randomised, controlled trial. Scandinavian Journal of
Primary Health Care 2003, 21:47-51.
10. Martens JD, Winkens RA, Weijden T van der, de Bruyn D, Severens
JL: Does a joint development and dissemination of multidis-
ciplinary guidelines improve prescribing behaviour: a pre/
post study with concurrent control group and a randomised
trial. BMC Health Serv Res 2006,
6:145.
11. Winkens RA, Pop P, Bugter-Maessen AM, Grol RP, Kester AD, Beus-
mans GH, Knottnerus JA: Randomised controlled trial of rou-
tine individual feedback to improve rationality and reduce
numbers of test requests. Lancet 1995, 345:498-502.
12. Jamtvedt G, Young JM, Kristoffersen DT, O'Brien MA, Oxman AD:
Audit and feedback: effects on professional practice and
health care outcomes. Cochrane Database Syst Rev
2006:CD000259.
13. Thomas RE, Croal BL, Ramsay C, Eccles M, Grimshaw J: Effect of
enhanced feedback and brief educational reminder mes-
sages on laboratory test requesting in primary care: a cluster
randomised trial. The Lancet 2006, 367:1990-1996.
14. Verstappen WHJM, Weijden T van der, Dubois WI, Smeele I,
Hermsen J, Tan FES, Grol RPTM: Improving Test Ordering in
Primary Care: The Added Value of a Small-Group Quality
Improvement Strategy Compared With Classic Feedback
Only. Ann Fam Med 2004, 2:569-575.
15. Solomon DH, Hashimoto H, Daltroy L, Liang MH: Techniques to
Improve Physicians' Use of Diagnostic Tests: A New Con-
ceptual Framework. JAMA 1998, 280:2020-2027.
16. Grimshaw JM, Thomas RE, MacLennan G, Fraser C, Ramsay CR, Vale
L, Whitty P, Eccles MP, Matowe L, Shirran L, et al.: Effectiveness
and efficiency of guideline dissemination and implementa-
tion strategies. Health Technol Assess 2004, 8:iii-iv.
17. Grol RPTM, grimshaw JM: From best evidence to best practice:
effective implementation of change in patients' care. The Lan-
cet 2003, 362:1225-1230.
18. Axt-Adam P, Wouden JC van der, Does E van der: Influencing
behavior of physicians ordering laboratory tests: a literature
study. Med Care 1993, 31:784-794.
19. Eccles M, Steen N, Grimshaw J, Thomas L, McNamee P, Soutter J,
Wilsdon J, Matowe L, Needham G, Gilbert F, Bond S: Effect of audit
and feedback, and reminder messages on primary-care radi-
ology referrals: a randomised trial. The Lancet 2001,
357:1406-1409.
20. Bunting PS, Van Walraven C: Effect of a controlled feedback
intervention on laboratory test ordering by community phy-
sicians. Clinical Chemistry
2004, 50:321-326.
21. Grimshaw JMMP, Shirran LMAM, Thomas RB, Mowatt GMAMBA,
Fraser CMA, Bero LP, Grilli RMD, Harvey EB, Oxman AMDa, O'Brien
MAM: Changing Provider Behavior: An Overview of System-
atic Reviews of Interventions. Medical Care 2001, 39:II-45.
22. Arnold SR, Straus SE: Interventions to improve antibiotic pre-
scribing practices in ambulatory care. Cochrane Database Syst
Rev 2005:CD003539.
23. Lagerlov P, Loeb M, Andrew M, Hjortdahl P: Improving doctors'
prescribing behaviour through reflection on guidelines and
prescription feedback: a randomised controlled study. Qual
Saf Health Care 2000, 9:159-165.
24. Freemantle N, Harvey EL, Wolf F, Grimshaw JM, Grilli R, Bero LA:
Printed educational materials: effects on professional prac-
tice and health care outcomes. Cochrane Database Syst Rev
2000:CD000172.
25. Grol R, Wensing M, Eccles M: Improving patient care. The
implementation of change in clinical practice. Elsevier Limited
2005.
26. Paes AH, Cornips PMJM: Ontstaan en verloop van een farmaco-
therapie-overleg [the emergence and development of phar-
macotherapeutic meetings]. Pharm Weekbl 1987, 122:225-230.
27. Eimers M, de Groot J: FTO peiling 2005, kwaliteit van farmaco-
therapieoverleg in Nederland in beeld [PTAM audit 2005,
quality of pharmacotherapeutical audit meetings in the
Netherlands made visible]. DGV Nederlands instituut voor verant-
woord medicijngebruik [DGV the Dutch Institute for the Proper Use of Med-
icine] 2006.
28. DGV Nederlands instituut voor verantwoord medicijnge-
bruik [DGV the Dutch Institute for the Proper Use of Medi-
cine] [
]
29. Verstappen WHJM, Weijden T van der, ter Riet G, Grimshaw J,
Winkens R, Grol RPTM: Block design allowed for control of the
Hawthorne effect in a randomized controlled trial of test
ordering. Journal of Clinical Epidemiology 2004, 57:1119-1123.
30. Eijk MECv, Paes AHP, Porsius A, Avorn J, Boer Ad: Pre-randomiza-
tion decisions and group stratification in a randomized con-
trolled trial to improve prescribing. Pharm World Sci 2004,
V26:227-231.
31. Eimers M, Aalst A van der, Pelzer B, Teichert M, de Wit H: Leidt een
goed FTO tot beter voorschrijven? [Does an effective PTAM
leed to more appropriate prescibing?] (Dutch). Huisarts en
Wetenschap 2008, 51:340-345.
Additional file 5
Approval ethical committee. Scanned letter of the Maastricht ethical
committee, stating that it is not required to fully review this trial by the
committee because Dutch law on research with humans is not applicable.
Click here for file
[ />5908-4-6-S5.pdf]
Additional file 6
CONSORT Cluster RCT Checklist. checklist with reference to page
numbers in this trial concerning the CONSORT statement for cluster-
RCTs.
Click here for file
[ />5908-4-6-S6.doc]
Publish with BioMed Central and every
scientist can read your work free of charge
"BioMed Central will be the most significant development for
disseminating the results of biomedical researc h in our lifetime."
Sir Paul Nurse, Cancer Research UK
Your research papers will be:
available free of charge to the entire biomedical community
peer reviewed and published immediately upon acceptance
cited in PubMed and archived on PubMed Central
yours — you keep the copyright
Submit your manuscript here:
/>BioMedcentral
Implementation Science 2009, 4:6 />Page 14 of 14
(page number not for citation purposes)
32. Grol RPTM, Bosch MC, Hulscher MEJL, Eccles MP, Wensing M: Plan-
ning and Studying Improvement in Patient Care: The Use of
Theoretical Perspectives. The Milbank Quarterly 2007, 85:93-138.
33. Verstappen WHJM, van Merode F, Grimshaw J, Dubois WI, Grol
RPTM, Weijden T van Der: Comparing cost effects of two qual-
ity strategies to improve test ordering in primary care: a
randomized trial. Int J Qual Health Care 2004, 16:391-398.
34. Rogers EM: Diffusion of innovations 4th edition. New York The Free
Press; 1995.
35. Ajzen I: The theory of planned behavior. Organizational Behavior
and Human Decision Processes 1991, 50:179-211.
36. Hobma S: Directed self-learning as approach to continuing
professional development. Maastricht University, General prac-
tice; 2005.
37. Brown CH, Wyman PA, Guo J, Pena J: Dynamic wait-listed
designs for randomized trials: new designs for prevention of
youth suicide. Clin Trials 2006, 3:259-271.