Báo cáo y học: " The effect of maternal common mental disorders on infant undernutrition in Butajira, Ethiopia: The P-MaMiE study" pot
Bạn đang xem bản rút gọn của tài liệu. Xem và tải ngay bản đầy đủ của tài liệu tại đây (830.81 KB, 13 trang )
Medhin et al. BMC Psychiatry 2010, 10:32
/>Open Access
RESEARCH ARTICLE
BioMed Central
© 2010 Medhin et al; licensee BioMed Central Ltd. This is an Open Access article distributed under the terms of the Creative Commons
Attribution License ( which permits unrestricted use, distribution, and reproduction in
any medium, provided the original work is properly cited.
Research article
The effect of maternal common mental disorders
on infant undernutrition in Butajira, Ethiopia: The
P-MaMiE study
Girmay Medhin*
1
, Charlotte Hanlon
2,3
, Michael Dewey
3
, Atalay Alem
2
, Fikru Tesfaye
4
, Zufan Lakew
5
, Bogale Worku
6
,
Mesfin Aray
2
, Abdulreshid Abdulahi
2
, Mark Tomlinson
7
, Marcus Hughes
3
, Vikram Patel
8,9
and Martin Prince
3
Abstract
Background: Although maternal common mental disorder (CMD) appears to be a risk factor for infant undernutrition
in South Asian countries, the position in sub-Saharan Africa (SSA) is unclear
Methods: A population-based cohort of 1065 women, in the third trimester of pregnancy, was identified from the
demographic surveillance site (DSS) in Butajira, to investigate the effect of maternal CMD on infant undernutrition in a
predominantly rural Ethiopian population. Participants were interviewed at recruitment and at two months post-
partum. Maternal CMD was measured using the locally validated Self-Reported Questionnaire (score of ≥ six indicating
high levels of CMD). Infant anthropometry was recorded at six and twelve months of age.
Result: The prevalence of CMD was 12% during pregnancy and 5% at the two month postnatal time-point. In bivariate
analysis antenatal CMD which had resolved after delivery predicted underweight at twelve months (OR = 1.71; 95% CI:
1.05, 2.50). There were no other statistically significant differences in the prevalence of underweight or stunted infants
in mothers with high levels of CMD compared to those with low levels. The associations between CMD and infant
nutritional status were not significant after adjusting for pre-specified potential confounders.
Conclusion: Our negative finding adds to the inconsistent picture emerging from SSA. The association between CMD
and infant undernutrition might be modified by study methodology as well as degree of shared parenting among
family members, making it difficult to extrapolate across low- and middle-income countries.
Background
Infant undernutrition is a well recognised public health
problem in low and middle income countries (LAMIC)
[1-3], the cause of which extends beyond mere shortage
of food [1,4,5]. Maternal common mental disorders
(CMD), characterised by significant levels of depressive,
anxiety and somatic symptoms, are highly prevalent in
LAMIC [5] and recent studies indicate a potential aetio-
logical role in infant undernutrition [6-15]. Infancy is a
critical time for the well-being of the newborn which
depends largely on the quality and quantity of care
received from the primary caregiver, usually the mother.
Postnatal CMD can affect the mother's mental and physi-
cal availability to the infant and thus compromise parent-
ing quality [16,17]. A meta-analysis of 19 studies
conducted in high-income countries found postnatal
depression to have a moderate-to-large adverse effect on
maternal-infant interaction during infancy [18]. These
findings have been replicated in South Africa, with
depressed mothers exhibiting less sensitive engagement
with their infants [16] resulting in increased insecure
attachment in the infants [19]. Maternal CMD might lead
to infant undernutrition through a variety of mechanisms
[17,20]. When present during pregnancy, maternal CMD
has been associated with an elevated risk of low birth
weight [21-23], which in turn is associated with infant
undernutrition [6,9]. Postnatal CMD may lead to early
cessation of breastfeeding [8] or compromised hygienic
feeding practices putting the infant at risk of infectious
illnesses [24].
* Correspondence:
1
Aklilu Lemma Institute of Pathobiology, Addis Ababa University, Addis Ababa,
Ethiopia
Full list of author information is available at the end of the article
Medhin et al. BMC Psychiatry 2010, 10:32
/>Page 2 of 13
Studies from South Asia [6,8,10,11] have consistently
found postnatal CMD to be associated with infant under-
nutrition after adjusting for potential confounders. How-
ever, in Latin America findings have been more mixed,
with maternal CMD associated with child under-nutri-
tion in a cross-sectional community sample from Brazil
[7,15], but not in a clinic-based study from Jamaica [25]
or a large population-based sample in Peru [14]. A simi-
larly inconsistent picture is emerging from sub-Saharan
Africa [12-14,26]. In clinic-based studies from Nigeria
[12] and Malawi [13], maternal postnatal CMD was asso-
ciated with infant undernutrition; However, in a popula-
tion-based cross-sectional sample of two to 18 month old
children in Ethiopia [14] and a population-based cohort
in South Africa [26], no significant associations were
noted between maternal CMD and child undernutrition.
Methodological issues may explain some of the con-
flicting findings across studies. Variation in the age of
children at nutritional assessment, homogeneity of study
participants across studies, rural versus urban setting,
cultural validity of instruments used to ascertain mater-
nal CMD, use of different nutritional indices as out-
comes, as well as different scales of measurement (binary
or continuous), the frequencies of exposure and out-
comes investigated, the timing at which the effect of
exposure on the outcome was evaluated, and the quality
of study design may all play a part [11,27]. Furthermore,
the majority of published studies fail to take into account
the potential impact of maternal CMD in pregnancy
upon infant under-nutrition, mediated through low birth
weight. Studies from LAMIC have tended to show that
the prevalence of maternal CMD is higher in pregnancy
than in the postnatal CMD, underlining the importance
of examining the impact of antenatal CMD. Only one
study, from Pakistan, has evaluated the effect of maternal
CMD in pregnancy on child nutritional status prospec-
tively using a population based cohort [9] and showed
that CMD in pregnancy significantly compromised the
nutritional status of infants at six and twelve months of
age. In sub-Saharan Africa, health service coverage is
generally low [3,28] which means that clinic-based stud-
ies are examining a selected population; this may lead to
bias, since women who seek help because their child is
under-nourished and ailing may be more likely to be psy-
chologically distressed.
We now report results from a population based cohort,
the Perinatal Maternal Mental Disorder in Ethiopia (P-
MaMiE) study [29], with the aim of answering the follow-
ing questions. In a predominantly rural population in
sub-Saharan Africa, after taking account of known risk
factors for undernutrition:
(a) does maternal CMD in pregnancy significantly
contribute to infant undernutrition at six and twelve
months of age?
(b) does postnatal CMD significantly contribute to
infant undernutrition at six and twelve months of
age?,
(c) compared to infants whose mothers had no expe-
rience of CMD either in pregnancy or the postnatal
period, are infants whose mothers had CMD (i) in
pregnancy only, resolving after giving birth, (ii) post-
natally, but not in pregnancy (incident postnatal), and
(iii) persistently from pregnancy to the postnatal
period ('persistent perinatal'), at a higher risk of being
undernourished at six and twelve months of age?
Methods
Study design and population
A population based prospective cohort of pregnant
women was established [29] within the framework of the
demographic surveillance site (DSS) in Butajira [30] 135
km south of Addis Ababa, the capital city of Ethiopia.
Participants were followed-up with their new born up to
one year postnatal. Eligibility criteria include (a) preg-
nancy within their third trimester between July, 2005 and
February, 2006, (b) ability to communicate in Amharic,
the official language of Ethiopia, (c) being a resident of
the DSS site, and (d) consenting to participate in the
study. The DSS enumerators identified pregnant women
during their routine surveillance. Eligible women were
then interviewed by female data collectors employed to
work full-time on the P-MaMiE project. Traditionally
people in the study area grow maize and "false banana"
Ensete (Ensete ventricosun) for subsistence and produce
chilli-peppers and khat (Catha edulis, a natural stimu-
lant) as cash crops. In recent years, however, the popula-
tion has been affected by periodic food insecurity. There
is a primary health service and primary schools for resi-
dents within a maximum distance of 5-6 km. Butajira
town is the capital of the district within which the DSS is
located. It has basic infrastructure including an all-
weather road that runs to the bordering districts, a hospi-
tal, a health centre, drug stores, electricity, and digital
telephone services.
Measures
Anthropometric measurements
Growth measurements were taken by project data collec-
tors, DSS enumerators and community health agents
(CHAs). In six sub-districts (the smallest government
administrative unit) CHAs who lived and worked in the
same sub-district were trained to measure birth weight.
During recruitment, participating women were requested
to inform the CHA immediately after giving birth to
enable the neonate to be weighed ideally within 24 to 48
hours of birth. The remaining four sub-districts had no
suitable health worker to measure birth weight and that
information was not collected. Infant weight, including
Medhin et al. BMC Psychiatry 2010, 10:32
/>Page 3 of 13
birth weight, was measured using SECA 725 scales mea-
suring to an accuracy of 10 g. Infant length was obtained
using a locally adapted measuring board. First authors
(GM and CH) and one of the collaborators (FT) trained
all individuals involved in growth measurements to mini-
mise inter-individual variability.
Mental health measure
CMD was measured during the third trimester of preg-
nancy and at two months postnatal using the locally vali-
dated Self-Reporting Questionnaire (SRQ-20) [31]. The
SRQ-20 is composed of twenty yes/no items asking about
the experience of depressive, anxiety, panic and somatic
symptoms in the preceding 30 days [32]. The SRQ-20
generates a continuously distributed scale score indicat-
ing overall psychological morbidity. In the current study
area SRQ-20 showed acceptable convergent validity both
as a linear scale and as ordered categories of SRQ symp-
tom burden: no symptoms (scored 0), low symptoms (one
to five) and high symptoms (six and above)[31]. To
address the current objectives, the total score was dichot-
omised (SRQ-20 < 6 versus SRQ ≥ 6), high scores indicat-
ing a high level of CMD. Three different exposure
variables of CMD were considered: (1) antenatal CMD -
prevalent cases, (2) postnatal CMD - prevalent cases, (3)
four level categorical exposure of CMD with the follow-
ing categories - never had CMD (never exposed), antena-
tal CMD resolving after birth (antenatal only), incident
postnatal CMD (postnatal only), and 'chronic' CMD (high
SRQ-20 score antenatally and postnatally)
Other covariates
Potential confounding variables were grouped into
domains as shown below:
(1) Household characteristics: residential area (urban
or rural), number of children aged under five years,
age of husband and three composite scores:
a. Poverty index including the following variables:
non-literate wife, non-literate husband, do not
own radio, do not own bed, do not possess valu-
able goods like gold and jewellery, own home,
possess large animals, possess small animals, ani-
mals spend night within the living room, house
has a window. Individual items of this scale were
identified through a rigorous process including
exploratory and confirmatory factor analysis. The
final scale score was obtained by adding individual
items with equal weight. The resulting scale had a
Cronbach alpha value of 0.73, indicating an
acceptable level of internal consistency.
b. Poor sanitary conditions scale including: not
having a toilet facility, not having safe water and
disposing of rubbish on the field. We aggregated
these three variables as all of them are known risk
factors of undernutrition in Ethiopia even though
the internal consistency of the resulting scale was
relatively low: Cronbach alpha = 0.49.
c. Support to the mother, including: able to visit
friends, enough help at home, enough help with
looking after children, enough help from husband,
no experience of violence. The resulting scale had
a Cronbach alpha value of 0.47 which is relatively
low; however, these items measure quite different
sources of support and we would not expect them
to correlate highly.
(2) Child characteristics: gender, vaccination status at
two months of age, history of severe illness before the
age of two months and birth weight (low birth weight,
normal birth weight and no birth weight available).
(3) Maternal characteristics: Age, height, mid upper
arm circumference, type of marriage (polygamous
versus non-polygamous), substance use (either chew-
ing khat or drinking alcohol at least weekly), at least
one obstetric complication during current delivery
(prolonged labour (>24 hours) or assisted delivery
(normal vaginal delivery versus instrumental/Caesar-
ian section) or self reported post-partum haemor-
rhage or post-partum fever) and 'autonomy' scale.
The degree of household autonomy was assessed by
asking whether the participant had to ask her hus-
band before she was able to sell crops (yes/no), spend
household money (yes/no), attend women's groups or
other meetings(yes/no), purchase medications for
herself or her children (yes/no), attend a health facil-
ity(yes/no). Responses to the five categories were
summed with equal weights resulting in a scale with a
Cronbach alpha value of 0.93.
(4) Early infant feeding practices: no pre-lacteal feed,
given colostrums, initiation of breast-feeding within
one hour of delivery.
Nutritional indices
Standardized z-scores (height-for-age and weight-for-
age) were generated using the new WHO reference popu-
lation [33]. These scores were dichotomised at a cut-off of
-2. Infants whose scores fell below the cut-off were
labelled as undernourished. While lower values of height-
for-age (i.e. stunting) reflects reduced skeletal growth as
the result of repeated undernutrition (or long-standing
undernutrition) lower values of weight-for-age (i.e.
underweight) do not differentiate between chronic and
acute undernutrition [34].
Sample size estimation
We hypothesised that the infants born to women with
high levels of CMD (SRQ20 ≥ 6) during their third tri-
mester would have a 1.5 times higher risk of being
stunted at six months of age compared to infants of
Medhin et al. BMC Psychiatry 2010, 10:32
/>Page 4 of 13
mothers with a low SRQ score. Based on the demo-
graphic and health survey data [35] we assumed inci-
dence of stunting to be 26.6%. We also expected a
prevalence of 20% of CMD during the third trimester. A
sample of 850 pregnant women would result in 170
exposed and 680 non-exposed infants which gives a
power of 90% allowing a 5% probability of type I error. In
the event during the time span of the study recruitment
proved unexpectedly successful and we eventually
recruited 1065 women
Data Management
Data were checked in the field by supervisors and usually
double-entered on the same day using Epidata [36].
Women were re-interviewed within one week if data were
missing. Ongoing quality checks were performed by the
supervisors, CH and GM.
Ethical considerations
Prior to the first interview the women were informed
about the objective of the study. Written, informed con-
sent was obtained in keeping with requirements of the
Ethiopia ethics committee. As the majority of women
were non-literate, the form was read out and participants
were asked to give a finger-print to signify willingness to
participate. Arrangements were made within locally
existing public health institutions for the study project to
pay all health-related expenses of the women and chil-
dren participating in the study. The study was granted
ethical approval from the National Ethics Review Com-
mittee in Ethiopia and the Research Ethics Committee of
King's College London in the UK.
Data Analysis
Data analysis was restricted to singleton infants who had
growth measurements at six or twelve month follow-up.
Means and proportions were used to describe continuous
and categorical characteristics, respectively. Independent
sample t-tests were used to compare mean score of nutri-
tional indices of infants born to mothers with and with-
out a high level of CMD. The proportions of
undernourished infants among those born to mothers
with and without high levels of CMD were compared
using Fisher's exact test. The independent effect of CMD
on infant nutritional status was evaluated by defining
three main exposure variables: (a) antenatal prevalent
case, (b) postnatal prevalent case, and (c) four level cate-
gorical exposure variable ("no exposure at both time
points" (reference), only antenatal exposure, incident
postnatal, and "chronic" or persistent exposure) of CMD.
Taking each of the three CMD exposures in turn, the
association with infant nutritional status was investigated
with logistic regression for binary outcomes (undernour-
ished versus well-nourished) and linear regression for
continuous outcomes (weight-for-age and height-for-age
z scores). In the process of modelling each outcome
(weight-for-age and height-for-age) at each time point
(six month and twelve month) three steps were followed:
(1) bivariate regression taking one of the three CMD
exposure variables, (2) multivariable regression adjusting
for the effect of CMD on an outcome for a given domain
of covariates (household characteristics, child character-
istics, maternal characteristics, or infant feeding prac-
tices), (3) multivariable regression fully adjusting the
effect of CMD for all covariates. Unadjusted and adjusted
odds ratios from logistic regression and unstandardised
regression coefficients from linear regression with corre-
sponding 95% confidence intervals were used to assess
statistical significance and the magnitude of effects. All
data analysis was done using STATA [37] with the proba-
bility of type 1 error set at 5%.
Results
Cohort characteristics
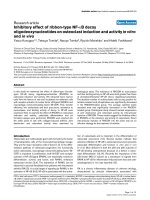
Recruitment and attrition at every stage of follow-up are
detailed in Figure 1. One thousand and sixty five (86.3%
of eligible) pregnant women were recruited in the third
trimester of pregnancy and 128 (12.0%) of them had high
levels of antenatal CMD. One thousand and forty-five of
the mothers (98.1%) were re-interviewed at two months
post partum and 56 (5.4%) of them had postnatal CMD
including 26 (2.8%) incident cases. There were 40 still-
births, 16 multiple births (including one triplet), three
losses to follow-up before delivery (one pregnant woman
died and two pregnant women out-migrated), and 1006
singleton live births. Anthropometric measurements
were available for 873 singletons at six months and for
926 singletons at twelve months of age. The missing cases
at six or twelve month did not differ significantly in back-
ground characteristics from those included in the present
analysis except on the number of under five children and
type of marriage. Cases lost to follow-up were less likely
to have children under five years old and more likely to be
in a polygamous marriage compared to cases whose
information is included in this paper.
Selected characteristics of the whole cohort at recruit-
ment are presented in Table 1. Almost all women were
married. The large majority belonged to one of three eth-
nic groups, namely, Meskan (47%), Mareko (14%) and
Silti (24%). Most were non-literate (80%), housewives or
engaged in farming (88%), and followers of the Islamic
religion (78%). The average age of participating women
was 27 (sd = 6.4) years and that of their husbands was 36
(sd = 9.2) years. The majority of women in this predomi-
nantly rural community had access to safe water (70%)
and toilet facilities (63%) but only 22% of women
reported safe disposal of rubbish.
A descriptive summary of infant nutritional status
(standardised weight and height/stunting and under-
Medhin et al. BMC Psychiatry 2010, 10:32
/>Page 5 of 13
weight) stratified by infant age and level of CMD is pre-
sented in Table 2. CMD was not significantly associated
with infant underweight and stunting at either six or
twelve months of age, whether the level of CMD was
measured during pregnancy, at two months postnatally,
or according to the course of CMD across these two time
points. The mean weight-for-age and, height-for-age z
scores were lower than those for the WHO child growth
standards over the whole year of infancy, independent of
CMD. Again, there was no evidence for a statistically sig-
nificant association between CMD and infant undernu-
trition assessed using these standardised scores at either
six or twelve months.
Odds ratios and corresponding 95% confidence inter-
vals from bivariate and multivariable logistic regressions
assessing the association between the course of CMD
from pregnancy to two months postnatally (a four level
categorical variable) and infant undernutrition are pre-
sented in Table 3. The reference category for this expo-
sure was those mothers who had low levels of CMD at
both assessment points. Prior to adjustment for possible
confounding factors, infants whose mothers had high lev-
els of CMD during pregnancy which resolved after deliv-
ery were more likely to be underweight at 12 months of
age (OR = 1.71; 95% CI: 1.05 - 2.80), with a non-signifi-
cant trend in the same direction at six months (OR = 1.53;
95% CI: 0.91 - 2.60) and for stunting at 12 months (OR =
1.30, 95% CI: 0.83 - 2.03). The excess risk for an infant
being underweight at 12 months of age remained signifi-
cant after adjusting for infant characteristics and early
infant feeding practices of the mother but became statis-
tically non-significant after adjusting for maternal char-
acteristics or household characteristics. Although the risk
for underweight at six months and for stunting at twelve
months was not statistically significantly associated with
antenatal CMD which resolved after delivery, a consistent
trend in the same direction still remained after adjusting
for each group of confounding variables. In the final mul-
tivariable model, adjusting for all of the potential con-
founders simultaneously, the course of CMD was not
significantly associated with infant nutritional status at
either six or twelve months of age.
The results of bivariate and multivariable logistic
regression with antenatal CMD (prevalent cases) and
postnatal CMD (prevalent cases) as the main exposures
for infant undernutrition are presented in Table 4. There
was no significant effect of either antenatal or postnatal
CMD upon infant nutritional status at either time point,
both before and after adjusting for potential confounding
variables. In a multivariable logistic regression use of
SRQ score as a continuous exposure variable did not
altered our finding of no association between CMD and
infant undernutrition.
Modelling of the association between CMD and infant
nutritional status was repeated using linear regression
For this purpose, weight and length of infants in standard
deviation units were kept as continuous outcome vari-
ables and CMD as the main exposure was defined as in
the methods section (antenatal - prevalent, postnatal -
prevalent and four level exposure - never/antenatal only/
incident postnatal/chronic). None of the findings showed
statistically significant effect of CMD on nutritional sta-
tus of infants (result not shown). Use of the SRQ score as
a continuous exposure variable did not alter our finding
of no association between CMD and height-for-age z
score or weight-for-age z score, either at six months and
at twelve months of age.
Discussion
In this population-based prospective study from rural
Ethiopia we evaluated the effect of maternal CMD in
pregnancy and at two months postnatal upon infant
Figure 1 Follow-up of study participants from screening up to
one year postnatal.
1065 women recruited
134 delivered before interview
26 not identified before birth
9 refused
16 multiple births
2 migrated out of area
1 died in pregnancy
1046 singleton deliveries
1232 eligible women
521 birth weights within 48
hours out of 654 women
(6 sub-districts)
40 stillbirths
1006 singleton babies born alive
971 singleton deliveries
surviving until 1 month after
birth (4 missing values)
Number of singleton infants who have growth measures
20 deaths before 6 month assessment
28 deaths before 12 month assessment
35 neonatal deaths in 1st 24 hours
(6 unknown)
873 at 6 months 926 at 12 months
Incorrect growth measurements of weight or height
6 months (8 weight and 11 height)
12 month (4 weight and 10 height)
5 out migrated before 6 month assessment
10 out migrated before 12 month assessment
88 temporarily out-migrated at 6 month assessment
7 temporarily out-migrated at12 month assessment
Medhin et al. BMC Psychiatry 2010, 10:32
/>Page 6 of 13
Table 1: Socio-demographic characteristics and sanitary conditions of the P-MaMiE cohort at baseline, and the rate of
follow-up at six and twelve months from the date of birth
Characteristics 6 month follow-up 12 month follow-up
Baseline sample
n(%) or
Mean(SD)
Number Percent or
mean(SD)
Number Percent or
mean(SD)
Religion
Muslim 824(77.6) 673 77.2 722 78.0
Orthodox
Christian
161(15.1) 133 15.3 139 15.0
Protestant 66(6.2) 56 6.4 55 5.9
Catholic 12(1.1) 10 1.2 10 1.1
Ethnicity
Meskan 485(44.5) 404 46.3 436 47.1
Mareko 147(13.8) 119 13.7 123 13.3
Silti 257(24.1) 199 22.8 218 23.5
Sodo 85(8.0) 69 7.9 68 7.3
Others 91(9.6) 81 9.3 81 8.8
Currently married 1055(99.1) 824 99.1 867 99.0
Occupation
Housewife or
farming
933(87.9) 758 87.1 805 87.1
Self or paid
employee
129(12.2) 112 12.9 119 12.9
Maternal age in
years (n = 1065)
26.9(6.4) 872 26.9(6.2) 926 26.9(6.2)
Educational
status of mother
Formal
education
219(20.6) 173 19.8 185 20.0
No formal
education
846(79.4) 699 80.2 741 80.0
Age of husband in
years (n = 1050)
36.2(9.2) 858 36.0(8.3) 911 36.1(8.9)
Educational
status of husband
Able to read 726(68.6) 594 68.5 632 68.7
Unable to
read
333(31.4) 273 31.5 288 31.3
Main source of
water
Protected
supply
752(70.8) 600 69.0 644 69.7
Unprotected
supply
310(29.2) 270 31.0 280 30.3
Sanitary
condition
Have toilet
facilities
674(63.3) 552 63.3 582 62.9
Medhin et al. BMC Psychiatry 2010, 10:32
/>Page 7 of 13
nutritional status assessed at six and twelve months of
age. The prevalence of infant undernutrition, indicated by
stunting (length for age z score less than -2) and being
underweight (weight for age z score less than -2), was
high at both time points; however, the prevalence of
maternal CMD was relatively low, particularly at the two
month postnatal time-point. In fully adjusted multivari-
able analyses, infant exposure to maternal CMD in preg-
nancy, at two months postnatal, or at both perinatal time-
points was not significantly associated with infant nutri-
tional status at six months or at one year of age. When
maternal CMD was considered as a four level categorical
variable (never, pregnancy only, incident postnatal only,
persistent perinatal) CMD in pregnancy that resolved fol-
lowing delivery was associated with the infant being
underweight at one year. However, this association
became non-significant after adjusting for household and
maternal characteristics. Neither this nor any other
effects of maternal CMD were significant in the fully
adjusted model, whether we considered nutritional indi-
ces as dichotomous or as continuous outcomes.
The credibility of the current results is based on the
strengths of the study which include: (a) a large popula-
tion-based sample from an area with a high prevalence of
infant undernutrition and low levels of loss to follow-up
over 12 months, (b) the first study from sub-Saharan
Africa and the second from a LAMIC setting to ascertain
CMD during pregnancy as well as at two months postna-
tally and to assess their effects on infant outcomes pro-
spectively, (c) assessment of infant nutritional status at
both six and twelve months of age, and (d) adjustment for
a large number of potentially confounding variables.
However, the study has some limitations. The SRQ-20 is a
scale-based measure of maternal CMD symptoms, rather
than providing a definitive diagnostic assessment of men-
tal disorder. In three[6,9,12] out of the four [26] studies
that made use of standardised clinical diagnostic mea-
sures of maternal depression, a positive association with
infant undernutrition was detected. That said, the SRQ-
20 has been used extensively in the study area for assess-
ment of CMD in the general population [38] and was val-
idated before the current study on pregnant and postnatal
women from the same geographical area [31]. Neverthe-
less, the assessment of CMD in this setting is by no means
straightforward [31] and misclassification of cases is
likely to have biased any genuine association towards the
null. The low prevalence of maternal CMD that we
observed postnatally would also have reduced the study
power to detect an effect on infant undernutrition,
potentially leading to type II error.
The possible association between maternal CMD and
child undernutrition in LAMIC has captured the atten-
tion of researchers in recent years, and has been tested
using epidemiological studies of varying methodological
quality that may have contributed to the different find-
ings across settings. However, consistent and significant
associations have been observed in south Asia indepen-
dent of these and other heterogeneities.
The two previously published population-based cohort
studies [9,26], both using diagnostic measures of mater-
nal depression, present conflicting results: in periurban
South Africa no association was found with any index of
child nutritional status at 18 months [26], whereas in
rural Pakistan [9] the association was seen with categori-
cal indicators of under-nutrition at both six and 12
months (underweight: OR = 3.5; 95% CI: 1.5 - 8.6 at six
months and OR = 3.0; 95% CI: 1.5 - 6.0 at 12 months, and
stunted: OR = 3.2; 95% CI: 1.1 - 9.9 at six months; OR =
2.8; 95% CI: 1.3 - 6.1 at 12 months). Our study sample is
most comparable to the Pakistan study, although socio-
economic measures indicate greater poverty in the Ethio-
pia sample, for example, substantially lower levels of
household electricity and flush toilets compared to Paki-
stan[9]. It is possible that the level of poverty in our study
sample might have overwhelmed other factors, such as
maternal CMD, affecting the nutritional status of the
infant[29]. Outside of South Asia, most of the negative
findings from South America [14,39] and sub-Saharan
Africa [14,26] originated from population-based studies,
while most of the positive findings [7,12,13] are from
clinic-based studies. The nature of the selection bias is
not immediately evident, but the potential is clearly pres-
ent given the limited access and use of routine antenatal
and obstetric care, particularly in sub-Saharan Africa.
No proper
toilet
facilities
391(36.7) 320 36.7 344 37.2
Rubbish disposal
Buries, burns
or others
238(22.4) 192 22.0 200 21.6
Disposes on
field
826(77.6) 679 78.0 725 78.4
Table 1: Socio-demographic characteristics and sanitary conditions of the P-MaMiE cohort at baseline, and the rate of
follow-up at six and twelve months from the date of birth (Continued)
Medhin et al. BMC Psychiatry 2010, 10:32
/>Page 8 of 13
Table 2: Infant nutritional status at the age of six and twelve months stratified by antenatal and postnatal maternal CMD
Scale of
outcome
Timing and level of CMD SRQ > = 6
indicating higher level of morbidity
Six month time point One year time point
Nutritional status as binary outcome Underweight
Number (%)
Stunting
Number(%)
Underweight
Number(%)
Stunting
number(%)
Pregnancy
Low SRQ score 161(21.0) 205(26.9) 167(20.5) 386(47.8)
High SRQ score 27(27.6) 25(25.0) 28(25.7) 55(50.9)
P-value* 0.15 0.72 0.21 0.54
Two month postnatal
Low SRQ score 182(22.0) 220(26.8) 188(21.4) 421(48.3)
High SRQ score 6(15.8) 10(25.6) 6(14.3) 18(43.9)
p-value* 0.43 1.00 0.34 0.63
Pregnancy or postnatal
Low SRQ at all time point 160(21.3) 201(26.9) 162(20.5) 375(47.7)
High SRQ score at both time points 5(21.7) 6(25.0) 2(8.3) 9(39.1)
High SRQ score at Postnatal only 1(6.7) 4(26.7) 4(22.2) 9(50.0)
High SRQ score at Pregnancy only 22(29.3) 19(25.0) 26(30.6) 46(54.1)
p-value* 0.22 0.99 0.07 0.56
Nutritional status as continuous outcome
Weight-for-
age Z score
Mean(SE)
Height-for-
age Z-score
Mean(SE)
Weight-for-
age Z score
Mean(SE)
Height-for-
age Z-score
Mean(SE)
Pregnancy
Low SRQ score -1.08(0.05) -1.07(0.06) -1.05(0.04) -2.03(0.05)
High SRQ score -1.20(0.14) -1.17(0.14) -1.16(0.14) -2.08(0.17)
P-value* 0.38 0.55 0.37 0.74
Two month postnatal
Low SRQ score -1.10(0.04) -1.08(0.06) -1.07(0.04) -2.03(0.05)
High SRQ score -0.84(0.18) -1.15(0.25) -0.93(0.15) -2.15(0.24)
p-value* 0.21 0.79 0.50 0.63
Pregnancy or postnatal
Low SRQ at all time point -1.11(0.05) -1.10(0.06) -1.06(0.05) -2.05(0.05)
High SRQ score at both time points -1.28(0.16) -1.17(0.15) -1.32(0.16) -2.10(0.19)
High SRQ score at Postnatal only -0.70(0.20) -1.11(0.41) -1.27(0.19) -2.25(0.27)
High SRQ score at Pregnancy only -0.93(0.27) -1.18(0.31) -0.67(0.20) -2.07(0.38)
p-value* 0.95 0.92 0.12 0.92
Medhin et al. BMC Psychiatry 2010, 10:32
/>Page 9 of 13
Table 3: Unadjusted, partially adjusted and fully adjusted effect of antenatal only, incident postnatal and chronic CMD on
infant undernutrition at the age of six and twelve months in the P-MaMiE study
Model Timing for main
exposure
Six month time point One year time point
Underweight
OR(95% CI)
Stunting
OR(95% CI)
Underweight
OR(95% CI)
Stunting
OR(95% CI)
Unadjusted
Never exposed 1 1 1 1
Pregnancy only 1.53(0.91, 2.60) 0.90(0.52, 1.56) 1.71(1.05, 2.80) 1.30(0.83, 2.03)
Postnatal only 0.26(0.03, 2.02) 0.99(0.31, 3.13) 1.11(0.36, 3.42) 1.10(0.43, 2.80)
Both time points 1.03(0.38, 2.81) 0.90(0.35, 2.31) 0.35(0.08, 1.52) 0.71(0.30, 1.65)
Adjusted for
Household
characteristics
Never exposed 1 1 1 1
Pregnancy only 1.44(0.82, 2.54) 0.90(0.51, 1.58) 1.46(0.86, 2.47) 1.12(0.70, 1.79)
Postnatal only 0.33(0.04, 2.57) 0.97(0.30, 3.09) 1.31(0.41, 4.17) 1.26(0.28, 3.26)
Both time points 1.09(0.40, 3.03) 0.89(0.35, 2.29) 0.32(0.07, 1.40) 0.68(0.29, 1.62)
Maternal
characteristics
Never exposed 1 1 1 1
Pregnancy only 1.65(0.95, 2.87) 0.84(0.47, 1.50) 1.54(0.91, 2.63) 1.27(0.79, 2.04)
Postnatal only 0.23(0.03, 1.78) 0.87(0.27, 2.78) 0.99(0.32, 3.13) 1.04(0.40, 2.26)
Both time points 0.98(0.35, 2.73) 0.82(0.32, 2.14) 0.30(0.07, 1.30) 0.69(0.29, 1.63)
Infant
characteristics
Never exposed 1 1 1 1
Pregnancy only 1.68(0.97, 2.91) 0.98(0.56, 1.71) 1.75(1.05, 2.94) 1.39(0.87, 2.21)
Postnatal only 0.30(0.04, 2.34) 0.98(0.31, 3.14) 1.17(0.38, 3.61) 1.08(0.42, 2.75)
Both time points 0.98(0.36, 2.70) 0.87(0.34, 2.23) 0.35(0.08, 1.49) 0.70(0.30, 1.64)
Feeding practices
Never exposed 1 1 1 1
Pregnancy only 1.68 (0.97, 2.91) 0.98(0.56, 1.71) 1.75(1.05, 2.93) 1.39(0.87, 2.21)
Postnatal only 0.30(0.04, 2.34) 0.98(0.31, 3.14) 1.17(0.38, 3.61) 1.08(0.42, 2.75)
Both time points 0.98(0.36, 2.70) 0.87(0.34, 2.23) 0.35(0.08, 149) 0.70(0.30, 1.64)
Fully adjusted
Never exposed 1 1 1 1
Pregnancy only 1.43(0.76, 2.71) 0.86(0.46, 1.62) 1.07(0.58, 1.97) 1.14(0.67, 1.96)
Postnatal only 0.21(0.02, 1.86) 0.67(0.20, 2.27) 1.07(0.33, 3.62) 1.06(0.39, 2.94)
Both time points 0.85(0.29, 2.50) 0.64(0.24, 1.73) 0.25(0.06, 1.15) 0.66(0.27, 1.63)
From Literature
Rahman et al
2004**
Chronic cases 5.9(2.7, 12.8) 5.5(1.9, 16.0) 3.5(2.2, 5.6) 3.2(1.9, 5.6)
** Measures of association reported by the authors are unadjusted estimates of relative risks
Medhin et al. BMC Psychiatry 2010, 10:32
/>Page 10 of 13
Table 4: unadjusted, partially adjusted and fully adjusted effect of antenatal and postnatal prevalent CMD on infant
undernutrition at the age of six and twelve months in the P-MaMiE study
Model Timing for
main exposure
Six month time point One year time point
Underweight
OR(95% CI)
Stunting
OR(95% CI)
Underweight
OR(95% CI)
Stunting
OR(95% CI)
Unadjusted
Antenatal 1.43(0.89,2.30) 0.91(0.56, 1.46) 1.34(0.84, 2.12) 1.13(0.76, 1.70)
Postnatal 0.66(0.27, 1.61) 0.94(0.45, 1.97) 0.61(0.25, 1.47) 0.84(0.45, 1.58)
Adjusted for
Household
characteristics
Antenatal 1.37(0.83, 2.27) 0.90(0.55, 1.47) 1.13(0.69, 1.84) 1.00(0.65, 1.52)
Postnatal 0.76(0.31, 1.87) 0.93(0.44, 1.95) 0.63(0.26, 1.54) 0.88(0.46, 1.68)
Maternal
characteristics
Antenatal 1.50(0.91, 2.48) 0.84(0.50, 1.39) 1.17(0.71, 1.92) 1.10(0.72, 1.69)
Postnatal 0.60(0.24, 1.47) 0.85(0.40, 1.80) 0.53(0.22, 1.29) 0.80(0.42, 1.52)
Infant
characteristics
Antenatal 1.50(0.92, 2.46) 0.96(0.59, 1.56) 1.33(0.82, 2.14) 1.18(0.78, 1.79)
Postnatal 0.68(0.28, 1.65) 0.91(0.44, 1.91) 0.62(0.26, 1.49) 0.82(0.44, 1.55)
Feeding practices
Antenatal 1.52(0.93, 2.49) 0.96(0.59, 1.57) 1.32(0.82, 2.13) 1.18(0.78, 1.78)
Postnatal 0.67(0.28, 1.65) 0.92(0.44, 1.92) 0.61(0.25, 1.47) 0.81(0.43, 1.53)
Fully Adjusted
Antenatal 1.28(0.73, 2.24) 0.80(0.46, 1.38) 0.81(0.46, 1.43) 1.00(0.62, 1.60)
Postnatal 0.56(0.22, 1.46) 0.66(0.30, 1.45) 0.52(0.21, 1.32) 0.80(0.40, 1.59)
Available Evidence
from relevant
Literature
Rahman et al 2004 Antenatal 3.5(1.5, 8.6) 3.2(1.1, 9.9) 3.0(1.5, 6.0) 2.8(1.3, 6.1)
Adewuya et al 2008 Postnatal 4.21(1.34, 13.20) 3.34(1.18, 9.55)
Adewuya et al 2008
§
Postnatal 3.19(1.21, 8.40) 3.21(1.03 10.47)
Patel et al 2003 ** Postnatal Varies between
2.5 and 3.5
Varies between
3.2 and 3.6
Rahman et al 2004** Postnatal 2.8(1.2, 6.8)
Anoop et al 2004*** Postnatal 3.1(0.9, 9.7)
Tomlinson et al 2006+ Postnatal 0.25(0.03, 2.09) 1.78(0.69, 4.63)
Tomlinson et al 2006++ Postnatal 2.32(0.90, 6.00) 2.52(0.98, 6.47)
Tomlinson et al
2006+++
Postnatal 1.10(0.27, 4.46) 2.44(0.70, 8.58)
Harpman etal 2005 (ET) Postnatal 1.1(0.9, 1.3) 0.9(0.7, 1.1)
Harpman etal 2005 (PE) Postnatal 0.8(0.6, 1.1) 1.1(0.9, 1.4)
Medhin et al. BMC Psychiatry 2010, 10:32
/>Page 11 of 13
The timing of measurement of infant undernutrition
could have relevance, with the two previously negative
studies from sub-Saharan Africa evaluating children at an
older age: 18 months[26] and 6 to 18 months (>50% over
12 months of age)[14]. Similarly for the negative study
from Jamaica (9 to 30 months) [25]. In the Nigeria study,
a significant association between postnatal CMD and
infant undernutrition was only found at three and six, but
not at nine months of age[12]. Although the Bangladesh
study found the reverse, that maternal CMD was only
associated with infant undernutrition at 12 months and
not at six months, this is likely to have occurred because
maternal CMD was measured at 12 months and thus
showed a stronger association concurrently[11]. How-
ever, in our Ethiopia study, no association with infant
undernutrition was apparent at either six or 12 months of
age.
Most previous studies reported categorical indicators
of infant nutritional status. Where the analyses were
repeated for both categorical and continuous nutritional
indices, only the categorical measure was associated with
maternal CMD in Brazil[15,39], and neither were associ-
ated in South Africa[26], the latter in keeping with our
study. When the two have been compared in the same
study, impaired linear growth (length-for-age; stunting)
has more often been associated with maternal CMD than
the composite nutritional indicator of weight-for-
age[11,13,39]. In our study we used both length-for-age
and weight-for-age as nutritional indicators, and neither
was associated with maternal CMD.
Although our study adjusted for a broader range of
potential confounding variables than most other studies,
there is little evidence that over-adjustment occurred as
no positive associations were observed in the univariate
analyses.
Persistent perinatal CMD could impact on nutrition
during pregnancy and after birth. The nature of any inter-
action between CMD in pregnancy and the postnatal
period to cause under-nutrition is unclear. Contrary to
the current findings there is strong evidence in Pakistan
[9] showing that chronic perinatal CMD significantly
increases the risk of infant underweight (relative risk (RR)
= 5.9; 95% CI: 2.7 to 12.8 at six months, RR = 3.5; 95% CI:
2.2 to 5.6 at 12 months) and stunting (RR = 5.5; 95% CI:
1.9 to 16.0 at 6 months and RR = 3.2; 95% CI: 1.9 to 5.4 at
12 months). However, in the Pakistan study there was lit-
tle remission of depression in pregnancy, or incidence of
postnatal depression. A very low prevalence of persistent
CMD in the current study compromised the power to
detect any meaningful effect.
Including the current study, five other studies, from
Ethiopia [14], South Africa [26], Brazil [39], Peru [14] and
Jamaica [25] have failed to replicate the association
between maternal CMD and infant undernutrition seen
in South Asia[6,8-11,14]. We have previously found that
maternal CMD in pregnancy in this Ethiopian cohort was
not associated with low birth weight[29], again in con-
trast to the findings from South Asia. The true absence of
an adverse effect of maternal CMD in pregnancy or the
postnatal period on child nutritional status in Ethiopia is
thus possible. When interpreting their negative findings
from Ethiopia and Peru compared to India and Vietnam,
Harpham et al. call for qualitative exploration for the rea-
sons for such differences and speculate that the 'pres-
surised cultural role of women in relation to childcare' in
South Asia might be exacerbated by a child who is failing
to thrive, leading to worsening maternal mental
health[14]. In Ethiopia, shared parenting practices within
families and neighbourhoods may have diluted any nega-
tive effect of postnatal and persistent CMD. Informal
feedback from our project data collectors suggests that
children in this community are considered as potential
future capital, giving higher parity mothers an elevated
social rank compared to mothers of the same age with a
smaller number of children. One of the common reasons
to justify polygamous marriage in the community is the
demand for more children by the husband. This could
mean that maternal CMD becomes less prevalent and/or
Harpman etal 2005 (VE) Postnatal 1.3(1.0, 1.7) 1.2(0.9, 1.7)
Harpman etal 2005 (IN) postnatal 1.1(0.9, 1.3) 1.4(1.2, 1.6)
Surkan et al 2008
§§
postnatal 0.6(0.2, 1.7) 1.8(1.1, 2.8)
* the models are not fully adjusted and hence no single estimate for adjusted odds ratio
** The result is for nine month rather than for 12 months of infant age
*** The result is at a median infant age of 10.5 month rather than 12 months of age
+ unadjusted effect of concurrent CMD at two month time point
++ unadjusted effect of two month postnatal CMD on 18 month nutritional status
+++ unadjusted effect of concurrent CMD at 18 month of age
§
unadjusted effect of postnatal CMD on three month nutritional status
§§ Reported effects are on nutritional status of 6-24 year old children
ET = Ethiopia; PE = Peru, VE = Vetnam; IN = India
Table 4: unadjusted, partially adjusted and fully adjusted effect of antenatal and postnatal prevalent CMD on infant
undernutrition at the age of six and twelve months in the P-MaMiE study (Continued)
Medhin et al. BMC Psychiatry 2010, 10:32
/>Page 12 of 13
severe as the family expands, and the presence of more
siblings for the child also facilitates shared parenting.
However, at this stage there are no clear answers for why
maternal mental disturbance appears to have such a sig-
nificant effect on child growth in some countries and not
in other countries, including Ethiopia.
Conclusions
Our population-based study from rural Ethiopia found
no significant association between maternal perinatal
CMD (i.e. during the third trimester of pregnancy, two
months postnatal and persistently from pregnancy up to
two month postnatal) and infant undernutrition at six or
twelve months of age. This result, in the context of other
research, questions the universality of the proposed
causal link between CMD and impaired infant growth
across LAMIC.
Competing interests
The authors declare that they have no competing interests.
Authors' contributions
CH, MP, AA conceived the idea and CH designed the study. GM and CH devel-
oped data collection instruments, coordinated data collection and have full
access to the raw data. GM analysed the data and drafted the manuscript. CH,
MD, and MP contributed to data analysis. CH, MD, MP, VP, MH, MT, FT critically
commented on the draft manuscript. All authors contributed to and have
approved the final manuscript.
Acknowledgements
This study was funded by the Wellcome Trust (research training fellowship for
Dr Charlotte Hanlon). We are grateful to UNICEF who provided 18 weighing
scales to participating district health bureaus, used for weighing the infants.
The study would not have been possible without the full cooperation of the
participating women and infants. We appreciate their generosity to give of
their time and energy to complete interviews. Many thanks also go to the P-
MaMiE data collectors and data entry clerks.
Author Details
1
Aklilu Lemma Institute of Pathobiology, Addis Ababa University, Addis Ababa,
Ethiopia,
2
Department of Psychiatry, Faculty of Medicine, Addis Ababa
University, Addis Ababa, Ethiopia,
3
King's College London (Institute of
Psychiatry), Health Service and Population Research Department, London, UK,
4
Department of Reproductive Health and Nutrition, School of Public Health,
Addis Ababa University, Addis Ababa, Ethiopia,
5
Department of Gynaecology
and Obstetrics, Faculty of Medicine, Addis Ababa University, Addis Ababa,
Ethiopia,
6
Department of Paediatrics and Child Health, Faculty of Medicine,
Addis Ababa University, Addis Ababa, Ethiopia,
7
Department of Psychology,
Stellenbosch University, Matieland, South Africa,
8
London School of Hygiene
and Tropical Medicine, UK and
9
Sangath, Santemol, Sonarwaddo, Raia,
Salcette - Goa - India
References
1. World Bank: Repositioning nutrition as central to development: a
strategy for large-scale action. 2006 [http://
siteresources.worldbank.org/NUTRITION/Resources/281846-
1131636806329/NutritionStrategy.pdf].
2. Black RE, Allen LH, Bhutta ZA, Caulfield LE, de Onis M, Ezzati M, Mathers C,
Rivera J: Maternal and child undernutrition: global and regional
exposures and health consequences. The Lancet 2008,
371(9608):243-260.
3. UNICEF: The state of the world's children 2009: maternal and newborn
health. New York, USA; 2008.
4. Engle PL, Menon P, Garrett JL, Slack A: Urbanization and caregiving: a
framework for analysis and examples from southern and eastern
Africa. Environment and Urbanization 1997, 9(2):253-270.
5. Prince M, Patel V, Saxena S, Maj M, Maselko J, Phillips MR, Rahman A: No
health without mental health. The Lancet 2007, 370(9590):859-877.
6. Anoop S, Saravanan B, Joseph A, Cherian A, Jacob KS: Maternal
depression and low maternal intelligence as risk factors for
malnutrition in children: a community based case-control study from
South India. Arch Dis Child 2004, 89(4):325-329.
7. de Miranda CT, Turecki G, Mari J de J, Andreoli SB, Marcolim MA, Goihman
S, Puccini R, Strom BL, Berlin JA: Mental health of the mothers of
malnourished children. Int J Epidemiol 1996, 25(1):128-133.
8. Patel V, DeSouza N, Rodrigues M: Postnatal depression and infant
growth and development in low income countries: a cohort study
from Goa, India. Arch Dis Child 2003, 88(1):34-37.
9. Rahman A, Iqbal Z, Bunn J, Lovel H, Harrington R: Impact of maternal
depression on infant nutritional status and illness: a cohort study. Arch
Gen Psychiatry 2004, 61(9):946-952.
10. Rahman A, Lovel H, Bunn J, Iqbal Z, Harrington R: Mothers' mental health
and infant growth: A case-control study from Rawalpindi, Pakistan.
Child: Care, Health & Development 2004, 30(1):21-27.
11. Black MM, Baqui AH, Zaman K, Arifeen SE, Black RE: Maternal depressive
symptoms and infant growth in rural Bangladesh. Am J Clin Nutr 2009,
89(3):951S-957.
12. Adewuya AO, Ola BO, Aloba OO, Mapayi BM, Okeniyi JAO: Impact of
postnatal depression on infants' growth in Nigeria. Journal of Affective
Disorders 2008, 108(1-2):191-193.
13. Stewart RC, Umar E, Kauye F, Bunn J, Vokhiwa M, Fitzgerald M, Tomenson
B, Rahman A, Creed F: Maternal common mental disorder and infant
growth - a cross-sectional study from Malawi. Maternal & Child Nutrition
2008, 4(3):209-219.
14. Harpham T, Huttly S, De Silva MJ, Abramsky T: Maternal mental health
and child nutritional status in four developing countries. J Epidemiol
Community Health 2005, 59(12):1060-1064.
15. Surkan PJ, Kawachi I, Ryan LM, Berkman LF, Carvalho Vieira LM, Peterson
KE: Maternal Depressive Symptoms, Parenting Self-Efficacy, and Child
Growth. Am J Public Health 2008, 98(1):125-132.
16. Cooper PJ, Tomlinson M, Swartz L, Woolgar M, Hurray L, Holteno C: Post-
partum depression and the mother-infant relationship in a South
African peri-urban settlement. British Journal of Psychiatry 1999,
175:554-558.
17. Rahman A, Harrington R, Bunn J: Can maternal depression increase
infant risk of illness and growth impairment in developing countries?
Child: Care, Health and Development 2002, 28(1):51-56.
18. Beck CT: The effects of postpartum depression on maternal-infant
interaction: A meta-analysis. Nursing Research 1995, 44:298-304.
19. Tomlinson M, Cooper P, Murray L: The mother-infant relationship and
infant attachment in a South African peri-urban settlement. Child Dev
2005, 76(5):1044-1054.
20. Patel V, Rahman A, Jacob KS, Hughes M: Effect of maternal mental health
on infant growth in low income countries: New evidence from South
Asia. British Medical Journal 2004, 328(7443):820-823.
21. Rahman A, Bunn J, Lovel H, Creed F: Association between antenatal
depression and low birthweight in a developing country. Acta Psychiatr
Scand 2007, 115(6):481-486.
22. Patel V, Prince M, Patel V, Prince M: Maternal psychological morbidity
and low birth weight in India. Br J Psychiatry 2006, 188:284-285.
23. Ferri C, Mitsuhiro S, Barros M, Chalem E, Guinsburg R, Patel V, Prince M,
Laranjeira R: The impact of maternal experience of violence and
common mental disorders on neonatal outcomes: a survey of
adolescent mothers in Sao Paulo, Brazil. BMC Public Health 2007,
7(1):209.
24. Rahman A, Bunn J, Lovel H, Creed F: Maternal depression increases
infant risk of diarrhoeal illness: a cohort study. Arch Dis Child 2007,
92(1):24-28.
25. Baker-Henningham H, Powell C, Walker S, Grantham-McGregor S:
Mothers of undernourished Jamaican children have poorer
psychosocial functioning and this is associated with stimulation
provided in the home. European Journal of Clinical Nutrition 2003,
57(6):786-792.
Received: 10 September 2009 Accepted: 30 April 2010
Published: 30 April 2010
This article is available from: 2010 Medhin et al; licensee BioMed Central Ltd. This is an Open Access article distributed under the terms of the Creative Commons Attribution License ( ), which permits unrestricted use, distribution, and reproduction in any medium, provided the original work is properly cited.BMC Psychiatry 2010 , 10:32
Medhin et al. BMC Psychiatry 2010, 10:32
/>Page 13 of 13
26. Tomlinson M, Cooper PJ, Stein A, Swartz L, Molteno C: Post-partum
depression and infant growth in a South African peri-urban
settlement. Child: Care, Health and Development 2006, 32(1):81-86.
27. Stewart RC: Maternal depression and infant growth: a review of recent
evidence. Maternal and Child Nutrition 2007, 3(2):94-107.
28. Lawn JE, Cousens S, Zupan J: 4 million neonatal deaths: When? Where?
Why? The Lancet 2005, 365(9462):891.
29. Hanlon C, Medhin G, Alem A, Tesfaye F, Lakew Z, Worku B, Dewey M, Araya
M, Abdulahi A, Hughes M, et al.: Impact of antenatal common mental
disorders upon perinatal outcomes in Ethiopia: the P-MaMiE
population-based cohort study. Trop Med Int Health 2009, 14(2):156-166.
30. Berhane Y, Wall S, Kebede D, Emmelin A, Enquselassie F, Byass P, Muhe L,
Andersson T, Deyessa N, Gossaye Y, et al.: Establishing an
epidemiological field laboratory in rural areas - potentials for public
health research and interventions: The Butajira Rural Health Programe
1987-99. The Ethiopian Journal of Health Development 1999, 13(Special):.
31. Hanlon C, Medhin G, Alem A, Araya M, Abdulahi A, Hughes M, Tesfaye M,
Wondimagegn D, Patel V, Prince M: Detecting perinatal common mental
disorders in Ethiopia: Validation of the self-reporting questionnaire
and Edinburgh Postnatal Depression Scale. Journal of Affective Disorders
2008, 108:251-262.
32. Beusenberg M, Orley J: A user's guide to the Self-Reporting
Questionnaire (SRQ). WHO Division of Mental Health. Geneva: WHO;
1994:1-73.
33. Monika B, Elaine B, de Onis M, Onyango A, Siyam A, Yang H, Erhardt J:
WHO Anthro 2005, Beta version Feb 17th: Software for assessing
growth and development of the world's children. 2006 [http://
www.who.int/childgrowth/software/en]. Geneva. WHO
34. WHO Expert Committee: Physical status: the use and interpretation of
anthropometry. In WHO Technical Report Series 854 Geneva: WHO; 1995.
35. Central Statistical Agency, ORC Macro: Ethiopian demographic and
health survey 2005. Addis Ababa, Ethiopia, and Calverton, Maryland:
CSA and ORC Macro; 2006.
36. Epidata (Version 3): A comprehensive tool for validated entry and
documentation of data. [program]. 3rd edition. Odense, Denmark: The
Epidata Association; 2003.
37. StataCorp: Stata Statistical Software Release 10. College Station, TX:
Stata Corporation; 2007.
38. Alem A, Kebede D, Kullgren G: The prevalence and socio-demographic
correlates of khat chewing in Butajira, Ethiopia. Acta Psychiatr Scand
1999, 100(S397):84-91.
39. Surkan PJ, Ryan LM, Carvalho Vieira LM, Berkman LF, Peterson KE:
Maternal social and pyschological conditions and physical growth in
low-income children in Piauí, Northeast Brazil. Social Science & Medicine
2007, 64(2):375-388.
Pre-publication history
The pre-publication history for this paper can be accessed here:
/>doi: 10.1186/1471-244X-10-32
Cite this article as: Medhin et al., The effect of maternal common mental
disorders on infant undernutrition in Butajira, Ethiopia: The P-MaMiE study
BMC Psychiatry 2010, 10:32