Báo cáo y học: " A systematic review of personality disorder, race and ethnicity: prevalence, aetiology and treatment" docx
Bạn đang xem bản rút gọn của tài liệu. Xem và tải ngay bản đầy đủ của tài liệu tại đây (664.79 KB, 14 trang )
McGilloway et al. BMC Psychiatry 2010, 10:33
/>Open Access
RESEARCH ARTICLE
BioMed Central
© 2010 McGilloway et al; licensee BioMed Central Ltd. This is an Open Access article distributed under the terms of the Creative Com-
mons Attribution License ( which permits unrestricted use, distribution, and reproduc-
tion in any medium, provided the original work is properly cited.
Research article
A systematic review of personality disorder, race
and ethnicity: prevalence, aetiology and treatment
Angela McGilloway
1
, Ruth E Hall
1
, Tennyson Lee
4
and Kamaldeep S Bhui*
2,3,4
Abstract
Background: Although psychoses and ethnicity are well researched, the importance of culture, race and ethnicity has
been overlooked in Personality Disorders (PD) research. This study aimed to review the published literature on ethnic
variations of prevalence, aetiology and treatment of PD.
Method: A systematic review of studies of PD and race, culture and ethnicity including a narrative synthesis of
observational data and meta-analyses of prevalence data with tests for heterogeneity.
Results: There were few studies with original data on personality disorder and ethnicity. Studies varied in their
classification of ethnic group, and few studies defined a specific type of personality disorder. Overall, meta-analyses
revealed significant differences in prevalence between black and white groups (OR 0.476, CIs 0.248 - 0.915, p = 0.026)
but no differences between Asian or Hispanic groups compared with white groups. Meta-regression analyses found
that heterogeneity was explained by some study characteristics: a lower prevalence of PD was reported among black
compared with white patients in UK studies, studies using case-note diagnoses rather than structured diagnostic
interviews, studies of borderline PD compared with the other PD, studies in secure and inpatient compared with
community settings, and among subjects with co-morbid disorders compared to the rest. The evidence base on
aetiology and treatment was small.
Conclusion: There is some evidence of ethnic variations in prevalence of personality disorder but methodological
characteristics are likely to account for some of the variation. The findings may indicate neglect of PD diagnosis among
ethnic groups, or a true lower prevalence amongst black patients. Further studies are required using more precise
cultural and ethnic groups.
Background
Personality Disorder (PD) is defined by the World Health
Organisation as "a severe disturbance in the charactero-
logical condition and behavioural tendencies of the indi-
vidual, usually involving several areas of the personality,
and nearly always associated with considerable personal
and social disruption"[1].
The nature, diagnosis and categorisation of PD has
been widely deliberated among mental health profession-
als, yet has been subjected to little empirical research [2].
Nonetheless, a good deal of information is known regard-
ing PD [3]. One aspect that has been overlooked that may
reveal a better understanding about the aetiology and
treatment of personality disorder is the impact of culture,
race and ethnicity on PD [2]. Black and minority ethnic
groups are known to be over-represented in mental
health services, especially in forensic and secure settings
and inpatient care. Similar studies of PD are uncommon.
PD research is fraught with problems. The category of PD
has been criticised as culturally biased [4] and that the
diagnosis is a reflection of North American and Western
European concepts of personality functioning [5]. Behav-
ioural norms in one culture may be considered deviant in
another, however, there are insufficient studies address-
ing the role of ethnicity in diagnostic practice [5]. This
study aimed to systematically review all available pub-
lished literature that addresses PD prevalence, aetiology
and treatment in relation to race and ethnicity.
Method
We searched PUBMED, EMBASE, CINAHL, PsycINFO
and Web of Science for studies relating to PD and race,
* Correspondence:
2
Centre for Psychiatry, Barts & The London School of Medicine & Dentistry, Old
Anatomy Building, Charterhouse Square, London, EC1M 6BQ, UK
Full list of author information is available at the end of the article
McGilloway et al. BMC Psychiatry 2010, 10:33
/>Page 2 of 14
culture and ethnicity. Searches were undertaken between
the 26
th
February and the 7
th
of March 2008. Inclusion cri-
teria were set widely for studies with original data on race
and ethnic group, with personality disorder as an out-
come. The subjects of the studies were adults and the set-
tings included community, specialist mental health
services and prison settings. The search was supple-
mented by forward and backward citation, manual explo-
ration of references and by contacting experts in the field
to refer us to any other relevant studies.
Of the 391 publications identified by the search, after
review of full text articles, fourteen studies met the inclu-
sion criteria for the review. Reference tracking identified
one further study resulting in a total of fifteen studies for
review (see Figure 1).
From the 15 publications (13 studies) entering the
review, the following data were extracted and tabulated
(Tables 1 &2): outcome of interest (prevalence, aetiology,
and treatment), description of methods used (study
design, procedure, diagnostic tool, statistical methods),
participants, place of study (country and setting), main
effects and data points for our outcomes of interest, and
strengths and limitations of each study. In addition to
these, a scoring system for the methodological quality
was designed by one reviewer (AM), and adapted with a
second reviewer (KB) experienced in systematic review
methods in order. Six domains were considered (see
Table 3).
The studies differed in methods and objectives. There-
fore, the observational data were subjected to a narrative
synthesis in order to identify common and recurring
themes from different papers[6] Of the fifteen papers,
seven provided raw prevalence data by ethnic group that
could be used in a meta-analysis (additional file 1). The
Figure 1 QUOROM flow chart of studies in the review.
McGilloway et al. BMC Psychiatry 2010, 10:33
/>Page 3 of 14
Table 1: Study characteristics
Author Objective Study Design Procedure Inclusion/exclusion
Mikton C. Grounds A. 2007 Examine cross-cultural
clinical judgement bias in
the diagnosis of PD in
Afro-Caribbean men
Two vignettes of male
patients, Afro-Caribbean
or white, one suggestive of
BPD the other suggestive
of ASPD sent to
psychiatrists. Participants
chose diagnosis from list.
2 vignettes sent to each
psychiatrist.
All consultants and
specialist registrars in
forensic psychiatry in the
UK included.
Al-Saffar S. Borga P. Wicks
S. Hallstrom T. 2004
Describe the distribution
of different ethnic patient
groups in Psych OPD and
influence of ethnicity, on
diagnosis.
Retrospective cohort
study using outpatients
documentation
Exploration of register for
ethnicity and diagnosis
Patients over 18 years of
age
Castaneda R. Franco H.
1985
Examine sex and ethnic
distribution of BPD in a
psychiatric inpatient
sample
Retrospective study of
1,583 inpatients
discharged in index year
using patient notes.
Patients' charts reviewed,
primary psychiatric
diagnosis and
demographics extracted.
Patients with co-existing
axis I disorder diagnosis
excluded.
Tyrer P. Merson S. Onyett
S. Johnson T. 1994
To compare community-
based and standard
hospital psychiatric
services, including PD as
an outcome.
RCT of community EIS vs
conventional hospital
psychiatric services over
14 months for psychiatric
emergency patients.
Pt assessed for PD before
being randomly assigned
to either treatment setting
for 12 weeks
Age 16-65. No alcohol/
drug dependence. No
mandatory care necessary.
Not in contact with psych
services.
Trestman RL. Ford J. Zhang
W. Wiesbrock V. 2007
To estimate percentage of
undiagnosed prison
inmates who meet
diagnostic criteria for
psychiatric illness.
Newly admitted patients
in 5 prisons assessed for
psychiatric illness.
All participants
interviewed once for
screening. Random
sample further
interviewed by 5 trained
assessors
Excluded: under 18, high
bonds, those in security
restricted housing, already
under medical/mental
health care
Maden A. Friendship T.
McClintock T. Rutter S.
1999
To test the hypothesis that
there are systematic
differences in clinical
outcome in patients of
different ethnic origin.
Longitudinal cohort study
of discharges from a
medium secure unit
(average follow up 6.6 yrs)
Admission & short term
data from MDT records.
Long term info from all
med records, Home Office
Register, Prison records,
Offenders index, NHS
central record, Special
Hospitals case register, &
semi-structured
interviews
All patients discharged
from a first admission to
The Denis Hill Unit of the
Bethlem Royal Hospital
from Oct 1980 till Oct 1994
Coid J. Petruckevitch A.
Bebbington P. Brugha T.
Bhugra D. et al 2002
To estimate population-
based rates of
imprisonment in different
ethnic groups, & compare
criminal behaviour &
psychiatric morbidity
Examination of home
office data on all inmates,
and cross-sectional survey
of remanded and
sentenced prisoners in
1997
Survey comprised lay
interviews/self
administered, then every
5th participant had follow-
up interview by clinician
All prisoners on remand or
sentenced in England &
Wales in 1997 included.
Coid J. Petruckevitch A.
Bebbington P. Brugha T.
Bhugra D. et al 2002
To compare early
environmental risks,
stressful daily living
experiences & reported
use of psych services in
prisoners from diff ethnic
grps
Examination of home
office data on all inmates,
and cross-sectional survey
of remanded and
sentenced prisoners in
1997
Survey comprised lay
interviews/self
administered, then every
5th participant had follow-
up interview by clinician
All prisoners on remand or
sentenced in England &
Wales in 1997 included.
McGilloway et al. BMC Psychiatry 2010, 10:33
/>Page 4 of 14
Coid J. Kahtan N. Gault S.
Jarman B. 2000
To estimate population-
based prevalence rates of
treated mental disorder in
different ethnic groups
compulsorily admitted to
secure forensic psychiatry
services
Retrospective survey of
3155 first admissions from
1988 to 1994 from half of
England and Wales with
1991 census data as the
denominator adjusted for
under-enumeration
Item sheets completed
from case notes. Data
collected by clinically
trained research
psychiatrist
Those with no fixed abode
excluded
Coid J. Kahtan N. Gault S.
Jarman B. 1999
To compare patients with
PD and mental illness
according to demography,
referral, criminality,
previous
institutionalisation and
diagnostic comorbidity
Retrospective survey of all
admissions from 1988 to
1994 from 7 (of 14)
regional health authority
catchment areas in
England & Wales
One researcher completed
item sheet for every
admission. recorded
demography, nature of
referral, legal status &
catchment of origin
All admissions of pts with
PD to special hospitals and
MSU from a
geographically
representative area
Bender DS. Skodol AE.
Dyck IR. Markowitz JC.
Shea MT. et al 2007
To explore whether PD
psychopathology raises
particular challenges to
treatment-seeking ethnic
minorities receiving
adequate mental health
services
2 year prospective study:
of patients recently
treated or seeking
treatment from clinical
services. Follow up at 6, 12,
24 months.
Experienced research
clinicians determined 1 of
4 PD Δ: Schizotypal (STPD),
BPD, Avoidant (AVPD) &
Obsessive-compulsive
(OCPD) by interview
Treatment-seeking/
recently treated pts 18-45.
Exclusion: active
psychosis, acute
substance intoxication/
withdrawalhistory of
schizophrenia/
schizoaffective/
schizophreniform
disorders
Chavira DA. Grilo CM. Shea
T. Yen S. Gunderson JG. et
al 2003
Compare the relative
proportion of 4 PDs
among 3 ethnic grps in a
clinical sample & examine
whether specific PD
criteria accounted for
difference in ethnic
distribution
Survey/Questionnaire.
Patients filled out
Personality Screening
Questionnaire: If +ve for 1
or more PDs they were
referred for further
assessment. Also
completed Depression
Screening Questionnaire:
If +ve were referred as
potential controls
Patients interviewed by
trained & experienced
interviewers using DSM-IV
& Personality Assessment
form. Patients also asked
to fill in self-report
questions. If DSM-IV
supported by any
instrument, patients were
assigned to PD
Treatment-seeking/
recently treated patients,
aged 18-45. Exclusion:
active psychosis, acute
substance intoxication/
withdrawal, history of
schizophrenia/
schizoaffective/
schizophreniform
disorders
Iwamasa GY. Larrabee AL.
Merritt RD. 2000
Assess possible ethnicity
criterion bias of DSM-III-R
PDs using a lay sample of
college undergraduates
with no previous
education on
psychological disorders
Random card-based task
with personality
characteristics to be sorted
by participants' own
beliefs not stereotypes.
Participants sorted cards 3
separate times by
ethnicity
College students
unfamiliar with DSM-III-R
excluded
Huang B. Grant BF.
Dawson DA. Stinson FS.
Chou SP. Et al 2006
Compare the current
prevalence & co-
occurrence of DSM-IV,
alcohol & drug use
disorders & mood, anxiety
& PDs among whites,
blacks, Native Americans,
Asians & Hispanics in a
large representative
sample of the US
population
Face-to-face survey of
43093 participants by
National Epidemiological
Survey on Alcohol and
Related Conditions
(NESARC).
Interview administered
using laptop computer-
assisted software. Used
professional interviewers
from US Bureau
Civilian non-
institutionalised
respondents aged 18+.
Table 1: Study characteristics (Continued)
McGilloway et al. BMC Psychiatry 2010, 10:33
/>Page 5 of 14
software package Comprehensive Meta Analysis (version
2) was used to calculate odds ratios for PD in an ethnic
compared to white group. Heterogeneity was calculated
using I
2
as this is more useful than Cochran's Q value in
showing the extent of heterogeneity in small samples [7].
A value of zero reflects true homogeneity amongst stud-
ies whilst values above this show the presence of hetero-
geneity. Values around I
2
= 25, 50 and 75 reflect low,
moderate and high heterogeneity respectively[7]. Where
I
2
exceeded 75, a random effects model was used, below
this level a fixed effects model was used.
In order to further explore possible causes of between-
study heterogeneity, meta-regression analyses were per-
formed (see Table 4). These compared black with white
groups by the following characteristics: US and UK stud-
ies; community, inpatient and prison settings; secure and
non-secure inpatient settings; use of an interview sched-
ule and no interview schedule; different diagnoses (anti-
social personality disorder, borderline personality
disorder and both combined); and personality disorder
diagnosis alone and with co-morbidity. Age and gender of
participants were not extracted as only three studies pro-
vided this data.
Results
Of the 15 studies reviewed, 9 were of moderate quality
and 5 of high quality. Studies included surveys, cohorts,
cross-sectional and randomised controlled trials, and
took place in a variety of environments including civilian
populations, prisons, forensic units, psychiatric emer-
gency clinics, and both inpatient and outpatient settings;
studies were equally from the US and the UK.
Defining PD
Interview schedules were used to establish PD prevalence
in three studies; the schedules included the NIMH Diag-
nostic Interview Schedule Version III-R [8], the Alcohol
Use Disorder and Associated Disabilities Interview
Schedule-DSM IV version [9], the Structured Clinical
Interview for DSM-IV Axis II [10], and the Structured
Clinical Interview for DSM-IV, Patient Version[10] The
other four studies relied on case-notes. In two studies
[11,12] the researchers reviewed patient notes and made
the diagnostic decision according to DSM-IV Axis II cri-
teria. One study used the primary psychiatric diagnosis
given in discharge summaries from an inpatient psychiat-
ric unit [13] and the other relied on diagnoses in case
notes [14]. An array of PD diagnoses were included by
authors including antisocial, borderline, paranoid, schiz-
oid, dependent, avoidant, anankastic, and histrionic.
Only four studies contained data for specific diagnoses
by ethnic group, these were for borderline PD [10,13],
antisocial PD [8.10], and the two combined [10,12]. Only
three studies contained prevalence data for PD alone
without co-morbidity [9,10,13]. The prevalence data of
the other studies included other psychiatric co-morbidity
and substance dependence disorders.
Prevalence
Most studies were concerned with white participants in
comparison with black participants. Subgroups of the
white ethnic group were not shown in any paper. Five
papers failed to provide an ethnic distinction between
black sub-groups [7-11]. Five studies (2 of which were
scored as high quality) found black populations to have a
statistically significant lower prevalence of PD than white
populations [11,12,14-16]. One of these studies also
determined that Asian populations (from India, Bangla-
desh and Pakistan) were also less likely to have a PD than
white populations [OR 0.1, 95% Confidence Interval (CI)
0.03-0.41, p < 0.05] [12]. However, in contrast to these
findings, one large epidemiological survey of a civilian
non-institutionalised population determined the
weighted prevalence of PD was greater in black popula-
tions (16.6%) than white (14.6%) [p < 0.05] [9].
Seven studies were identified as containing raw preva-
lence data suitable for meta-analysis (additional file 1) [8-
14]. All seven studies contained data for black and white
participants; in total there were 10356 black participants,
and 29954 white participants. The term 'black' includes
African-American, African, Afro-Caribbean, and black
Other, as used by the original authors. Two studies con-
Compton WM. Cottler LB.
Abdallah AR. Phelps DL.
Spitznagel EL. & Horton JC.
2000
Determine the rates of
specific psychiatric
disorders among drug
dependent persons in
treatment and determine
whether these rates vary
by race (and gender)
Interview-based study of
newly admitted patients.
Two face-to-face interview
sessions 12 months apart.
Subjects randomly
selected from lists of newly
admitted pts from the data
from a longitudinal study
of substance abusers 1
st
Substance abusers who
were recently admitted to
drug treatment facilities in
St Louis.
PD: Personality Disorder
RCT: Randomised Control Trial
EIS: Early intervention Service
MSU: Medium Secure Unit
Table 1: Study characteristics (Continued)
McGilloway et al. BMC Psychiatry 2010, 10:33
/>Page 6 of 14
Table 2: Study results
Author Results Prevalence
Mikton C. Grounds A. 2007 Vignette 1 (BPD): no sig diff in diagnosis PD. Vignette 2 (ASPD):
More Caucasian than afro-Caribbean diagnosed ASPD (OR 2.6,
95% CI 1.5-4.4, p = 0.0006) or with any PD (OR 2.7, 1.6-4.7, p =
0.0002). Clinicians 2.8 (1.6-5.0 p < 0.001) times more likely to
attribute any PD to Caucasian than afro-Caribbean. Non-white
clinicians are 2.2 (1.1-4.6 p = 0.04) times more likely than white
clinicians to attribute a diagnosis of any PD to vignette II
Not real pts - hypothetical examples
Al-Saffar S. Borga P. Wicks S.
Hallstrom T. 2004
PD related to Swedish origin OR 2.16, CI 1.51-3.09, p = 0.05.
Castaneda R. Franco H. 1985 Females at least 3 times more likely than males to have BPD,
except in Hispanic population where no diff found. Black: t = 2.57
df 23 p < 0.02. White: t = 2.72 df 39 p < 0.01. More Hispanic men
were diagnosed with BPD than white or black men (x2 = 4.39, df
1, p < 0.05). No sig diff among females of diff ethnic grps. No sig
diff among ethnic grps overall
101/1583 inpatient sample had PD:
White 41/101 (40.6%) Black 25/101
(24.8%) Hispanic 34/101 (33.7%)
Other 1/101 (0.9%) In each
population: White 41/577 (7.1%)
Black 25/558 (4.5%) Hispanic 34/402
(8.5%) Other 1/46 (2.2%)
Tyrer P. Merson S. Onyett S. Johnson
T. 1994
63% Caucasian patients diagnosed with PD compared to only
25% of other races (mostly Afro-Caribbean) x2 12.4, df 1, p < 0.001
OR 0.2 (0.07-0.6)
63% Caucasian patients diagnosed
with PD compared to only 25% of
other races (mostly Afro-Caribbean)
x2 = 12.4, df 1, p < 0.001 OR 0.2 (0.07-
0.6)
Trestman RL. Ford J. Zhang W.
Wiesbrock V. 2007
No significant differences between race in ASPD or BPD. Hispanic
men (56.7%) were more likely to meet the criteria for Cluster B
diagnosis than white (39.7%) or black (37.7%) men (x2 = 7.18, 2 df,
p < 0.05) Hispanic men more likely to ASPD (53.7%) than white
(35.7%) or black (35.5%) (x2 = 7.18, 2 df, p < 0.05)
Axis II disorder: White 5.1% (12/218)
Black 5.7% (10/177) Hispanic 11%
(12/110) ASPD: White 30.7% Black
32.4% Hispanic 45.9% BPD: White
20.3% Black 11.6% Hispanic 17.4%
Maden A. Friendship T. McClintock T.
Rutter S. 1999
White patients had a higher incidence of PD compared to black
patients (22% vs 6% OR = 4.52 95% CI 1.79-11.4 no p value given,
although discussed as statistically significant)
In ethnic pop: White 28/125 (22% of
white pop) Black 6/100 (6% of black
pop) With PD: White 28/34 (82.4%)
Black 6/34 (17.6%) In sample: White
28/225 (12.4%) Black 6/225 (2.7%)
Overall 34/225 (15.1%)
Coid J. Petruckevitch A. Bebbington
P. Brugha T. Bhugra D. et al 2002
For any PD, black men had a lower risk than white men in
unadjusted analyses: OR 0.67 (0.51-0.88) p = 0.004. These findings
are not sustained in adjusted analyses. South Asian men similarly
had a lower risk than whites (OR 0.54 (0.33-0.87) p = 0.012)
respectively. Conversely, more women prisoners received a
diagnosis of PD than white females (adjusted OR 2.31 (1.27-4.2) p
= 0.006)
Raw figures not provided, only
calculated ORs
Coid J. Petruckevitch A. Bebbington
P. Brugha T. Bhugra D. et al 2002
Black people with PD less likely to have had prior treatment than
white people. White pop more likely to have PD: Black men OR
0.49 (0.27-0.9) p = 0.022 Black women OR 0.13 (0.05-0.34) p <
0.001. White women were more likely to have the following PDs
compared with black women: OCD, Paranoid, Schizotypal, BPD
and Antisocial PD
Raw figures not provided, only
calculated ORs
McGilloway et al. BMC Psychiatry 2010, 10:33
/>Page 7 of 14
Coid J. Kahtan N. Gault S. Jarman B.
2000
For any PD, black patients had less risk than whites (OR 0.22 (0.15-
0.31) p < 0.001), Asians also had lower risk OR 0.1 (0.03-0.41) [p <
0.001]
In ethnic pop: White 452/2224 (20%)
Black 33/628 (5%) Asian 2/80 (3%)
With PD: White 452/487 (92.8%)
Black 33/487 (6.8%) Asian 2/487
(0.4%) Entire sample: White 452/
2932 (15.4%) Black 33/2932 (0.01%)
Asian 2/2932 (0.06%)
Coid J. Kahtan N. Gault S. Jarman B.
1999
Patients w PD more likely to be Caucasian (470/511 92%) than
were those with mental illness (1833/2575 71%) OR 4.62, 3.32-
6.43 p < 0.001. Afro-Caribbean mentally ill (615/2575 24%)
compared w PD (33/511 6%) OR 4.55, 3.16-6.55 p < 0.001. Pts w
PD more likely to be UK-born than those w mental illness (488
95% vs 2137 83%) OR 4.34, 2.82-6.68 p < 0.001
With PD: White 470/511 (92%) Afro-
Caribbean 33/511 (6%)
Bender DS. Skodol AE. Dyck IR.
Markowitz JC. Shea MT. et al 2007
Baseline data: African American (OR 0.22, 0.07-0.7) & Hispanic (OR
0.47, 0.09-0.96) less likely to received psychosocial Rx of any type
in lifetime compared to white p = 0.0206, or received
psychotropic med (AA OR 0.35, 0.02-0.71. His OR 0.37, 0.16-0.83. p
< 0.01) & White pts w BPD more wks psychiatric hospitalisation p
= 0.01
With PD: White 396/548 (72.3%)
African American 78/548 (14.2%)
Hispanic 74/548 (13.5%)
Chavira DA. Grilo CM. Shea T. Yen S.
Gunderson JG. et al 2003
Hispanics had disproportionately more BPD than Caucasians (p <
0.001) and African Americans (p < 0.01). For STPD, African
Americans had disproportionately more diagnoses than
Caucasians (p < 0.05 and Hispanics (p < 0.05. No sig diff for AVPD
or OCPD
With PD: 433/554 White (78.2%) 65/
554 African American (11.7%) 56/554
Hispanic (10.1%)
Iwamasa GY. Larrabee AL. Merritt RD.
2000
Results suggest PD criteria were distributed systematically such
that PD diagnosis were applied to certain ethnic grps. African
American given Antisocial & paranoid PDs. Schizoid PD applied to
Asian Americans. Schizotypal PD applied to Native Americans. All
other PDs were applied to European Americans (BPD, Dependant,
Narcissistic, & Obsessive-Compulsive). All p < 0.001.
Not real pts - hypothetical examples
Huang B. Grant BF. Dawson DA.
Stinson FS. Chou SP. Et al 2006
Native Americans had the highest prevalence of PD, and Asians
the lowest (see prevalence). Association between PD and Alcohol
and Drug were positive & sig (except for Drugs & PD in Asians).
This is true of unadjusted and adjusted (for age, income marital
status, religion, sex, & urban city) ORs. Associations btwn alcohol
& PD (1.7-5.0) were generally lower than between drugs & PD (2.1-
6.3)
Prevalence captured in weighted %
White 14.6% Black 16.6% (significant
differences compared with White p <
0.05) Native American 24.1%
(significant differences when White &
black were compared, at p < 0.05).
Asian 10.1% (significantly different
from White, Black & N. Americans, at
p < 0.05). Hispanic 14% (significantly
different from other 4 ethnicities p <
0.05)
Compton WM. Cottler LB. Abdallah
AR. Phelps DL. Spitznagel EL. &
Horton JC. 2000
Antisocial PD present in 44% of respondents with drug
dependence: 49% African American males, 26% African American
females. 52% White males, 39% White females. The difference
between race and PD w drug dependence was not sig. (i.e. p >
0.05). However, White race was associated with higher rates of
generalised anxiety disorder than African Americans (p < 0.05) 6%
African American men vs 15% White men & 7% African American
women vs 16% White women
Antisocial PD within ethnic pop: 109/
258 African American (42%) 77/167
Caucasian (46%) Antisocial PD:
African American 109/186 (58.6%)
Caucasian 77/186 (41.4%) Total
sample: African American 109/425
(25.6%) Caucasian 77/425 (18.1%)
Table 2: Study results (Continued)
McGilloway et al. BMC Psychiatry 2010, 10:33
/>Page 8 of 14
tained data for Asian participants (n = 1412); in one study
[12], Asian referred to those of Indian, Bangladeshi and
Pakistani origin; the other study [9] did not define the
term. Three studies included data for Hispanic partici-
pants [9,10,13] (n = 8815). Three studies were in the UK
[11.12.14], and four were in the US [8-10,13]. One study
was based in the community [9], one in a prison [10], and
five in hospital settings [8,11-14]. The hospital settings
included medium security, high security and drug and
alcohol addiction units (additional file 1).
Meta-Analyses
The initial analyses compared Asians, Hispanic and black
groups to whites. There was no significant difference in
PD prevalence between Asians and whites (OR O.295 CIs
0.048 - 1.827), or Hispanics and whites (OR 1.155 CIs
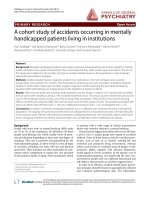
0.831 - 1.606). There was, as shown in Figure 2, a signifi-
cant difference between black and white populations (OR
0.476, CIs 0.248 - 0.915, p = 0.026).
There was also substantial heterogeneity (I
2
= 96.527).
Subsequent analyses of potential sources of heterogeneity
examined only black and white population data (see Table
4, Figures 3, 4, 5, 6, 7, 8, 9). The country setting, whether
conducted in the US or the UK, proved to be an impor-
tant source of heterogeneity (see Figure 3). There was no
significant difference in the prevalence of PD amongst
blacks compared to whites in the US (OR 0.872, CI 0.634-
1.199, I
2
= 74.925). In contrast, there was a significant
prevalence difference between black and white subjects
in the UK studies (OR 0.214, 95% CI 0.167 - 0.274). The
UK studies also showed true homogeneity (I
2
= 0) as
shown in Table 4. There were important differences
between the US and UK studies; firstly, two of the UK
studies were conducted on the same population in secure
settings [11,12] and the third UK study was conducted in
a similar secure hospital setting [14]. The UK studies also
used only case notes whilst the US studies used both
interview schedules and case notes (discussed below).
Figure 4 shows that, in a comparison of three service
settings (community, hospital and prison), black groups
compared to white groups were least likely to have a PD
in hospital settings (OR 0.357, CIs 0.188 - 0.677; 89.919)
and most likely in community setting (OR 1.164, CIs
1.087 - 1.245). Of the studies in hospital settings, black
patients were less likely to have PD in the secure com-
pared to non-secure settings (Figure 6); the three secure
setting studies were the three UK studies.
Further meta-regression analysis of the hospital sub-
group compared the use of an interview schedule and
case-notes diagnoses. Where only case notes were used,
the odds ratio was reduced from 0.357 to 0.281 (CI 0.169
- 0.467) (see Figure 5) and heterogeneity was reduced to
I
2
= 77.274.
Use of interview schedule
The use of an interview schedule was found to be a
source of heterogeneity (see Table 4). The pooled esti-
mate for studies using an interview schedule showed,
with a fixed effects model (as I
2
= 68.815), that the black
group was in fact more likely to have a PD than the white
group (OR 1.140, 95% CI 1.067 - 1.218; see Figure 7). In
contrast, studies not using an interview schedule found
the black group to be significantly less likely to have a PD
than the white group (OR 0.281, 95% CI 0.169 - 0.467 I
2
=
77.274; see Figure 5). The interview schedule subgroup
were all US studies, the non-interview subgroup included
one US study and three UK studies.
Diagnosis
Only borderline personality disorder showed a significant
prevalence difference between black and white groups
(OR 0.575, 95% CI 0.394 - 0.840; I
2
= 0). These two studies
[10,13] were also similar as both were undertaken in the
US and used interview schedules. There was also homo-
geneity (I
2
= 0) between the two antisocial PD studies but
no significant difference between black and white groups
in having this diagnosis; these studies were both in the US
but used different interview schedules [8,10]. See Figure
8.
Co-morbidity
Two of the studies refer to co-morbid drug misuse and
dependence but did not specify other diagnoses [12,14].
Compton included co-morbidity with illicit substance
misuse and dependence (alcohol and drugs). Trestman
Table 3: Scoring system for quality of included papers
Sample of patients Sample size Definition & diagnosis
of PD
Breakdown of
ethnicity
Data Collection Discussion &
analysis
Scoring
Not specified < 30 None 2 divisions only 2
nd
/3
rd
party
report collection
No attempt to
explain findings
0
Specific group e.g.
prisoners
≥ 30 Appropriate tool by
non-clinician
More than 2
divisions
First hand
collection
Explanation for
findings offered
1
General Population Considered e.g.
power calculation
Appropriate tool by
clinician
2
(QUALITY: 0-3; low, 4-6; moderate, 7-9; high)
McGilloway et al. BMC Psychiatry 2010, 10:33
/>Page 9 of 14
included co-morbidity with psychotic, affective, and anx-
iety disorders and PTSD with cluster A,B,C personality
disorders [10]. Coid listed many associations between dif-
ferent PD labels (ASPD + substance misuse, organic brain
syndromes; BPD + depression, mania, substance misuse;
paranoid PD + drug dependence and psychotic episodes)
[11]. In the presence of co-morbidity, black groups were
significantly less likely to have a PD diagnosis than white
groups (OR 0.381, 95% CI 0.190 - 0.764; I
2
= 92.288;. See
Figure 9). As reflected by the high level of heterogeneity,
the co-morbidity sub-group contained mixed studies in
terms of setting and use of interview schedule. Where
there was no co-morbidity, there was no significant dif-
ference between black and white groups (OR 0.789, 95%
CI 0.432 - 1.441; I
2
= 76.081).
Aetiology
The review found that the aetiology of PDs was the least
common subject of research. One study highlighted that
Hispanic populations have higher rates of intense anger
and affective instability compared to white populations,
but these may be manifestations of PD rather than aetio-
logical factors [17]. Several hypotheses about aetiology
were found in the publications. It was suggested that cer-
tain groups may possess characteristics of particular PDs,
Table 4: Results of analyses looking at sources of heterogeneity
Study characteristics No. of studies Odds Ratio of PD in black compared to white groups
(95% CI)
Heterogeneity (I2)
Geographical area: US 4
2378
0.872 (0.634 - 1.199) 74.925
Geographical area: UK 3
145
0.214 (0.167 - 0.274) 0.00
Clinical setting: health service 5
1-5
0.357 (0.188 - 0.677) 89.919
Clinical setting: secure inpatient 3
145
0.214 (0.167 - 0.274) 0.00
Clinical setting: non-secure health service 2
23
0.755 (0.551 - 1.035) 2.201
Clinical setting: prison 1
7
0.759 (0.510 - 1.131) 0.00
Clinical setting: community 1
8
1.164 (1.087 - 1.245) 0.00
Interview schedule 3
278
1.140 (1.067 - 1.218) fixed effects 68.815
No interview schedule 4
13-5
0.281 (0.169 - 0.467) random effects 77.274
Diagnosis: ASPD 2
27
0.948 (0.710 - 1.265) 0.00
Diagnosis: BPD 2
37
0.575 (0.394 - 0.840) 0.00
Diagnosis: ASPD and BPD 2
47
0.405 (0.119 - 1.381) 95.140
Co-morbidity 5
12457
0.381 (0.190 - 0.764) 92.288
No co-morbidity 3
378
0.789 (0.432 - 1.441) 76.81
Figure 2 All studies.
Study Name Statistics for each study
Events / Total Odds ratio and 95% CI
Odds Lower Upper
ratio limi
t
limi
t
Z-Value p-Value
Black White
Compton, 2000
2
0.855 0.578 1.265 -0.783 0.434
109 / 258 77 / 167
Castaneda, 1985
3
0.613 0.368 1.023 -1.874 0.061
25 / 558 41 / 577
Coid, 2000
4
0.217 0.151 0.313 -8.184 0.000
33 / 628 452 / 2224
Maden, 1999
6
0.221 0.088 0.558 -3.193 0.001
6 / 100 28 / 125
Trestman, 2007
7
0.759 0.510 1.131 -1.354 0.176
78 / 177 111 / 218
Huang, 2006
8
1.164 1.087 1.245 4.367 0.000
1368 / 8245 3578 / 24507
Coid, 1999
5
0.209 0.145 0.301 -8.409 0.000
33 / 648 470 / 2303
0.476 0.248 0.915 -2.227 0.026
0.01 0.1 1 10 100
McGilloway et al. BMC Psychiatry 2010, 10:33
/>Page 10 of 14
migrating ethnicities may find it difficult to adjust, and
that higher social classes have lower incidences of PD.
Treatment
Three of the five high quality scored studies considered
race/ethnicity with regards to the treatment of PD
[15,18,19]. They determined that more white patients
with PD received treatment than black patients. One of
these studies comprehensively evaluated types of treat-
ment utilisation by patients with PD and concluded that
black and Hispanic patients received a significantly nar-
rower range of psychiatric treatments in spite of having
higher rates of severe PD [19]. This was true for outpa-
tient and inpatient psychosocial treatments and psycho-
tropic medications (p < 0.0206 and p < 0.0001
respectively).
In the one RCT identified by the search strategy, which
compared community services and conventional hospi-
tal-based services for PD, the majority of patients were
white (63%)[16] This study determined that those with
PD showed greater improvement when treated in the
hospital-based setting [16].
Discussion
PD diagnosis and ethnicity
The meta-analysis of seven studies determined that over-
all there was a small but significantly lower prevalence of
PD amongst black as compared to white populations.
This finding concurred with that of two of the fifteen
studies which could not be included in the meta-analysis
due to lack of raw data [15,16]. There was no significant
difference in prevalence between Asian and white popu-
lations, however, only two studies contained this data and
it is unlikely that the term 'Asian' connoted comparable
populations. The meta-analysis of three studies of His-
panic and white populations showed that Hispanics were
more likely to be diagnosed with a PD, however this was
not statistically significant.
Where the type of personality disorder was specified,
the majority of studies investigated borderline or anti-
social personality disorders. Major sources of heteroge-
neity leading to lower prevalence estimates were the
country in which the study was undertaken (US or UK),
whether interview diagnoses were made rather than clini-
Figure 3 US and UK studies.
Subgroup within study Study name Events / Total
Odds ratio and 95% CI
Odds Lowe
r
Upper
ratio limi
t
limit
Black White
UK Coid, 1999
5
0.209 0.145 0.301
33 / 648 470 / 2303
UK Coid, 2000
4
0.217 0.151 0.313
33 / 628 452 / 2224
UK Maden, 1999
1
0.221 0.088 0.558
6 / 100 28 / 125
UK
0.214 0.167 0.274
US Castaneda, 1985
3
0.613 0.368 1.023
25 / 558 41 / 577
US Compton, 2000
2
0.855 0.578 1.265
109 /258
77 / 167
US Huang, 2006
8
1.164 1.087 1.245
1368 / 8245 3578 / 24507
US Trestman, 2007
7
0.759 0.510 1.131
78 / 177 111 / 218
US
0.872 0.634 1.199
0.01 0.1 1 10 100
Statistics for each study
Figure 4 Study setting.
Subgroup within study
Study name
Events / Total
Odds ratio and 95% CI
Odds Lower Upper
ratio limit limi
t
Blac
k
White
Communit
y
Huan
g
, 2006
8
1.164 1.087 1.245
1368 / 8245 3578 / 24507
Communit
y
1.164 1.087 1.245
Health services Compton, 2000
2
0.855 0.578 1.265
109 / 258
77 / 167
Health services Castaneda,1985
3
0.613 0.368 1.023
25 / 558 41 / 577
Health services Coid, 2000
4
0.217 0.151 0.313
33 / 628 452 / 2224
Health services Maden, 1999
1
0.221 0.088 0.558
6 / 100 28 / 125
Health services Coid, 1999
5
0.209 0.145 0.301
33 / 648 470 / 2303
Health services
0.357 0.188 0.677
Prison Trestman, 2007
7
0.759 0.510 1.131
78 / 177 111 / 218
Prison
0.759 0.510
1.131
0.01 0.1 1 10 100
Statistics for each study
McGilloway et al. BMC Psychiatry 2010, 10:33
/>Page 11 of 14
cal diagnoses, the specific diagnosis of borderline PD ver-
sus others, more secure settings and patients with co-
morbid disorders. These methodological differences may
account for the findings, however, if case note diagnoses
are associated with a lower prevalence, this means that
the routine care of black patients is likely to overlook PD
diagnoses, particularly if they have associated co-morbid-
ity. A recent study using interview diagnoses in the UK
investigating prevalence and correlates of PD in provides
support for there being no prevalence differences
between non-white and white populations [20].
The meta-regression suggests a lower prevalence of PD
or that PD is overlooked in more secure settings and in
inpatient settings, where acute care is required to manage
high risks. If a real difference between settings were to be
found using the same methods, then questions about
pathways into care and racial bias in diagnostic labelling
might be asked. Similarly, the finding of a lower risk of
borderline disorder is likely to reflect the differential
effects of clinical and case-note diagnoses rather than
interview schedules in these studies. However, these find-
ings need replication and the development of case regis-
ters from which sufficient numbers of subjects might be
gathered to test for these interactions in a more system-
atic and empirical manner.
Aetiology
Very little scientific knowledge on the aetiology of PD has
been collated [21]. One study highlighted that Hispanics
were found to be more intense and angry than whites
[17], and another determined that those from ethnic
minorities (mostly African Caribbean) and those in
higher social classes had a lower incidence of PD [16].
Although there are studies of higher and lower risk in
specific demographic and ethnic groups [16,17,21,22],
few studies investigate aetiological theories. For example,
Chavira et al. investigated whether some ethnic groups
had increased vulnerability [17]. Iwamasa et al. proposed
that specific ethnic groups were vulnerable to particular
PDs [22] rather than all PDs. Castaneda and Franco con-
tend that certain migrating groups may find it difficult to
adjust and this is a factor in the development of PD [13].
If prevalence differences are genuine, then identification
of different factors across ethnic groups may help in the
design of studies to better understand determinants of
PD.
Figure 5 Health services subgroup; use of interview schedule and no interview schedule.
Subgroup within study
Study name
Statistics for each study Events / Total Odds ratio and 95% CI
Odds Lower Uppe
r
ratio limi
t
limit
Black White
Interview Schedule Compton, 2000
2
0.855 0.578 1.265
109 / 258 77 / 167
Interview Schedule
0.855 0.578 1.265
No interview Castaneda, 1985
3
0.613 0.368 1.023
25 / 558 41 / 577
No intervie
w
Coid, 2000
4
0.217 0.151 0.313
33 / 628 452 / 2224
No intervie
w
Maden, 1999
1
0.221 0.088 0.558
6 / 100 28 / 125
No interview Coid, 1999
5
0.209 0.145 0.301
33 / 648 470 / 2303
No interview
0.281 0.169
0.467
0.01 0.1 1 10 100
Figure 6 Secure and non-secure health service study settings.
Subgroup within study Study name Statistics for each study
Events / Total Odds ratio and 95% CI
Odds Lowe
r
Uppe
r
ratio limit limi
t
Black White
Non-secure Compton, 2000
2
0.855 0.578 1.265
109 / 258 77 / 167
Non-secure Castaneda, 1985
3
0.613 0.368 1.023
25 / 558 41 / 577
Non-secure
0.755 0.551 1.035
Secure Coid, 2000
4
0.217 0.151 0.313
33 / 628 452 / 2224
Secure Maden, 1999
1
0.221 0.088 0.558
6 / 100 28 / 125
Secure Coid, 1999
5
0.209 0.145 0.301
33 / 648 470 / 2303
Secure
0.214 0.167 0.274
0.01 0.1 1 10 100
McGilloway et al. BMC Psychiatry 2010, 10:33
/>Page 12 of 14
Treatment
Difference in prevalence rates (inpatient and prisoner
samples) may be attributed to the differences in help-
seeking behaviour by ethnic group and differential effect
of 'gate keeping' processes [8,12,15,16,18,19]. Ethnic
minority populations may not receive specialist care for
PD, in contrast to schizophrenia where black people are
over-represented in specialist care, including forensic set-
tings. In the two studies with the highest quality scores,
more white than black patients were treated for PD, yet
the difference in prevalence did correspond to the lower
number of black people hospitalised [15,18], suggesting
again the operation of pathway filters that diminish entry
into specialist care for black people with PD. Further-
more, in the only study of treatment utilisation, PD and
ethnicity, black patients received a significantly narrower
range of treatments compared to white patients [19].
Alternatively, more access to treatment may not equate to
more effective treatment of PD. For example, variations
in compulsory admission to hospital may reflect treat-
ment needs or selection to treatments that appear likely
to benefit patients [12]. Bender et al. suggested that non-
white patients may have received a narrower range of
treatments due to differences in ethnic metabolisms, or
the prescribing habits of different mental health work-
ers[19] but few studies replicate these findings or propose
an overall theoretical framework within which research
studies can lead to improved clinical practice. However,
the one RCT concluded that regardless of ethnicity,
patients with PD showed greater improvement in social
functioning when treated in hospital as opposed to the
community; this is the only study comparing different
psychiatric venues for the treatments of PD [16].
Strengths and limitations
The main limitation is the small number of studies
included in the meta-analysis. There was also substantial
heterogeneity amongst these studies the main sources of
which appeared to be study methods, setting and design.
However, we stress the importance of this research as
innovative. To our knowledge, this is the only review that
considers existing research on PD prevalence, aetiology
and treatment in relation to race and ethnicity. This
research forms part of a larger project of continuing
research that will look at specific PDs in relation to race
and ethnicity as well as developing and reviewing PD pol-
Figure 7 All studies: interview and no interview use (fixed effects).
Subgroup within study Statistics for each study
Events / Total Odds ratio and 95% CI
Odds Lower Upper
ratio limi
t
limit
Black White
Interview Schedule Compton, 2000
2
0.855 0.578 1.265
109 / 258 77 / 167
Interview Schedule Trestman, 2007
7
0.759 0.510 1.131
78 / 177 111 / 218
Interview Schedule Huang, 2006
18
1.164 1.087 1.245
1368 / 8245 3578 / 24507
Interview Schedule
1.140 1.067 1.218
No interview Castaneda, 1985
3
0.613 0.368 1.023
25 / 558 41 / 577
No interview Coid, 2000
4
0.217 0.151 0.313
33 / 628 452 / 2224
No interview Maden, 1999
1
0.221 0.088 0.558
6 / 100 28 / 125
No interview Coid, 1999
5
0.209 0.145 0.301
33 / 648 470 / 2303
No interview
0.262 0.209 0.327
0.01 0.1 1 10 100
Study name
Figure 8 Diagnosis.
Subgroup within study Study name Statistics for each study
Events / Total Odds ratio and 95% CI
Odds Lower Upper
ratio limit limit
Black White
A
SPD Compton, 2000
2
0.855 0.578 1.265
109 / 258 77 / 167
A
SPD Trestman, 2007
7
1.071 0.699 1.640
57 / 177 67 / 218
A
SPD
0.948 0.710 1.265
BPD Castaneda, 1985
3
0.613 0.368 1.023
25 / 558 41 / 577
BPD Trestman, 2007
7
0.532 0.303 0.935
21 / 177 44 / 218
BPD
0.575 0.394 0.840
BPD + ASPD Coid, 2000
4
0.217 0.151 0.313
33 / 628 452 / 2224
BPD + ASPD Trestman, 2007
7
0.759 0.510 1.131
78 / 177 111 / 218
BPD + ASPD
0.405 0.119 1.381
0.01 0.1 1 10 100
McGilloway et al. BMC Psychiatry 2010, 10:33
/>Page 13 of 14
icy involving further research and a panel of experts in
the field. At present, we suggest that policy should high-
light the need for clinicians to be more culturally aware,
and that differences in race and ethnicity must be taken
into consideration when diagnosing PDs.
Conclusion
The existing data are sparse. There is a risk that PD is
overlooked and not treated in black people with PD.
More specific research in different service settings is nec-
essary to investigate pathways to care. There is almost no
aetiological and treatment research on more refined cul-
tural and ethnic categories, leaving unexplained the rea-
sons for differences across broad racial groups.
Additional material
Competing interests
The authors declare that they have no competing interests.
Authors' contributions
A.M and K.S.B designed the study. A.M undertook the initial literature search
and review. R.H performed the meta-analyses and meta-regression. K.S.B over-
saw and supervised the study. All authors contributed to the preparation of the
manuscript and read and approved the final version.
Acknowledgements
Nick Benefield and Joe Mairura at the Department of Health, the national PD
team, Care Services Improvement Partnership now transformed into the
National Mental Health Development Unit, the Careif steering group, volun-
teers and trustees .
Author Details
1
Barts and The London School of Medicine and Dentistry, Turner Street,
London E1 2AD, UK,
2
Centre for Psychiatry, Barts & The London School of
Medicine & Dentistry, Old Anatomy Building, Charterhouse Square, London,
EC1M 6BQ, UK,
3
The Centre for Applied Research and Evaluation International
Foundation (Careif ), Centre for Psychiatry, Barts & The London School of
Medicine & Dentistry, Old Anatomy Building, Charterhouse Square, London,
EC1M 6BQ, UK and
4
East London Foundation Trust, Trust headquarters,
Eastone, 22 Commercial Street, London, E1 6LP, UK
References
1. National Institute for Mental Health in England: Personality disorder: no
longer a diagnosis of exclusion - policy implementation guidance for the
development of services for people with personality disorder London:
Department of Health; 2003.
2. Tseng WS: Handbook of Cultural Psychiatry San Diego CA: Academic Press;
2001.
3. Sampson M, McCubbin R, Tyrer P: Personality Disorder and Community
Mental Health Teams: A Practitioner's Guide Chichester: John Wiley; 2006.
4. Bhugra D, Bhui K: Cross-Cultural Psychiatry: A practical guide London:
Arnold; 2001.
5. Loranger AW, Janca A, Sartorius N: Assessment and Diagnosis of Personality
Disorders: The ICD-10 International Personality Disorder Examination (IPDE)
Cambridge: Cambridge University Press; 1997.
6. Popay J, Roberts H, Sowden A, Petticrew M, Britten N, Arai L, Roen K,
Rodgers M: Developing guidance on the conduct of narrative synthesis
in systematic reviews. J Epidemiol Comm Health 2005, 59(Suppl 1):A7.
7. Huedo-Medina T, Sanchez-Meca J, Marin-Martinez F, Botella J: Assessing
heterogeneity in meta-analysis: Q statistic or I2 index? Psychological
Methods 2006, 11(2):193-206.
8. Compton WM, Cottler LB, Abdallah AB, Phelps Dl, Spitnagel EL, Horton JC:
Substance Dependence and other psychiatric disorders among drug
dependent subjects: race and gender correlates. The American Journal
on Addictions 2000, 9:113-125.
9. Huang B, Grant BF, Dawson DA, Stinson FS, Chou SP, Saha TD, Goldstein
RB, Smith SM, Ruan WJ, Pickering RP: Race-ethnicity and the prevalence
and co-occurrence of Diagnostic and Statistical Manual of Mental
Disorders, Fourth Edition, alcohol and drug use disorders and Axis I
and II disorders: United States, 2001 to 2002. Comprehensive psychiatry
2006, 47(4):252-257.
10. Trestman RL, Ford J, Zhang W, Wiesbrock V: Current and Lifetime
Psychiatric Illness Among Inmates Not Identified as Acutely Mentally Ill
at Intake in Connecticut's Jails. J Am Acad Psychiatry Law 2007,
35(4):490-500.
11. Coid J, Kahtan N, Gault S, Jarman B: Patients with personality disorder
admitted to secure forensic psychiatry services. The British Journal of
Psychiatry 1999, 175(6):528-536.
12. Coid J, Kahtan N, Gault S, Jarman B: Ethnic differences in admissions to
secure forensic psychiatry services. The British Journal of Psychiatry 2000,
177(3):241-247.
13. Castaneda R, Franco H: Sex and ethnic distribution of borderline
personality disorder in an inpatient sample. Am J Psychiatry 1985,
142(10):1202-1203.
14. Maden A, Friendship C, McClintock T, Rutter S: Outcome of admission to
a medium secure psychiatric unit 2. Role of ethnic origin. The British
Journal of Psychiatry 1999, 175:317-321.
Additional file 1 The meta-analysis studies. Details of the main features
of the studies used in the meta-analyses.
Received: 8 December 2009 Accepted: 11 May 2010
Published: 11 May 2010
This article is available from: 2010 McGilloway et al; licensee BioMed Central Ltd. This is an Open Access article distributed under the terms of the Creative Commons Attribution License ( which permits unrestricted use, distribution, and reproduction in any medium, provided the original work is properly cited.BMC Psychiatry 2010, 10:33
Figure 9 Co-morbidity and no co-morbidity.
Subgroup within study Study name Statistics for each study
Events / Total Odds ratio and 95% CI
Odds Lower Upper
ratio limi
t
limit
Black White
Co-morbidity Compton, 2000
2
0.855 0.578 1.265
109 / 258 77 / 167
Co-morbidit
y
Coid, 2000
4
0.217 0.151 0.313
33 / 628 452 / 2224
Co-morbidit
y
Maden, 1999
1
0.221 0.088 0.558
6 / 100 28 / 125
Co-morbidit
y
Trestman, 2007
7
0.836 0.561 1.247
75 / 177 102 / 218
Co-morbidit
y
Coid, 1999
5
0.209 0.145 0.301
33 / 648 470 / 2303
Co-morbidit
y
0.381 0.190 0.764
No co-morbidity Castaneda, 1985
3
0.613 0.368 1.023
25 / 558 41 / 577
No co-morbidity Trestman, 2007
7
0.400 0.107 1.502
3 / 177 9 / 218
No co-morbidity Huang, 2006
8
1.164 1.087 1.245
1368 / 8245 3578 / 24507
No co-morbidity
0.789 0.432 1.441
0.01 0.1 1 10 100
McGilloway et al. BMC Psychiatry 2010, 10:33
/>Page 14 of 14
15. Coid J, Petruckevitch A, Bebbington P, Brugha T, Bhugra D, Jenkins R:
Ethnic differences in prisoners. 1: criminality and psychiatric morbidity.
British Journal of Psychiatry 2002, 181:473-80.
16. Tyrer P, Merson S, Onyett S, Johnson T: The effect of personality disorder
on clinical outcome, social networks and adjustment: a controlled
clinical trial of psychiatric emergencies. Psychological Medicine 1994,
24(3):731-40.
17. Chavira DA, Grilo C, Shea M, Yen S, Gunderson J, Morey L: Ethnicity and
four personality disorders. Comprehensive psychiatry 2003, 44(6):483-91.
18. Coid J, Petruckevitch A, Bebbington P, Brugha T, Bhugra D, Jenkins R:
Ethnic differences in prisoners. 2: risk factors and psychiatric service
use. The British Journal of Psychiatry 2002, 181:481-487.
19. Bender D, Skodol A, IR D, Markowitz J, Shea M, Yen S: Ethnicity and
mental health utilization by patients with personality disorders.
Journal of consulting and clinical psychology 2007, 75(6):992-999.
20. Coid J, Yang M, Tyrer P, Roberts A, Ullrich S: Prevalence and correlates of
personality disorder in Great Britain. The British Journal of Psychiatry
2006, 188:423-431.
21. Gelder M, Editor: Psychiatry: An Oxford Core Text 3rd edition. Oxford: Oxford
University Press; 2005.
22. Iwamasa G, Merritt AL, Roberts A: Are personality disorder criteria
ethnically biased? A card sort analysis. Cultural Diversity and Ethnic
Minority Psychology 2000, 6(3):284-296.
Pre-publication history
The pre-publication history for this paper can be accessed here:
/>doi: 10.1186/1471-244X-10-33
Cite this article as: McGilloway et al., A systematic review of personality dis-
order, race and ethnicity: prevalence, aetiology and treatment BMC Psychiatry
2010, 10:33