Modern Physical Metallurgy and Materials Engineering Part 3 ppsx
Bạn đang xem bản rút gọn của tài liệu. Xem và tải ngay bản đầy đủ của tài liệu tại đây (467.21 KB, 30 trang )
Structural phases: their formation and transitions 51
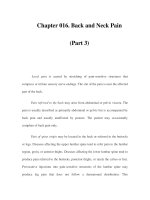
Figure 3.9 Free energy-temperature curves for ˛, ˇ and liquid phases.
a disordered solid solution from the pure components.
This arises because over and above the entropies of the
pure components A and B, the solution of B in A has
an extra entropy due to the numerous ways in which
the two kinds of atoms can be arranged amongst each
other. This entropy of disorder or mixing is of the form
shown in Figure 3.10a.
As a measure of the disorder of a given state we
can, purely from statistics, consider W the number of
distributions which belong to that state. Thus, if the
crystal contains N sites, n of which contain A-atoms
and N n contain B-atoms, it can be shown that
the total number of ways of distributing the A and B
Figure 3.10 Variation with composition of entropy (a) and
free energy (b) for an ideal solid solution, and for non-ideal
solid solutions (c) and (d).
atoms on the N sites is given by
W D
N!
n!N n!
This is a measure of the extra disorder of solution,
since W D 1 for the pure state of the crystal because
there is only one way of distributing N indistinguish-
able pure A or pure B atoms on the N sites. To ensure
that the thermodynamic and statistical definitions of
entropy are in agreement the quantity, W,whichisa
measure of the configurational probability of the sys-
tem, is not used directly, but in the form
S D k lnW
where k is Boltzmann’s constant. From this equation it
can be seen that entropy is a property which measures
the probability of a configuration, and that the greater
the probability, the greater is the entropy. Substituting
for W in the statistical equation of entropy and using
Stirling’s approximation
1
we obtain
S D k ln[N!/n!N n!]
D k[N lnN n lnn N n lnN n]
for the entropy of disorder, or mixing. The form of this
entropy is shown in Figure 3.10a, where c D n/N is
the atomic concentration of A in the solution. It is of
particular interest to note the sharp increase in entropy
for the addition of only a small amount of solute. This
fact accounts for the difficulty of producing really pure
metals, since the entropy factor, TdS, associated with
impurity addition, usually outweighs the energy term,
dH, so that the free energy of the material is almost
certainly lowered by contamination.
1
Stirling’s theorem states that if N is large
ln N! D N lnN N
52 Modern Physical Metallurgy and Materials Engineering
Figure 3.11 Free energy curves showing extent of phase
fields at a given temperature.
While Figure 3.10a shows the change in entropy
with composition the corresponding free energy
versus composition curve is of the form shown in
Figure 3.10b, c or d depending on whether the solid
solution is ideal or deviates from ideal behaviour.
The variation of enthalpy with composition, or heat
of mixing, is linear for an ideal solid solution, but
if A atoms prefer to be in the vicinity of B atoms
rather than A atoms, and B atoms behave similarly, the
enthalpy will be lowered by alloying (Figure 3.10c). A
positive deviation occurs when A and B atoms prefer
like atoms as neighbours and the free energy curve
takes the form shown in Figure 3.10d. In diagrams
3.10b and 3.10c the curvature dG
2
/dc
2
is everywhere
positive whereas in 3.10d there are two minima and
a region of negative curvature between points of
inflexion
1
given by dG
2
/dc
2
D 0. A free energy curve
for which d
2
G/dc
2
is positive, i.e. simple U-shaped,
gives rise to a homogeneous solution. When a region
of negative curvature exists, the stable state is a phase
mixture rather than a homogeneous solid solution,
as shown in Figure 3.11a. An alloy of composition
c has a lower free energy G
c
when it exists as a
mixture of A-rich phase ˛
1
of composition c
A
and B-
rich phase ˛
2
of composition c
B
in the proportions
given by the Lever Rule, i.e. ˛
1
/˛
2
D c
B
c/c
c
A
. Alloys with composition c<c
A
or c>c
B
exist
as homogeneous solid solutions and are denoted by
phases, ˛
1
and ˛
2
respectively. Partial miscibility in the
solid state can also occur when the crystal structures
of the component metals are different. The free energy
curve then takes the form shown in Figure 3.11b, the
phases being denoted by ˛ and ˇ.
3.2.4 Two-phase equilibria
3.2.4.1 Extended and limited solid solubility
Solid solubility is a feature of many metallic and
ceramic systems, being favoured when the components
have similarities in crystal structure and atomic (ionic)
diameter. Such solubility may be either extended (con-
tinuous) or limited. The former case is illustrated by
the binary phase diagram for the nickel–copper system
(Figure 3.12) in which the solid solution (˛) extends
1
The composition at which d
2
G/dc
2
D 0 varies with
temperature and the corresponding
temperature–composition curves are called spinodal lines.
Figure 3.12 Binary phase diagram for Ni–Cu system
showing extended solid solubility.
from component to component. In contrast to the
abrupt (congruent) melting points of the pure metals,
the intervening alloys freeze, or fuse, over a range of
temperatures which is associated with a univariant two-
phase ˛ C liquid field. This ‘pasty’ zone is located
between two lines known as the liquidus and solidus.
(The phase diagrams for Ni–Cu and MgO–FeO sys-
tems are similar in form.)
Let us consider the very slow (equilibrating) solidi-
fication of a 70Ni–30Cu alloy. A commercial version
of this alloy, Monel, also contains small amounts of
iron and manganese. It is strong, ductile and resists
corrosion by all forms of water, including sea-water
(e.g. chemical and food processing, water treatment).
An ordinate is erected from its average composition on
the base line. Freezing starts at a temperature T
1
.A
horizontal tie-line is drawn to show that the first crys-
tals of solid solution to form have a composition ˛
1
.
When the temperature reaches T
2
, crystals of compo-
sition ˛
2
are in equilibrium with liquid of composition
L
2
. Ultimately, at temperature T
3
, solidification is com-
pleted as the composition ˛
3
of the crystals coincides
with the average composition of the alloy. It will be
seen that the compositions of the ˛-phase and liquid
have moved down the solidus and liquidus, respec-
tively, during freezing.
Each tie-line joins two points which represent two
phase compositions. One might visualize that a two-
phase region in a binary diagram is made up of an infi-
nite number of horizontal (isothermal) tie-lines. Using
the average alloy composition as a fulcrum (x)and
applying the Lever Rule, it is quickly possible to derive
Structural phases: their formation and transitions 53
mass ratios and fractions. For instance, for equilibrium
at temperature T
2
in Figure 3.12, the mass ratio of
solid solution crystals to liquid is xL
2
/˛
2
x. Similarly,
the mass fraction of solid in the two-phase mixture at
this temperature is xL
2
/L
2
˛
2
. Clearly, the phase com-
positions are of greater structural significance than the
average composition of the alloy. If the volumetric
relations of two phases are required, these being what
we naturally assess in microscopy, then the above val-
ues must be corrected for phase density.
In most systems, solid solubility is far more
restricted and is often confined to the phase field
adjacent to the end-component. A portion of a binary
phase diagram for the copper–beryllium system, which
contains a primary, or terminal, solid solution, is
shown in Figure 3.13. Typically, the curving line
known as the solvus shows an increase in the
ability of the solvent copper to dissolve beryllium
solute as the temperature is raised. If a typical
‘beryllium–copper’ containing 2% beryllium is first
held at a temperature just below the solidus (solution-
treated), water-quenched to preserve the ˛-phase and
then aged at a temperature of 425
°
C, particles of
a second phase () will form within the ˛-phase
matrix because the alloy is equilibrating in the ˛ C
field of the diagram. This type of treatment, closely
controlled, is known as precipitation-hardening; the
mechanism of this important strengthening process
will be discussed in detail in Chapter 8. Precipitation-
hardening of a typical beryllium–copper, which also
contains up to 0.5% cobalt or nickel, can raise the
0.1% proof stress to 1200 MN m
2
and the tensile
strength to 1400 MN m
2
. Apart from being suitable
for non-sparking tools, it is a valuable spring material,
being principally used for electrically conductive brush
springs and contact fingers in electrical switches.
A curving solvus is an essential feature of phase
diagrams for precipitation-hardenable alloys (e.g.
aluminium–copper alloys (Duralumin)).
When solid-state precipitation takes place, say
of ˇ within a matrix of supersaturated ˛ grains,
this precipitation occurs in one or more of the
following preferred locations: (1) at grain boundaries,
(2) around dislocations and inclusions, and (3) on
specific crystallographic planes. The choice of site
for precipitation depends on several factors, of which
grain size and rate of nucleation are particularly
important. If the grain size is large, the amount of grain
boundary surface is relatively small, and deposition
of ˇ-phase within the grains is favoured. When this
precipitation occurs preferentially on certain sets of
crystallographic planes within the grains, the etched
structure has a mesh-like appearance which is known
as a Widmanst
¨
atten-type structure.
1
Widmanst
¨
atten
structures have been observed in many alloys (e.g.
overheated steels).
1
Named after Count Alois von Widmanst
¨
atten who
discovered this morphology within an iron–nickel meteorite
sample in 1808.
Figure 3.13 Cu-rich end of phase diagram for Cu–Be
system, showing field of primary solid solution (˛).
3.2.4.2 Coring
It is now possible to consider microsegregation, a phe-
nomenon introduced in Section 3.1.4, in more detail.
Referring again to the freezing process for a Ni–Cu
alloy (Figure 3.12), it is clear that the composition of
the ˛-phase becomes progressively richer in copper
and, consequently, if equilibrium is to be maintained
in the alloy, the two phases must continuously adjust
their compositions by atomic migration. In the liquid
phase such diffusion is relatively rapid. Under indus-
trial conditions, the cooling rate of the solid phase is
often too rapid to allow complete elimination of dif-
ferences in composition by diffusion. Each grain of
the ˛-phase will thus contain composition gradients
between the core, which will be unduly rich in the
metal of higher melting point, and the outer regions,
which will be unduly rich in the metal of lower melting
point. Such a non-uniform solid solution is said to be
cored: etching of a polished specimen can reveal a pat-
tern of dendritic segregation within each cored grain.
The faster the rate of cooling, the more pronounced
will be the degree of coring. Coring in chill-cast ingots
is, therefore, quite extensive.
The physical and chemical hetereogeneity produced
by non-equilibrium cooling rates impairs properties.
Cored structures can be homogenized by annealing.
For instance, an ingot may be heated to a temperature
just below the solidus temperature where diffusion
is rapid. The temperature must be selected with
54 Modern Physical Metallurgy and Materials Engineering
care because some regions might be rich enough in
low melting point metal to cause localized fusion.
However, when practicable, it is more effective
to cold-work a cored structure before annealing.
This treatment has three advantages. First, dendritic
structuresarebrokenupbydeformationsothat
regions of different composition are intermingled,
reducing the distances over which diffusion must
take place. Second, defects introduced by deformation
accelerate rates of diffusion during the subsequent
anneal. Third, deformation promotes recrystallization
during subsequent annealing, making it more likely
that the cast structure will be completely replaced by
a generation of new equiaxed grains. Hot-working is
also capable of eliminating coring.
3.2.4.3 Cellular microsegregation
In the case of a solid solution, we have seen that it
is possible for solvent atoms to tend to freeze before
solute atoms, causing gradual solute enrichment of
an alloy melt and, under non-equilibrium conditions,
dendritic coring (e.g. Ni–Cu). When a very dilute
alloy melt or impure metal freezes, it is possible for
each crystal to develop a regular cell structure on a
finer scale than coring. The thermal and compositional
condition responsible for this cellular microsegregation
is referred to as constitutional undercooling.
Suppose that a melt containing a small amount
of lower-m.p. solute is freezing. The liquid becomes
increasingly enriched in rejected solute atoms, partic-
ularly close to the moving solid/liquid interface. The
variation of liquid composition with distance from
Figure 3.14 Variation with distance from solid/liquid
interface of (a) melt composition and (b) actual temperature
T and freezing temperature T
L
.
the interface is shown in Figure 3.14a. There is a
corresponding variation with distance of the temper-
ature T
L
at which the liquid will freeze, since solute
atoms lower the freezing temperature. Consequently,
for the positive gradient of melt temperature T shown
in Figure 3.14b, there is a layer of liquid in which the
actual temperature T is below the freezing temperature
T
L
: this layer is constitutionally undercooled. Clearly,
the depth of the undercooled zone, as measured from
the point of intersection, will depend upon the slope
of the curve for actual temperature, i.e. G
L
D dT/dx.
As G
L
decreases, the degree of constitutional under-
cooling will increase.
Suppose that we visualize a tie-line through the two-
phase region of the phase diagram fairly close to the
component of higher m.p. Assuming equilibrium, a
partition or distribution coefficient k can be defined
as the ratio of solute concentration in the solid to that
in the liquid, i.e. c
S
/c
L
. For an alloy of average com-
position c
0
, the solute concentration in the first solid to
freeze is kc
0
,wherek<1, and the liquid adjacent to
the solid becomes richer in solute than c
0
. The next
solid to freeze will have a higher concentration of
solute. Eventually, for a constant rate of growth of
the solid/liquid interface, a steady state is reached for
which the solute concentration at the interface reaches
a limiting value of c
0
/k and decreases exponentially
within the liquid to the bulk composition. This con-
centration profile is shown in Figure 3.14a.
The following relation can be derived by applying
Fick’s second law of diffusion (Section 6.4.1):
c
L
D c
0
1 C
1 k
k
exp
Rx
D
(3.2)
where x is the distance into the liquid ahead of the
interface, c
L
is the solute concentration in the liquid
at point x, R is the rate of growth, and D is the
diffusion coefficient of the solute in the liquid. The
temperature distribution in the liquid can be calculated
if it is assumed that k is constant and that the liquidus
is a straight line of slope m. For the two curves of
Figure 3.14b:
T D T
0
mc
0
/k CG
L
x (3.3)
and
T
L
D T
0
mc
0
1 C
1 k
k
exp
Rx
D
(3.4)
where T
0
is the freezing temperature of pure solvent,
T
L
the liquidus temperature for the liquid of composi-
tion c
L
and T is the actual temperature at any point x.
The zone of constitutional undercooling may be
eliminated by increasing the temperature gradient G
L
,
such that:
G
L
> dT
L
/dx (3.5)
Substituting for T
L
and putting [1 Rx/D]forthe
exponential gives the critical condition:
G
L
R
>
mc
0
D
1 k
k
(3.6)
Structural phases: their formation and transitions 55
Solid Liquid Solid Liquid
(a)
(b)
(c)
Figure 3.15 The breakdown of a planar solid–liquid interface (a), (b) leading to the formation of a cellular structure of the
form shown in (c) for Sn/0.5 at.% Sb ð 140.
This equation summarizes the effect of growth condi-
tions upon the transition from planar to cellular growth
and identifies the factors that stabilize a planar inter-
face. Thus, a high G
L
,lowR and low c
0
will reduce
the tendency for cellular (and dendritic) structures to
form.
The presence of a zone of undercooled liquid
ahead of a macroscopically planar solid/liquid interface
(Section 3.1.2) makes it unstable and an interface with
cellular morphology develops. The interface grows
locally into the liquid from a regular array of points on
its surface, forming dome-shaped cells. Figures 3.15a
and 3.15b show the development of domes within a
metallic melt. As each cell grows by rapid freezing,
solute atoms are rejected into the liquid around its base
which thus remains unfrozen. This solute-rich liquid
between the cells eventually freezes at a much lower
temperature and a crystal with a periodic columnar
cell structure is produced. Solute or impurity atoms
are concentrated in the cell walls. Decantation of
a partly-solidified melt will reveal the characteristic
surface structure shown in Figure 3.15c. The cells
of metals are usually hexagonal in cross-section and
about 0.05–1 mm across: for each grain, their major
axes have the same crystallographic orientation to
within a few minutes of arc. It is often found that
a lineage or macromosaic structure (Section 3.1.1) is
superimposed on the cellular structure; this other form
of sub-structure is coarser in scale.
Different morphologies of a constitutionally-
cooled surface, other than cellular, are possible.
A typical overall sequence of observed growth
forms is planar/cellular/cellular dendritic/dendritic.
Substructures produced by constitutional undercooling
have been observed in ‘doped’ single crystals and
in ferrous and non-ferrous castings/weldments.
1
When
1
The geological equivalent, formed by very slowly cooling
magma, is the hexagonal-columnar structure of the Giant’s
Causeway, Northern Ireland.
the extent of undercooling into the liquid is increased
as, for example, by reducing the temperature gradient
G
L
, the cellular structure becomes unstable and a few
cells grow rapidly as cellular dendrites. The branches
of the dendrites are interconnected and are an extreme
development of the dome-shaped bulges of the cell
structure in directions of rapid growth. The growth of
dendrites in a very dilute, constitutionally-undercooled
alloy is slower than in a pure metal because solute
atoms must diffuse away from dendrite/liquid surfaces
and also because their growth is limited to the
undercooled zone. Cellular impurity-generated sub-
structures have also been observed in ‘non-metals’ as a
result of constitutional undercooling. Unlike the dome-
shaped cells produced with metals, non-metals produce
faceted projections which relate to crystallographic
planes. For instance, cells produced in a germanium
crystal containing gallium have been reported in which
cell cross-sections are square and the projection tips
are pyramid-shaped, comprising four octahedral f111g
planes.
3.2.4.4 Zone-refining
Extreme purification of a metal can radically improve
properties such as ductility, strength and corrosion-
resistance. Zone-refining was devised by W. G. Pfann,
its development being ‘driven’ by the demands of the
newly invented transistor for homogeneous and ultra-
pure metals (e.g. Si, Ge). The method takes advantage
of non-equilibrium effects associated with the ‘pasty’
zone separating the liquidus and solidus of impure
metal. Considering the portion of Figure 3.12 where
addition of solute lowers the liquidus temperature,
the concentration of solute in the liquid, c
L
, will
always be greater than its concentration c
s
in the
solid phase; that is, the distribution coefficient k D
c
s
/c
L
is less than unity. If a bar of impure metal
is threaded through a heating coil and the coil is
slowly moved, a narrow zone of melt can be made
to progress along the bar. The first solid to freeze is
56 Modern Physical Metallurgy and Materials Engineering
purer than the average composition by a factor of k,
while that which freezes last, at the trailing interface,
is correspondingly enriched in solute. A net movement
of impurity atoms to one end of the bar takes place.
Repeated traversing of the bar with a set of coils
can reduce the impurity content well below the limit
of detection (e.g. <1partin10
10
for germanium).
Crystal defects are also eliminated: Pfann reduced
the dislocation density in metallic and semi-metallic
crystals from about 3.5 ð 10
6
cm
2
to almost zero.
Zone-refining has been used to optimize the ductility of
copper, making it possible to cold-draw the fine-gauge
threads needed for interconnects in very large-scale
integrated circuits.
3.2.5 Three-phase equilibria and reactions
3.2.5.1 The eutectic reaction
In many metallic and ceramic binary systems it is
possible for two crystalline phases and a liquid to co-
exist. The modified Phase Rule reveals that this unique
condition is invariant; that is, the temperature and
all phase compositions have fixed values. Figure 3.16
shows the phase diagram for the lead–tin system.
It will be seen that solid solubility is limited for
each of the two component metals, with ˛ and ˇ
representing primary solid solutions of different crystal
structure. A straight line, the eutectic horizontal, passes
through three phase compositions (˛
e
, L
e
and ˇ
e
)atthe
temperature T
e
. As will become clear when ternary
systems are discussed (Section 3.2.9), this line is a
collapsed three-phase triangle: at any point on this
line, three phases are in equilibrium. During slow
cooling or heating, when the average composition of
an alloy lies between its limits, ˛
e
and ˇ
e
, a eutectic
reaction takes place in accordance with the equation
L
e
˛
e
C ˇ
e
. The sharply-defined minimum in the
liquidus, the eutectic (easy-melting) point, is a typical
feature of the reaction.
Consider the freezing of a melt, average composition
37Pb–63Sn. At the temperature T
e
of approximately
180
°
C, it freezes abruptly to form a mechanical mix-
ture of two solid phases, i.e. Liquid L
e
! ˛
e
C ˇ
e
.
From the Lever Rule, the ˛/ˇ mass ratio is approx-
imately 9:11. As the temperature falls further, slow
cooling will allow the compositions of the two phases
to follow their respective solvus lines. Tie-lines across
this ˛ C ˇ field will provide the mass ratio for any
temperature. In contrast, a hypoeutectic alloy melt, say
of composition 70Pb–30Sn, will form primary crystals
of ˛ over a range of temperature until T
e
is reached.
Successive tie-lines across the ˛ CLiquid field show
that the crystals and the liquid become enriched in tin
as the temperature falls. When the liquid composition
reaches the eutectic value L
e
, all of the remaining liq-
uid transforms into a two-phase mixture, as before.
However, for this alloy, the final structure will com-
prise primary grains of ˛ in a eutectic matrix of ˛ and
ˇ. Similarly, one may deduce that the structure of a
solidified hyper-eutectic alloy containing 30Pb–70Sn
will consist of a few primary ˇ grains in a eutectic
matrix of ˛ and ˇ.
Low-lead or low-tin alloys, with average composi-
tions beyond the two ends of the eutectic horizontal,
1
freeze by transforming completely over a small range
of temperature into a primary phase. (Changes in com-
position are similar in character to those described
for Figure 3.12) When the temperature ‘crosses’ the
relevant solvus, this primary phase becomes unsta-
ble and a small amount of second phase precipitates.
Final proportions of the two phases can be obtained
by superimposing a tie-line on the central two-phase
field: there will be no signs of a eutectic mixture in
the microstructure.
The eutectic (37Pb–63Sn) and hypo-eutectic
(70Pb–30Sn) alloys chosen for the description of
freezing represent two of the numerous types of solder
2
used for joining metals. Eutectic solders containing
60–65% tin are widely used in the electronics industry
for making precise, high-integrity joints on a mass-
production scale without the risk of damaging heat-
sensitive components. These solders have excellent
‘wetting’ properties (contact angle <10
°
), a low
liquidus and a negligible freezing range. The long
freezing range of the 70Pb–30Sn alloy (plumbers’
solder) enables the solder at a joint to be ‘wiped’ while
‘pasty’.
The shear strength of the most widely-used solders is
relatively low, say 25–55 MN m
2
, and mechanically-
interlocking joints are often used. Fluxes (corrosive
zinc chloride, non-corrosive organic resins) facilitate
essential ‘wetting’ of the metal to be joined by dis-
solving thin oxide films and preventing re-oxidation.
In electronic applications, minute solder preforms have
been used to solve the problems of excess solder and
flux.
Figure 3.16 shows the sequence of structures
obtained across the breadth of the Pb–Sn system.
Cooling curves for typical hypo-eutectic and eutectic
alloys are shown schematically in Figure 3.17a.
Separation of primary crystals produces a change in
slope while heat is being evolved. Much more heat
is evolved when the eutectic reaction takes place.
The lengths (duration) of the plateaux are proportional
to the amounts of eutectic structure formed, as
summarized in Figure 3.17b. Although it follows that
cooling curves can be used to determine the form of
such a simple system, it is usual to confirm details by
means of microscopical examination (optical, scanning
electron) and X-ray diffraction analysis.
1
Theoretically, the eutectic horizontal cannot cut the vertical
line representing a pure component: some degree of solid
solubility, however small, always occurs.
2
Soft solders for engineering purposes range in composition
from 20% to 65% tin; the first standard specifications for
solders were produced in 1918 by the ASTM. The USA is
currently contemplating the banning of lead-bearing
products; lead-free solders are being sought.
Structural phases: their formation and transitions 57
Figure 3.16 Phase diagram for Pb–Sn system. Alloy 1: 63Sn–37Pb, Alloy 2: 70Pb–30Sn, Alloy 3: 70Sn–30Pb.
Figure 3.17 (a) Typical cooling curves for hypo-eutectic alloy 2 and eutectic alloy 1 in Figure 3.16 and (b) dependence of
duration of cooling arrest at eutectic temperature T
E
on composition.
3.2.5.2 The peritectic reaction
Whereas eutectic systems often occur when the melt-
ing points of the two components are fairly similar, the
second important type of invariant three-phase condi-
tion, the peritectic reaction, is often found when the
components have a large difference in melting points.
Usually they occur in the more complicated systems;
for instance, there is a cascade of five peritectic reac-
tions in the Cu–Zn system (Figure 3.20).
A simple form of peritectic system is shown in,
Figure 3.18a; although relatively rare in practice (e.g.
Ag–Pt), it can serve to illustrate the basic principles.
58 Modern Physical Metallurgy and Materials Engineering
Figure 3.18 (a) Simple peritectic system; (b) development of a peritectic ‘wall’.
A horizontal line, the key to the reaction, links
three critical phase compositions; that is, ˛
p
, ˇ
p
and
liquid L
p
. A peritectic reaction occurs if the average
composition of the alloy crosses this line during either
slow heating or cooling. It can be represented by the
equation ˛
p
C L
p
ˇ
p
. Binary alloys containing less
of component B than the point ˛
p
will behave in the
manner previously described for solid solutions. A
melt of alloy 1, which is of peritectic composition, will
freeze over a range of temperature, depositing crystals
of primary ˛-phase. The melt composition will move
down the liquidus, becoming richer in component B.
At the peritectic temperature T
p
, liquid of composition
L
p
will react with these primary crystals, transforming
them completely into a new phase, ˇ, of different
crystal structure in accordance with the equation ˛
p
C
L
p
! ˇ
p
. In the system shown, ˇ remains stable during
further cooling. Alloy 2 will aso deposit primary ˛,
but the reaction at temperature T
p
will not consume
all these crystals and the final solid will consist of ˇ
formed by peritectic reaction and residual ˛. Initially,
the ˛/ˇ mass ratio will be approximately 2.5 to 1
but both phases will adjust their compositions during
subsequent cooling. In the case of alloy 3, fewer
primary crystals of ˛ form: later, they are completely
destroyed by the peritectic reaction. The amount of ˇ
in the resultant mixture of ˇ and liquid increases until
the liquid disappears and an entire structure of ˇ is
produced.
The above descriptions assume that equilibrium is
attained at each stage of cooling. Although very slow
cooling is unlikely in practice, the nature of the peri-
tectic reaction introduces a further complication. The
reaction product ˇ tends to form a shell around the
particles of primary ˛: its presence obviously inhibits
the exchange of atoms by diffusion which equilibrium
demands (Figure 3.18b).
3.2.5.3 Classification of three-phase equilibria
The principal invariant equilibria involving three con-
densed (solid, liquid) phases can be conveniently
divided into eutectic- and peritectic-types and classi-
fied in the manner shown in Table 3.1. Interpretation of
these reactions follows the methodology already set out
for the more common eutectic and peritectic reactions.
The inverse relation between eutectic- and peritectic-
type reactions is apparent from the line diagrams.
Eutectoid and peritectoid reactions occur wholly in the
solid state. (The eutectoid reaction
˛ CFe
3
Cis
the basis of the heat-treatment of steels.) In all the
systems so far described, the components have been
completely miscible in the liquid state. In monotectic
and syntectic systems, the liquid phase field contains
a region in which two different liquids (L
1
and L
2
)are
immiscible.
3.2.6 Intermediate phases
An intermediate phase differs in crystal structure from
the primary phases and lies between them in a phase
diagram. In Figure 3.19, which shows the diagram
for the Mg–Si system, Mg
2
Si is the intermediate
phase. Sometimes intermediate phases have definite
stoichiometric ratios of constituent atoms and appear
as a single vertical line in the diagram. However,
they frequently exist over a range of composition and
it is therefore generally advisable to avoid the term
‘compound’.
In some diagrams, such as Figure 3.19, they extend
from room temperature to the liquidus and melt or
freeze without any change in composition. Such a
melting point is said to be congruent: the melting
point of a eutectic alloy is incongruent. A congruently
melting phase provides a convenient means to divide
a complex phase diagram (binary or ternary) into
more readily understandable parts. For instance, an
Structural phases: their formation and transitions 59
Table 3.1 Classification of three-phase equilibria
Eutectic-type Eutectic Liq
˛ C ˇ
Liq
ba
Al–Si, Pb–Sn, Cu–Ag
reactions Al
2
O
3
–SiO
2
,Al
2
O
3
–ZrO
2
Eutectoid
˛ C ˇ
g
ba
Fe–C, Cu–Zn
Monotectic Liq
1
˛ C Liq
2
Liq
1
Liq
2
a
Cu–Pb, Ag–Ni
SiO
2
–CaO
Peritectic-type Peritectic ˛ C Liq
ˇ
Liq
b
a
Cu–Zn, Ag–Pt
reactions
Peritectoid ˛ C ˇ
b
g
a
Ag–Al
Syntectic Liq
1
C Liq
2
˛
Liq
2
a
Liq
1
Na–Zn
Figure 3.19 Phase diagram for Mg–Si system showing intermediate phase Mg
2
Si (after Brandes and Brook, 1992).
ordinate through the vertex of the intermediate phase in
Figure 3.19 produces two simple eutectic sub-systems.
Similarly, an ordinate can be erected to pass through
the minimum (or maximum) of the liquidus of a solid
solution (Figure 3.38b).
In general, intermediate phases are hard and brittle,
having a complex crystal structure (e.g. Fe
3
C, CuAl
2
(Â)). For instance, it is advisable to restrict time and
temperature when soldering copper alloys, otherwise it
is possible for undesirable brittle layers of Cu
3
Sn and
Cu
6
Sn
5
to form at the interface.
3.2.7 Limitations of phase diagrams
Phase diagrams are extremely useful in the interpre-
tation of metallic and ceramic structures but they are
60 Modern Physical Metallurgy and Materials Engineering
subject to several restriction. Primarily, they identify
which phases are likely to be present and provide com-
positional data. The most serious limitation is that they
give no information on the structural form and distribu-
tion of phases (e.g. lamellae, spheroids, intergranular
films, etc.). This is unfortunate, since these two fea-
tures, which depend upon the surface energy effects
between different phases and strain energy effects due
to volume and shape changes during transformations,
play an important role in the mechanical behaviour
of materials. This is understood if we consider a two-
phase ˛ C ˇ material containing only a small amount
of ˇ-phase. The ˇ-phase may be dispersed evenly as
particles throughout the ˛-grains, in which case the
mechanical properties of the material would be largely
governed by those of the ˛-phase. However, if the ˇ-
phase is concentrated at grain boundary surfaces of the
˛-phase, then the mechanical behaviour of the mate-
rial will be largely dictated by the properties of the
ˇ-phase. For instance, small amounts of sulphide par-
ticles, such as grey manganese sulphide (MnS), are
usually tolerable in steels but sulphide films at the
grain boundaries cause unacceptable embrittlement.
A second limitation is that phase diagrams por-
tray only equilibrium states. As indicated in previous
sections, alloys are rarely cooled or heated at very
slow rates. For instance, quenching, as practised in the
heat-treatment of steels, can produce metastable phases
known as martensite and bainite that will then remain
unchanged at room temperature. Neither appears in
phase diagrams. In such cases it is necessary to devise
methods for expressing the rate at which equilibrium
is approached and its temperature-dependency.
3.2.8 Some key phase diagrams
3.2.8.1 Copper–zinc system
Phase diagrams for most systems, metallic and
ceramic, are usually more complex than the examples
discussed so far. Figure 3.20 for the Cu–Zn system
illustrates this point. The structural characteristics and
mechanical behaviour of the industrial alloys known
as brasses can be understood in terms of the copper-
rich end of this diagram. Copper can dissolve up to
40% w/w of zinc and cooling of any alloy in this range
will produce an extensive primary solid solution (fcc-
˛). By contrast, the other primary solid solution (Á)is
extremely limited. A special feature of the diagram is
the presence of four intermediate phases (ˇ, , υ, ε).
Each is formed during freezing by peritectic reaction
and each exists over a range of composition. Another
notable feature is the order–disorder transformation
which occurs in alloys containing about 50% zinc
over the temperature range 450–470
°
C. Above this
temperature range, bcc ˇ-phase exists as a disordered
solid solution. At lower temperatures, the zinc atoms
are distributed regularly on the bcc lattice: this ordered
phase is denoted by ˇ
0
.
Suppose that two thin plates of copper and zinc are
held in very close contact and heated at a temperature
Figure 3.20 Phase diagram for copper–zinc (from Raynor;
courtesy of the Institute of Metals).
of 400
°
C for several days. Transverse sectioning of the
diffusion couple will reveal five phases in the sequence
˛/ˇ//ε/Á, separated from each other by a planar inter-
face. The υ-phase will be absent because it is unstable
at temperatures below its eutectoid horizontal 560
°
C.
Continuation of diffusion will eventually produce one
or two phases, depending on the original proportions
of copper and zinc.
3.2.8.2 Iron–carbon system
The diagram for the part of the Fe–C system shown
in Figure 3.21 is the basis for understanding the
microstructures of the ferrous alloys known as steels
and cast irons. Dissolved carbon clearly has a pro-
nounced effect upon the liquidus, explaining why the
difficulty of achieving furnace temperatures of 1600
°
C
caused large-scale production of cast irons to predate
that of steel. The three allotropes of pure iron are ˛-Fe
(bcc), -Fe (fcc) and υ-Fe (bcc).
1
Small atoms of car-
bon dissolve interstitially in these allotropes to form
three primary solid solutions: respectively, they are ˛-
phase (ferrite), -phase (austenite) and υ-phase. At the
other end of the diagram is the orthorhombic interme-
diate phase Fe
3
C, which is known as cementite.
The large difference in solid solubility of carbon
in austenite and ferrite, together with the existence of
a eutectoid reaction, are responsible for the versatile
behaviour of steels during heat-treatment. Ae
1
,Ae
2
,
Ae
3
and A
cm
indicate the temperatures at which phase
changes occur: they are arrest points for equilibria
detected during thermal analysis. For instance, slow
cooling enables austenite (0.8% C) to decompose
eutectoidally at the temperature Ae
1
and form the
microconstituent pearlite, a lamellar composite of soft,
1
The sequence omits ˇ-Fe, a term once used to denote a
non-magnetic form of ˛-Fe which exists above the Curie
point.
Structural phases: their formation and transitions 61
Figure 3.21 Phase diagram for Fe–C system (dotted lines represent iron-graphite equilibrium).
ductile ferrite (initially 0.025% C) and hard, brittle
cementite (6.67% C). Quenching of austenite from a
temperature above Ae
3
forms a hard metastable phase
known as martensite. From the diagram one can see
why a medium-carbon (0.4%) steel must be quenched
from a higher Ae
3
temperature than a high-carbon
(0.8%) steel. Temperature and composition ‘windows’
for some important heat-treatment operations have
been superimposed upon the phase diagram.
3.2.8.3 Copper–lead system
The phase diagram for the Cu–Pb system (Figure 3.22)
provides an interesting example of extremely limited
solubility in the solid state and partial immiscibility
in the liquid state. The two components differ greatly
in density and melting point. Solid solutions, ˛ and
ˇ, exist at the ends of the diagram. The ‘miscibility
gap’ in the liquid phase takes the form of a dome-
shaped two-phase L
1
C L
2
field. At temperatures
above the top of the dome, the critical point,
liquid miscibility is complete. The upper isothermal
represents a monotectic reaction, i.e. L
1
˛ CL
2
.
On cooling, a hyper-monotectic 50Cu–50Pb melt
will separate into two liquids of different composition.
The degree of separation depends on cooling condi-
tions. Like oil and water, the two liquids may form an
emulsion of droplets or separate into layers according
to density. At a temperature of 954
°
C, the copper-rich
liquid L
1
disappears, forming ˛ crystals and more of
the lead-rich liquid L
2
. This liquid phase gets richer
in lead and eventually decomposes by eutectic reac-
tion, i.e. L
2
˛ Cˇ. (Tie-lines can be used for all
two-phase fields, of course; however, because of den-
sity differences, mass ratios may differ greatly from
observed volume ratios.)
The hypo-monotectic 70Cu–30Pb alloy, rapidly
cast, has been used for steel-backed bearings: dispersed
friction-reducing particles of lead-rich ˇ are supported
in a supporting matrix of copper-rich ˛.Binary
combinations of conductive metal (Cu, Ag) and
62 Modern Physical Metallurgy and Materials Engineering
Figure 3.22 Phase diagram for Cu–Pb system (by permission of the Copper Development Association, 1993).
refractory arc-resistant metal (W, Mo, Ni) have
been used for electrical contacts (e.g. 60Ag–40Ni).
These particular monotectic systems, with their liquid
immiscibility, are difficult to cast and are therefore
made by powder metallurgy techniques.
3.2.8.4 Alumina–silica system
The binary phase diagram for alumina–silica
(Figure 3.23) is of special relevance to the refractories
industry, an industry which produces the bricks,
slabs, shapes, etc. for the high-temperature plant that
make steel-making, glass-making, heat-treatment, etc.
possible. The profile of its liquidus shows a minimum
and thus mirrors the refractoriness of aluminosilicate
refractories (Figure 3.24). Refractoriness, the prime
requirement of a refractory, is commonly determined
by an empirical laboratory test. A sample cone of a
given refractory is placed on a plaque and located at
the centre of a ring of standard cones, each of which
has a different softening or slumping temperature and
is identified by a Pyrometric Cone Equivalent (PCE)
number. All cones are then slowly heated until the
Structural phases: their formation and transitions 63
Figure 3.23 Phase diagram for SiO
2
–Al
2
O
3
system.
Figure 3.24 Refractoriness of aluminosilicate ceramics.
sample cone bends or slumps under gravity: the PCE
of a standard cone that has behaved similarly is noted
and taken to represent the refractoriness of the sample.
It will be realized that the end-point of the PCE test
is rather arbitrary, being a rising-temperature value.
(Other requirements may include refractoriness-under-
load, resistance to thermal shock, resistance to attack
by molten slag, low thermal conductivity, etc.)
The steeply-descending liquidus shows the adverse
effect of a few per cent of alumina on the refractori-
ness of silica bricks. (Sodium oxide, Na
2
O, has an
even more pronounced eutectic-forming effect and is
commonly used to flux sand particles during glass-
melting.) The discovery of this eutectic point led to
immediate efforts to keep the alumina content as far
below 5% as possible. Silica refractories are made by
firing size-graded quartzite grains and a small amount
of lime (CaO) flux at a temperature of 1450
°
C: the
final structure consists of tridymite, cristobalite and a
minimal amount of unconverted quartz. Tridymite is
preferred to cristobalite because of the large volume
change (¾1%) associated with the ˛/ˇ cristobalite
inversion. The lime forms an intergranular bond of
SiO
2
–CaO glass. Chequerwork assemblies of silica
bricks are used in hot-blast stoves that regeneratively
preheat combustion air for iron-making blast furnaces
to temperatures of 1200–1300
°
C. Silica bricks have
a surprisingly good refractoriness-under-load at tem-
peratures only 50
°
C or so below the melting point
of pure silica 1723
°
C. Apparently, the fired grains
of tridymite and cristobalite interlock, being able to
withstand a compressive stress of, say, 0.35 MN m
2
at these high temperature levels.
Firebricks made from carefully-selected low-iron
clays are traditionally used for furnace-building. These
clays consist essentially of minute platey crystals
of kaolinite, Al
2
Si
2
O
5
OH
4
: the (OH) groups are
expelled during firing. The alumina content (46%)
of fired kaolinite sets the upper limit of the normal
composition range for firebricks. Refractoriness rises
steeply with alumina content and aluminous fireclays
containing 40% or more of alumina are therefore par-
ticularly valued. A fireclay suitable for refractories
should have a PCE of at least 30 (equivalent to
1670
°
C): with aluminous clays the PCE can rise
to 35 1770
°
C. Firing the clay at temperatures of
1200–1400
°
C forms a glassy bond and an interlock-
ing mass of very small lath-like crystals of mullite;
this is the intermediate phase with a narrow range of
composition which marks the edge of the important
mullite Ccorundum plateau. High-alumina bricks,
with their better refractoriness, have tended to replace
firebricks. An appropriate raw material is obtained
by taking clay and adding alumina (bauxite, artifi-
cial corundum) or a ‘sillimanite-type’ mineral, Al
2
SiO
5
(andalusite, sillimanite, kyanite).
Phase transformations in ceramic systems are
generally more sluggish than in metallic systems and
steep concentration gradients can be present on a
micro-scale. Thus tie-lines across the silica–mullite
field usually only give approximate proportions of
these two phases. The presence of traces of catalysing
mineralizers, such as lime, can make application of the
diagram nominal rather than rigorous. For instance,
although silica bricks are fired at a temperature of
1450
°
C, which is within the stability range of tridymite
870–1470
°
C, cristobalite is able to form in quantity.
However, during service, true stability is approached
and a silica brick operating in a temperature gradient
will develop clearly-defined and separate zones of
tridymite and cristobalite.
By tradition, refractories are often said to be acid
or basic, indicating their suitability for operation in
contact with acid (SiO
2
-rich) or basic (CaO- or FeO-
rich) slags. For instance, suppose that conditions are
reducing and the lower oxide of iron, FeO, forms
in a basic steel-making slag 1600
°
C. ‘Acid’ silica
64 Modern Physical Metallurgy and Materials Engineering
refractory will be rapidly destroyed because this fer-
rous oxide reacts with silica to form fayalite, Fe
2
SiO
4
,
which has a melting point of 1180
°
C. (The SiO
2
–FeO
phase diagram shows a sudden fall in the liquidus.)
However, in certain cases, this approach is scientifi-
cally inadequate. For instance, ‘acid’ silica also has a
surprising tolerance for basic CaO-rich slags. Refer-
ence to the SiO
2
–CaO diagram reveals that there is a
monotectic plateau at its silica-rich end, a feature that
is preferable to a steeply descending liquidus. Its exis-
tence accounts for the slower rate of attack by molten
basic slag and also, incidentally, for the feasibility of
using lime as a bonding agent for silica grains during
firing.
3.2.8.5 Nickel–sulphur–oxygen and
chromium–sulphur–oxygen systems
The hot corrosion of superalloys based upon nickel,
iron or cobalt by flue or exhaust gases from the
combustion of sulphur-containing fuels is a problem
common to a number of industries (e.g. power
generation). These gases contain nitrogen, oxygen
(excess to stoichiometric combustion requirements),
carbon dioxide, water vapour, sulphur dioxide, sulphur
trioxide, etc. In the case of a nickel-based alloy, the
principal corrosive agents are sulphur and oxygen.
They form nickel oxide and/or sulphide phases at the
flue gas/alloy interface: their presence represents metal
wastage. A phase diagram for the Ni–S–O system,
which makes due allowance for the pressure variables,
provides a valuable insight into the thermochemistry of
attack of a Ni-based superalloy. Although disregarding
kinetic factors, such as diffusion, a stability diagram
of this type greatly helps understanding of underlying
mechanisms. Primarily, it indicates which phases are
likely to form. Application of these diagrams to hot
corrosion phenomena is discussed in Chapter 12.
Under equilibrium conditions, the variables gov-
erning chemical reaction at a nickel/gas interface are
temperature and the partial pressures p
o
2
and p
s
2
for
the gas phase. For isothermal conditions, the gen-
eral disposition of phases will be as shown schemat-
ically in Figure 3.25a. An isothermal section (900 K)
is depicted in Figure 3.25b. A comprehensive three-
dimensional representation, based upon standard free
energy data for the various competing reactions,
is given in Figure 3.26. Section AA is isothermal
(1200 K): the full diagram may be regarded as a par-
allel stacking of an infinite number of such vertical
sections. From the Phase Rule, P CF D C C 2, it fol-
lows that F D 5 P. Hence, for equilibrium between
gas and one condensed phase, there are three degrees
of freedom and equilibrium is represented by a vol-
ume. Similarly, equilibrium between gas and three
condensed phases is represented by a line. The bivari-
ant and univariant equilibrium equations which form
the basis of the three-dimensional stability diagram are
given in Figure 3.26.
Figure 3.25 (a) General disposition of phases in
Ni–S–O system; (b) isothermal section at temperature of
900 K (after Quets and Dresher, 1969, pp. 583–599).
3.2.9 Ternary phase diagrams
3.2.9.1 The ternary prism
Phase diagrams for three-component systems usually
take the standard form of a prism which combines an
equilateral triangular base (ABC) with three binary
system ‘walls’ (A–B, B–C, C–A), as shown in
Figure 3.27a. This three-dimensional form allows the
three independent variables to be specified, i.e. two
component concentrations and temperature. As the
diagram is isobaric, the modified Phase Rule applies.
The vertical edges can represent pure components of
either metallic or ceramic systems. Isothermal contour
lines are helpful means for indicating the curvature of
liquidus and solidus surfaces.
Figure 3.27b shows some of the ways in which the
base of the prism, the Gibbs triangle, is used. For
instance, the recommended method for deriving the
composition of a point P representing a ternary alloy
is to draw two construction lines to cut the nearest
of the three binary composition scales. In similar
fashion, the composition of the phases at each end
of the tie-line passing through P can be derived. Tie-
triangles representing three-phase equilibria commonly
appear in horizontal (isothermal) sections through the
prism. The example in Figure 3.27b shows equilibrium
between ˛, ˇ and phases for an alloy of average
Structural phases: their formation and transitions 65
Figure 3.26 Three-dimensional equilibrium diagram and basic reactions for the Ni–S–O system (after Quets and Dresher,
1969, pp. 583–99).
Figure 3.27 (a) Ternary system with complete miscibility in solid and liquid phases and (b) the Gibbs triangle.
66 Modern Physical Metallurgy and Materials Engineering
Figure 3.28 Derivation of vertical and horizontal sections: (a) lines of construction, (b) vertical section (¾20% C),
(c) isothermal section at temperature T
2
.
composition Q. Each side of the tie-triangle is a
tie-line. Applying the centre-of-gravity principle, the
weight proportion of any phase in the mixture can
be obtained by drawing a line and measuring two
lengths (e.g. % ˛ D QR/R˛ ð100). Congruently-
melting phases can be linked together by a join-
line, thus simplifying interpretation. For example,
component B may be linked to the intermediate
phase A
2
C. Any line originating at a pure component
also provides a constant ratio between the other two
components along its length.
Tie-lines can be drawn across two-phase regions of
isothermal sections but, unlike equivalent tie-lines in
binary systems, they do not necessarily point directly
towards pure components: their exact disposition has to
be determined by practical experiment. It follows that
when vertical sections (isopleths) are taken through the
prism, insertion of tie-lines across a two-phase field is
not always possible because they may be inclined to
the vertical plane. For related reasons, one finds that
three-phase regions in vertical sections have slightly
curved sides.
3.2.9.2 Complete solid miscibility
In the ternary diagram of Figure 3.27a the volume
of continuous solid solubility ˛ is separated from
the liquid phase by a two-phase ˛ CLiquid zone of
convex-lens shape. Analysis of this diagram provides
an insight into the compositional changes attending
the freezing/melting of a ternary solid solution. It is
convenient to fold down the binary ‘walls’ so that
construction lines for isothermal and vertical sections
can be prepared (Figure 3.28a). A vertical section,
which provides guidance on the freezing and melting
of all alloys containing the same amount of component
C, is shown in Figure 3.28b.
Assuming that an alloy of average composition
X freezes over a temperature range of T
1
to T
4
,
Figure 3.28c shows an isothermal section for a
temperature T
2
just below the liquidus. The two-phase
field in this section is bivariant. As the proportions
and compositions of ˛ and liquid L gradually change,
the tie-lines for the four temperatures change their
orientation. This rotational effect, which is shown
by projecting the tie-lines downward onto the basal
triangle (Figure 3.29), occurs because the composition
of the residual liquid L moves in the general
direction of C, the component of lowest melting point,
and the composition of ˛ approaches the average
composition X.
3.2.9.3 Three-phase equilibria
In a ternary system, a eutectic reaction such as
Liquid
˛ Cˇ is univariant F D 1 and, unlike its
binary equivalent, takes place over a range of tempera-
ture. Its characteristics can be demonstrated by consid-
ering the system shown in Figure 3.30a in which two
binary eutectic reactions occur at different tempera-
tures. The key feature of the diagram, a three-phase tri-
angle ˛ Cˇ C Liquid, evolves from the upper binary
eutectic horizontal and then appears to move down
Structural phases: their formation and transitions 67
Figure 3.29 Rotation of tie-lines during freezing of a
ternary solid solution ˛.
three ‘guide rails’ until it finally degenerates into the
lower binary eutectic horizontal. As the temperature
falls, the eutectic reaction Liquid ! ˛ C ˇ takes place;
hence the leading vertex of the triangle represents the
composition of the liquid phase.
A vertical section between component A and the
mid-point of the B–C ‘wall’ (Figure 3.30b) and
an isothermal section taken when the tie-triangle
is about halfway through its downward movement
(Figure 3.30c) help to explain typical solidification
sequences. The vertical section shows that when an
alloy of composition X freezes, primary ˇ formation
is followed by eutectic reaction over a range of
temperature. The final microstructure consists of
primary ˇ in a eutectic matrix of ˛ and ˇ.Ifwe
now concentrate on the immediate surroundings of
the isothermal triangle, as depicted in Figure 3.30d,
primary deposition of ˇ is represented by the tie-line
linking ˇ and liquid compositions. (This type of tie-line
rotates, as described previously.) The eutectic reaction
Liquid ! ˛ C ˇ starts when one leading edge of the
triangle, in this case the tie-line L-ˇ, cuts point X and
is completed when its trailing edge, the tie-line ˛-ˇ,
cuts X. As X is traversed by tie-triangles, the relative
amounts of the three phases can be derived for each
isotherm. For alloy Y, lying on the valley line of the
Figure 3.30 Three-phase equilibrium in a simple ternary system (after Rhines, 1956).
68 Modern Physical Metallurgy and Materials Engineering
eutectic reaction, it can be seen from both sections
that no primary ˇ forms and freezing only produces a
mixture of ˛ and ˇ phases.
These ideas can also be applied to three-phase peri-
tectic reactions in ternary systems, i.e. ˛ CLiquid
ˇ. Being the converse form of the eutectic reaction, its
tie-triangle has the L C ˛ tie-line as the leading side
and a trailing vertex. The ‘inflated’ triangle in vertical
sections is inverted.
3.2.9.4 Four-phase equilibria
The simplest form of four-phase equilibrium, referred
to as Class I, is summarized by the ternary eutectic
reaction, Liquid
˛ Cˇ C . This invariant condi-
tion F D 0 is represented by the triangular plateau
at the heart of Figure 3.31. The plateau itself is solid
and can be regarded as a stack of three-phase triangles,
i.e. ˛ Cˇ C . Each of the three constituent binary
systems is eutectiferous with limited solid solubility.
It is necessary to visualize that, on cooling, each of
the three eutectic horizontals becomes the independent
source of a set of descending three-phase eutectic trian-
gles which behave in the general manner described in
the previous section. At the ternary eutectic level of the
plateau, temperature T
6
, these three triangles coalesce
and the ternary reaction follows. (The lines where tri-
angles meet are needed when sections are drawn.) The
stack of tie-triangles associated with each binary eutec-
tic reaction defines a beak-shaped volume, the upper
edge being a ‘valley’ line. Figure 3.31 shows three
valley lines descending to the ternary eutectic point.
A typical sequence of isothermal sections is shown
in Figure 3.32 over the temperature range T
1
–T
6
.As
the temperature falls, the three eutectic tie-triangles
appear in succession. The liquid field shrinks until, at
Figure 3.31 Phase diagram for a ternary eutectic system
(Class I four-phase equilibrium) (after Rhines, 1956).
temperature T
6
, the three triangles coalesce to form the
larger triangle of four-phase equilibrium. Below this
level, after ternary eutectic reaction, the three solid
phases adjust their composition in accordance with
their respective solvus lines. A vertical section which
includes all alloys containing about 30% component
C is shown in Figure 3.33. The three-phase plateau is
immediately apparent. This section also intersects three
of the binary eutectic reaction ‘beaks’, i.e. Liquid C
˛ Cˇ, Liquid C˛ C and Liquid Cˇ C .
We will consider the solidification of four alloys
which are superimposed on the T
6
isothermal section
of Figure 3.32. The simplest case of solidification is
the liquid ternary alloy W, which transforms to three
phases immediately below the plateau temperature T
6
.
This type of alloy is the basis of fusible alloys which
are used for special low m.p. applications (e.g. plugs
for fire-extinguishing sprinkler systems). For example,
a certain combination of lead (m.p. 327
°
C), tin (m.p.
232
°
C) and bismuth (m.p. 269
°
C) melts at a temper-
ature of 93
°
C. On cooling, liquid alloy X will first
decompose over a range of temperature to form a
eutectic mixture ˛ Cˇ and then change in composi-
tion along a ‘valley’ line until its residue is finally con-
sumed in the ternary eutectic reaction. Liquid alloy Y
will first deposit primary ˇ and then, with rotation of
ˇ CLiquid tie-lines, become depleted in B until it
reaches the nearby ‘valley’ line. Thereafter, it behaves
like alloy X. In the special case of alloy Z, which lies
on a construction line joining the ternary eutectic point
to a corner of the ternary plateau, it will first form a pri-
mary phase and then undergo the ternary reaction:
there will be no preliminary binary eutectic reaction.
We will now outline the nature of two other four-
phase equilibria. Figure 3.34a illustrates the Class II
reaction, Liquid C ˛
ˇ C . As the temperature is
lowered, two sets of descending tie-triangles repre-
senting a peritectic-type reaction and a eutectic-type
reaction, respectively, combine at the ternary reaction
isotherm to form a kite-shaped plane. This plane then
divides, as shown schematically in Figure 3.35a, form-
ing a solid three-phase plateau and initiating a descend-
ing set of eutectic triangles. Unlike Class I equilibrium,
the composition which reacts with ˛-phase lies outside
the limits of the top of the plateau.
From Figure 3.34b, which illustrates Class III
equilibrium, Liquid C˛ C ˇ
, a solid three-phase
plateau is again a central feature. At the higher
temperatures, a eutectic-type reaction Liquid ! ˛ C
ˇ generates a stack of tie-triangles. At the critical
temperature of the ternary peritectic reaction, a large
triangle breaks up and two sets of peritectic-type
triangles are initiated (Figure 3.35b). If the Class II
and Class III ternary reaction sequences are compared
with that of Class I, it will be seen that there
is an inverse relation between eutectic Class I and
the peritectic Class III. Class II is intermediate in
character to Classes I and III.
Structural phases: their formation and transitions 69
Figure 3.32 Horizontal sections at six temperatures in phase diagram of Figure 3.31 (after Rhines, 1956).
70 Modern Physical Metallurgy and Materials Engineering
Figure 3.33 Vertical section through ternary system shown
in Figure 3.31.
3.2.9.5 Application to dielectric ceramics
The phase diagram for the MgO–Al
2
O
3
–SiO
2
system
(Figure 3.36) has proved extremely useful in providing
guidance on firing strategies and optimum phase
relations for important dielectric
1
ceramics. (The
diagram is also relevant to basic steel-making
refractories based on magnesia, i.e. periclase.) Its
principal features are the straight join-lines, which
link binary and/or ternary compounds, and the curving
1
A dielectric is a material that contains few or no free
electrons and has a lower electrical conductivity than a
metal.
‘valley’ lines. Two junctions of these join-lines lie
within the diagram, marking the ternary compounds
sapphirine M
4
A
5
S
2
and cordierite M
2
A
2
S
5
.The
join-lines divide the projection into tie-triangles
(sometimes termed compatibility triangles). These
triangles enable the amounts and composition of stable
phases to be calculated. The topology of the liquidus
surface is always of prime interest. In this system,
the lowest liquidus temperature 1345
°
C is associated
with the tridymite–protoenstatite–cordierite eutectic.
In the complementary Figure 3.37, compositional
zones for four classes of dielectric ceramic have been
superimposed, i.e. forsterite ceramics, low-loss-factor
steatites, steatite porcelains and cordierite ceramics.
These fired ceramics originate from readily-workable
clay/talc mixtures. The nominal formula for talc is
Mg
3
Si
2
O
5
2
OH
2
. Fired clay can be regarded as mul-
lite A
3
S
2
plus silica, and fired talc as protoenstatite
(MS) plus silica: accordingly, the zones are located
toward the silica-rich corner of the diagram. Each fired
product consists of small crystals in a glassy matrix
(20–30%). The amount of glass must be closely con-
trolled. Ideally, control of firing is facilitated when the
amount of glass-forming liquid phase changes slowly
with changing temperature. In this respect, the pres-
ence of a steeply sloping liquidus is favourable (e.g.
forsterite Mg
2
Si
2
O
4
ceramics). Unfortunately, the
other three materials tend to liquefy rather abruptly
and to form too much liquid, making firing a poten-
tially difficult operation.
Figure 3.34 Phase diagrams illustrating (a) Class II equilibrium Liquid C˛
ˇ C, and (b) Class III equilibrium
Liquid C˛ C ˇ
(after Rhines, 1956).
Structural phases: their formation and transitions 71
Figure 3.35 Class II and Class III equilibria in ternary systems.
Figure 3.36 Basal projection for MgO–Al
2
O
3
–SiO
2
system; regions of solid solution not shown (from Keith and Schairer,
1952; by permission of University of Chicago Press).
72 Modern Physical Metallurgy and Materials Engineering
Figure 3.37 Location of steatites, cordierite and forsterite in Figure 3.36 (after Kingery, Bowen and Uhlmann, 1976; by
permission of Wiley-Interscience).
Let us consider four representative compositions A,
B, C and D in more detail (Figure 3.37). The steatite A
is produced from a 90% talc–10% clay mixture. Pure
talc liquefies very abruptly and clay is added to mod-
ify this undesirable feature; even then firing conditions
are critical. Additional magnesia is used in low-loss
steatites (B) for the same purpose but, again, firing is
difficult to control. During cooling after firing, protoen-
statite converts to clinoenstatite: small crystals of the
latter are embedded in a glassy matrix. Low-loss-factor
steatites also have a relatively high dielectric constant
and are widely used for high-frequency insulators.
Cordierite ceramics (C) are thermally shock-resistant,
having a low coefficient of thermal expansion. Despite
their restricted firing range, they find use as electrical
resistor supports and burner tips. Fluxes can be used
to extend the freezing range of steatites and cordierites
but the electrical properties are likely to suffer. In sharp
contrast, forsterite ceramics (D), which are also suit-
able for high-frequency insulation, have a conveniently
wide firing range.
When considering the application of phase diagrams
to ceramics in general, it must be recognized that
ceramic structures are usually complex in character.
Raw materials often contain trace impurities which will
shift boundaries in phase diagrams and influence rates
of transformation. Furthermore, metastable glass for-
mation is quite common. Determination of the actual
phase diagrams is difficult and time-consuming; con-
sequently, experimental work often focuses upon a
specific problem or part of a system. Against this back-
ground, in circumstances where detailed information
Structural phases: their formation and transitions 73
on phases is sought, it is advisable to refer back to
the experimental conditions and data upon which the
relevant phase diagram are based.
3.3 Principles of alloy theory
3.3.1 Primary substitutional solid solutions
3.3.1.1 The Hume-Rothery rules
The key phase diagrams outlined in Section 3.2.8
exhibit many common features (e.g. primary solid
solutions, intermediate phases) and for systems based
on simple metals some general rules
1
governing the
formation of alloys have been formulated. These
rules can form a useful basis for predicting alloying
behaviour in other more complex systems.
In brief the rules for primary solid solubility are as
follows:
1. Atomic size factor — If the atomic diameter of the
solute atom differs by more than 15% from that
of the solvent atom, the extent of the primary
solid solution is small. In such cases it is said that
the size-factor is unfavourable for extensive solid
solution.
1
These are usually called the Hume-Rothery rules because it
was chiefly W. Hume-Rothery and his colleagues who
formulated them.
2. Electrochemical effect — The more electropositive
the one component and the more electronegative
the other, the greater is the tendency for the two
elements to form compounds rather than extensive
solid solutions.
3. Relative valency effect — A metal of higher valency
is more likely to dissolve to a large extent in one
of lower valency than vice versa.
3.3.1.2 Size-factor effect
Two metals are able to form a continuous range of solid
solutions only if they have the same crystal structure
(e.g. copper and nickel). However, even when the
crystal structure of the two elements is the same, the
extent of the primary solubility is limited if the atomic
size of the two metals, usually taken as the closest
distance of approach of atoms in the crystal of the
pure metal, is unfavourable. This is demonstrated in
Figure 3.38 for alloy systems where rules 2 and 3 have
been observed, i.e. the electrochemical properties of
the two elements are similar and the solute is dissolved
in a metal of lower valency. As the size difference
between the atoms of the two component metals A and
B approaches 15%, the equilibrium diagram changes
from that of the copper–nickel type to one of a eutectic
system with limited primary solid solubility.
The size-factor effect is due to the distortion
produced in the parent lattice around the dissolved
misfitting solute atom. In these localized regions the
Figure 3.38 Effect of size factor on the form of the equilibrium diagram; examples include (a) Cu–Ni, Au–Pt, (b) Ni–Pt,
(c) Au–Ni, and (d) Cu–Ag.
74 Modern Physical Metallurgy and Materials Engineering
interatomic distance will differ from that given by the
minimum in the E–r curve of Figure 6.2, so that the
internal energy and hence the free energy, G,ofthe
system is raised. In the limit when the lattice distortion
is greater than some critical value the primary solid
solution becomes thermodynamically unstable relative
to some other phase.
3.3.1.3 Electrochemical effect
This effect is best demonstrated by reference to the
alloying behaviour of an electropositive solvent with
solutes of increasing electronegativity. The electroneg-
ativity of elements in the Periodic Table increases from
left to right in any period and from bottom to top in any
group. Thus, if magnesium is alloyed with elements
of Group IV the compounds formed, Mg
2
(Si, Sn or
Pb), become more stable in the order lead, tin, silicon,
as shown by their melting points, 550
°
C, 778
°
Cand
1085
°
C, respectively. In accordance with rule 2 the
extent of the primary solid solution is small (³7.75
at.%, 3.35 at.%, and negligible, respectively, at the
eutectic temperature) and also decreases in the order
lead, tin, silicon. Similar effects are also observed with
elements of Group V, which includes the elements bis-
muth, antimony and arsenic, when the compounds Mg
3
Bi, Sb or As
2
are formed.
The importance of compound formation in control-
ling the extent of the primary solid solution can be
appreciated by reference to Figure 3.39, where the
curves represent the free-energy versus composition
relationship between the ˛-phase and compound at
a temperature T. It is clear from Figure 3.39a that
at this temperature the ˛-phase is stable up to a
composition c
1
, above which the phase mixture (˛ C
compound) has the lower free energy. When the com-
pound becomes more stable, as shown in Figure 3.39b,
the solid solubility decreases, and correspondingly the
phase mixture is now stable over a greater composition
range which extends from c
3
to c
4
.
The above example is an illustration of a more gen-
eral principle that the solubility of a phase decreases
with increasing stability, and may also be used to show
that the concentration of solute in solution increases
as the radius of curvature of the precipitate particle
decreases. Small precipitate particles are less stable
than large particles and the variation of solubility with
particle size is recognized in classical thermodynamics
by the Thomson–Freundlich equation
ln[cr/c] D 2/kTr (3.7)
where cr is the concentration of solute in equilibrium
with small particles of radius r, c the equilibrium con-
centration, the precipitate/matrix interfacial energy
and the atomic volume (see Chapter 8).
3.3.1.4 Relative valency effect
This is a general rule for alloys of the univalent metals,
copper, silver and gold, with those of higher valency.
Thus, for example, copper will dissolve approximately
40% zinc in solid solution but the solution of copper
in zinc is limited. For solvent elements of higher
valencies the application is not so general, and in fact
exceptions, such as that exhibited by the magnesium-
indium system, occur.
3.3.1.5 The primary solid solubility boundary
It is not yet possible to predict the exact form of the
˛-solid solubility boundary, but in general terms the
boundary may be such that the range of primary solid
solution either (1) increases or (2) decreases with rise
in temperature. Both forms arise as a result of the
increase in entropy which occurs when solute atoms
are added to a solvent. It will be remembered that this
entropy of mixing is a measure of the extra disorder
of the solution compared with the pure metal.
The most common form of phase boundary is
that indicating that the solution of one metal in
another increases with rise in temperature. This follows
Limit of α - solid solution
at this temperature T
Limit of α - solid solution
at this temperature T
Free energy
Composition
(a)
Cmpd
C
2
C
1
α
β
α α + β
Cmpd
α
α
β
α + β
A
Composition
(b)
C
4
C
3
A
Figure 3.39 Influence of compound stability on the solubility limit of the ˛ phase at a given temperature.
Structural phases: their formation and transitions 75
from thermodynamic reasoning since increasing the
temperature favours the structure of highest entropy
(because of the TS term in the relation G D H TS)
and in alloy systems of the simple eutectic type an
˛-solid solution has a higher entropy than a phase
mixture ˛ C ˇ. Thus, if the alloy exists as a phase
mixture ˛ Cˇ at the lower temperatures, it does
so because the value of H happens to be less for
the mixture than for the homogeneous solution at
that composition. However, because of its greater
entropy term, the solution gradually becomes preferred
at high temperatures. In more complex alloy systems,
particularly those containing intermediate phases of
the secondary solid solution type (e.g. copper–zinc,
copper–gallium, copper–aluminium, etc.), the range
of primary solid solution decreases with rise in
temperature. This is because the ˇ-phase, like the ˛-
phase, is a disordered solid solution. However, since it
occurs at a higher composition, it has a higher entropy
of mixing, and consequently its free energy will fall
more rapidly with rise in temperature. This is shown
schematically in Figure 3.40. The point of contact on
the free energy curve of the ˛-phase, determined by
drawing the common tangent to the ˛ and ˇ curves,
governs the solubility c at a given temperature T.The
steep fall with temperature of this common tangent
automatically gives rise to a decreasing solubility limit.
Many alloys of copper or silver reach the limit of
solubility at an electron to atom ratio of about 1.4.
The divalent elements zinc, cadmium and mercury
have solubilities of approximately 40 at.%
1
(e.g.
copper–zinc, silver–cadmium, silver–mercury), the
trivalent elements approximately 20 at.% (e.g. cop-
per–aluminium, copper–gallium, silver–aluminium,
silver–indium) and the tetravalent elements about
13 at.% (e.g. copper–germanium, copper–silicon, sil-
ver–tin), respectively.
The limit of solubility has been explained by Jones
in terms of the Brillouin zone structure (see Chapter 6).
It is assumed that the density of states–energy curve
for the two phases, ˛ (the close-packed phase) and
ˇ (the more open phase), is of the form shown in
Figure 3.41, where the NE curve deviates from the
parabolic relationship as the Fermi surface approaches
the zone boundary.
2
As the solute is added to the
solvent lattice and more electrons are added the top
of the Fermi level moves towards A, i.e. where the
1
For example, a copper–zinc alloy containing 40 at.% zinc
has an e/a ratio of 1.4, i.e. for every 100 atoms, 60 are
copper each contributing one valency electron and 40 are
zinc each contributing two valency electrons, so that
e/a D 60 ð1 C40 ð2/100 D 1.4.
2
The shape of the Fermi surface may be determined from
measurements of physical properties as a function of
orientation in a single crystal. The surface resistance to a
high-frequency current at low temperatures (the anomalous
skin effect) shows that in copper the Fermi surface is
distorted from the spherical shape but becomes more nearly
spherical in copper alloys.
α
α
β
β
Low temperature T
1
High temperature T
2
Free energy
0 C
1
C
2
C
3
C
4
C
1
C
2
C
3
C
4
Composition
(a)
Composition
(b)
T
2
T
1
Temperature
αβα + β
Figure 3.40 (a) The effect of temperature on the relative positions of the ˛- and ˇ-phase free energy curves for an alloy system
having a primary solid solubility of the form shown in (b).