Báo cáo y học: " Dimensional and hierarchical models of depression using the Beck Depression Inventory-II in an Arab college student sample" pot
Bạn đang xem bản rút gọn của tài liệu. Xem và tải ngay bản đầy đủ của tài liệu tại đây (528.9 KB, 14 trang )
RESEARC H ARTIC LE Open Access
Dimensional and hierarchical models of
depression using the Beck Depression Inventory-II
in an Arab college student sample
Fawziyah A Al-Turkait
1
, Jude U Ohaeri
2*
Abstract
Background: An understanding of depressive symptomatology from the perspective of confirmatory factor
analysis (CFA) could facilitate valid and interpretable comparisons across cultures. The objectives of the study were:
(i) using the responses of a sample of Arab college students to the Beck Depression Inventory (BDI-II) in CFA, to
compare the “goodness of fit” indices of the original dimensional three-and two-factor first-order models, and their
modifications, with the corresponding hierarchical models (i.e., higher - order and bifactor models); (ii) to assess the
psychometric characteristics of the BDI-II, including convergent/discriminant validity with the Hopkins Symptom
Checklist (HSCL-25).
Method: Participants (N = 624) were Kuwaiti national college students, who completed the questionnaires in class.
CFA was done by AMOS, version 16. Eleven models were compared using eight “fit” indices.
Results: In CFA, all the models met most “fit” criteria. While the higher-order model did not provide improved fit
over the dimensional first - order factor models, the bifactor model (BFM) had the best fit indices (CMNI/DF = 1.73;
GFI = 0.96; RMSEA = 0.034). All regression weights of the dimensional models were significantly different from zero
(P < 0.001). Standardized regression weights were mostly 0.27-0.60, and all covariance paths were significantly
different from zero. Th e regression weights of the BFM showed that the variance related to the specific factors was
mostly accounted for by the general depression factor, indicating that the general depression score is an adequate
representation of severity. The BDI-II had adequate internal consistency and convergent/discriminant validity. The
mean BDI score (15.5, SD = 8.5) was significantly higher than those of students from other countries (P < 0.001).
Conclusion: The broadly adequate fit of the various models indicates that they have some merit and implies that
the relationship between the domains of depression probably contains hierarchical and dimensional elements. The
bifactor model is emerging as the best way to account for the clinical heterogeneity of depression. The
psychometric characteristics of the BDI-II lend support to our CFA results.
Background
Findings of the multi-domain nature of depressive
symptomatology have led to a search for new descriptive
and explanatory models in the attempt to identify parsi-
monious and distinct dimensions of depression, while
maintain ing the bre adth necessary to encompa ss the full
range of features obser ved clinically [1,2]. These studies
involve the techniques of exploratory factor analysis
(EFA) and confirmatory facto r analysis (CFA). An
understanding of the dimensions of depressive symp-
toms could facilitate valid and interpretable comparisons
across cultures [3]. In addition, specific domains of
depression have been linked with genetic vulnerability
[4], dexamethasone non-suppression [5], localization of
brain lesions [6], clinical outcome in physical illnesses
[7], and characterization of subjects with suicidal and
behavior disorders [8,9].
Asthemostfrequentlyusedself-ratingscalein
depression [10], the Beck Depression Inventory (BDI)
has received the greatest attention in these reports [1].
The original BDI has been revised to correspond with
the DSM-IV criteria [11] for depression (BDI -II: Beck
* Correspondence:
2
Department of Psychiatry, Psychological Medicine Hospital, Gamal Abdul
Naser Road, P.O. Box 4081, Safat, 13041, Kuwait
Al-Turkait and Ohaeri BMC Psychiatry 2010, 10:60
/>© 2010 Al-Turkait and Ohaeri; licensee BioMe d Central Ltd. This is an Open A ccess article distributed under the terms of the Creative
Commons Attribution License ( ), which permits unrestricted use, distribution, and
reproduction in any me dium, provided the original work is properly cited.
et al [12]). In a meta-analysis of factor structures of the
original version of the BDI, Shafer [1] found that the
average number of factors extracted was four (range 2-
7) and average range of variance explained was 46%.
About 30% of studies were student samples. The three
most consistent domains of depression were, “ negative
attitudes to self” , “ per formance impairment” and
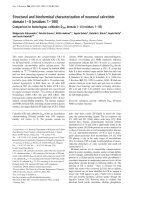
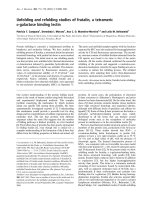
“somatic complaints”. In CFA studies using the BDI -II,
the dimensional model with these three first-order fac-
tors have been shown to have adequate fit to the data
[13,14] (see Fig 1). The BDI-II was origi nally validated
using an outpatient sample (N = 500) and an
undergraduate sample (N = 120)[12]. Each sample
yielded two factors in EFA, using items that loaded ±
0.35 on the corresponding factors. The factors for the
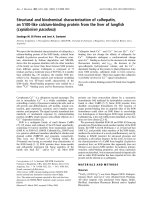
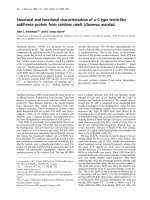
outpatient sample were labeled “somatic -affective” (SA)
and “cognitive ” (C) (i.e., SA-C model). The factors for
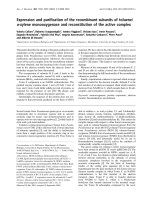
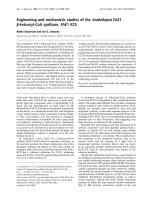
the undergraduate sample were labeled “cognitive-affec-
tive” (CA) and “somatic” (S) (i.e., CA-S model). In sub-
sequent CFA studies using all the items of the BDI-II,
these two-factor models were conf irmed for a clinically
depressed outpatient group [15] (see Fig 2) and for sam-
ples of undergraduate students [16,17] (see Fig 3). How-
ever, in a large sample of Canadian students [18], the
Figure 1 3-factor lower order model.
Al-Turkait and Ohaeri BMC Psychiatry 2010, 10:60
/>Page 2 of 14
Figure 2 Somatic-affective/cognitive model.
Al-Turkait and Ohaeri BMC Psychiatry 2010, 10:60
/>Page 3 of 14
Figure 3 Cognitive-affective/somatic model.
Al-Turkait and Ohaeri BMC Psychiatry 2010, 10:60
/>Page 4 of 14
two-factor solution was rather similar to that from
Beck’s outpatient sample (BDI-II items 1-3, 5-9 and 13-
14 loaded on the “C-A” factor; while items 4,10-12 and
15-21 loaded on the somatic-vegetative factor).
Although several studies have supported these two-fac-
tor solutions in FA using clinical populations [19-25]
and student populations [26-29], some reports were not
supportive [30-35]. In other words, the factorial validity
of the BDI-II is still controversial [32,35], and there is
no formal assignment of items to scales [1]. This con-
troversy is e vident in the few reports on the factor ana-
lysis of the BDI-II from the Middle East. While one
Iranian report on students supported the two-factor
model [27], another Iranian st udy reported a five-factor
solution [35]. One study from the Arabian Gulf state of
Bahrain [36] (with similar Arabic language dialect as
Kuwait) found three factors ("cognitive-affective”, “ overt
emotional upset”,and“somatic -vegetative”) which were
much similar to the original three factors (except that
the Bahraini BDI-II items: 4,8,10-13,17 constituted the
“overt emotional upset” domain).
The relationship between the items of any question-
nairewheretherearediverseindicatorsofacomplex
construct can be described as existing in dimensional
and hierarchical models [1,14,3 7]. In the dime nsional
model, the first-(o r lower-) order factors (or domains)
exist on o nly one plane in whic h they may freely rel ate
with one another. In the hierarchal model, the factors
are disposed in two or more levels (or hierarchs) in
which the relationship between the lower order factors
is restricted (i.e., either no relationship or indirect rela-
tionship through a higher-order factor). There seems to
be an emerging consensus in the CFA literature on the
BDI that, while the classical first-order multi-factor
models (i.e. d imensional models) (e.g., Figs 1, 2 and 3)
provide adequate fit to the da ta, the hierarchi cal models
tend to provide better fit indices [13-15,38-43]. It has
been suggested that the first-order dimensional models
are probably too limited to fully describe the heteroge-
neity observed among people with depression [2]. Of
the two hierarchical models described for depression,
the higher-order model has received more attention i n
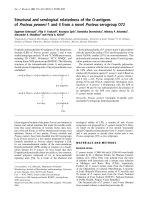
the literature than the bifactor model[14]. In the higher
order model [44], the lower order factors/sub-factors
(e.g., “C-A” and “S”) are modeled as differential elements
(or facets) of a general depression (second - order) fac-
tor that permeates the instrument as a whole; but this
general factor is not directly related to the individual
(observed) items of the BDI-II (see Fig 4). The bifactor
approach assumes a general factor underlying all vari-
ables (e.g., all items of the BDI-II); but in addition it
includes a number of uncorrelated group factors con-
sisting of two or more variables (e.g., “ C-A” and “ S” )
(see Fig 5). The bifactor approach was initially
developed in the context of research on cognitive abil-
ities by Holzinger and Swineford [45], but has been
extended to psychopathologybyworkersinthefieldof
externalizing disorders [44], depression [46] and health-
related quality of life [47]. In these hierarchical models,
the lower orde r factors reflect the specific contents of
the mood state, and provide a basis for differentiation
between patient groups, while the upper level reflects
their common characteristics [48,49].
There is a paucity of studies that have used the bifac-
tor approach to compare the v arious first-order f actor
models of the BDI-II [14]. Since over 30% of facto r ana-
lytic studies of the BDI were based on samples of col-
lege students [1], we have studied an undergraduate
sample in order to make our findings comparable with
the int ernational literature. Several authors have
expressed the need to use the BDI-II to test the m odels
in student populations across cultures because of their
homogeneity and comparability [14,16-18,26,27,29]; and
the sample of college stud ents was found to be useful in
the original validation studies of the BDI-II because it is
a close approximation to the general population [12].
Also, our use of symptom-level data has the potential to
expose greater variation in the data than disorder-level
variables [2].
The objectives of the study were: (i) using the
responses of a sample of Arab college students to the
Beck Depression Inventory (BDI-II) in CFA, to compare
the “ goodness of fit” indices of the original dimensional
three-and two-factor first-order models, and their modi-
fications (Figs 1, 2 and 3), with the corresponding hier-
archical models (i.e., higher - order and bifactor models)
(Figs 4 and 5). We also examined the Bahraini model
[36] because it is the only one from our region, and the
Dozois model from college students [18], because it was
similar to the original two-factor model from an outpa-
tient sample; (ii) to assess the following psychometric
characteristics of the BDI-II, in comparison with the
international data: internal consistency, item mean
scores, corrected item-total correlations, and conver-
gent/discriminant validity with the anxiety and depres-
sion subscale scores of the Hopkins Symptom Checklist
(HSCL-25) [50].
Based on the literature [14,17,35,42,43,46], we
hypothesized that the hierarchical models would have
better fit in dices than the dimensional first-order mod-
els; the bifactor models would have the best fit indices;
and the psychometric characteristics of the BDI-II
would be adequate.
Method
Setting, subjects and procedure
Kuwait is a conservative Arab country situated in the
Arabian Gulf. Study participant s were students of the
Al-Turkait and Ohaeri BMC Psychiatry 2010, 10:60
/>Page 5 of 14
Figure 4 Higher order model.
Al-Turkait and Ohaeri BMC Psychiatry 2010, 10:60
/>Page 6 of 14
Figure 5 Bifactor model using CA-S model.
Al-Turkait and Ohaeri BMC Psychiatry 2010, 10:60
/>Page 7 of 14
College of Education, Public Authority for Applied Edu-
cation and Training (PAAET), Kuwait. This is a four-
year program degree - awarding institution with a total
population of 8000 students (2000 men, 6000 women).
Following the example of several studies with similar
objectives in the literature [12-19] (some of which
recruited participants by newspaper advertisements), our
methodology did not require a probability sample, espe-
cially as this was not a study of the prevalence of the
disorder.
The 624 participants consisted of 182 (29.2%) men
and 442 (70.8%) women from all the years of study.
This was fairly similar to the ratio of men to women in
the entire student population. They were aged 18 to 38
years (mean = 20.8; SD = 2.9; mode and median = 20
years).
Participants completed the questionnaires in the 2007/
2008 academic session. They were approached in class
at the end of lectures by the research team. In order to
include students in all the disciplines, the classes chosen
were compulsory general studies’ courses. One general
studies’ course was chosen per year of study for the four
years of study. They s elf-completed the questionnaires
anonymously. First, the objectives of the study were
explained. The students were duly informed that they
were free to decline to participate, and that there would
be no penalty for refusing to participate. They gave ver-
bal informed c onsent. The study was approved by the
institutional review panel of the PAAET.
Beck Depression Inventory (BDI -II)
Like the original BDI, the BDI-II has 21 items, each of
which consists of four self-evaluati ve statements in a
time frame of two weeks, and scored 0 to 3, with
increasing scores indicating greater depression severity.
Responses are summed to yield a total score that ranges
from 0 to 63. The BDI-II has been used in previous stu-
dies of samples of students and primary health care
attendees in the Arabian Gulf, including Kuwait
[36,51,52], and an Arabic translation exists, produced by
the method of back-translation. The internal consistency
(Cronbach’s alpha) for the 21 items, using the responses
of all participants was 0.83.
Hopkins Symptoms Checklist-25 [50]
The HSCL-25 is presented in the context of convergent/
discriminant validity for our primary analyses on psy-
chometric characteristics. The first ten items of the
questionnaire concern anxiety while the remaining 15
items relate to depre ssion. The response options for
each item are: “notatall”, “ a little”, “ quite a bit”,and
“extremely” , rated 1-4 respectively. Higher scores indi-
cate worse mental functioning. Three summed scores
are calculated: the total score is the average of all 25
items; the anxiety score is the average of the 10 anxiety
items; while the depression score is the average of the
15 depression items. The internal consistency (Cron-
bach’ s alpha values) of the questionnaire for the
responses of all 624 participants are as follows: (i) for
the 25 items, 0.91; (ii) for the 10 anxiety items, 0.85;
and (iii) for the 15 depression items, 0.86.
Data analysis
Data were analyzed by the Statistical Package for Social
Sciences, version 15 (SPSS Inc., Chicago, Illinois). Struc-
tural equation modeling (SEM) operations (CFA) were
done by Analysis of Moments Structures (AMOS), ver-
sion 16 [53].
The CFA operations involved comparison of “ fi t”
indices of BDI-II models from the previous studies ear-
lier highlighted. These were: (i) the first - (or lower-)
order three-factor model (Fig 1); (ii) the two-factor “SA-
C” model (Fig 2); (iii) the two-factor “CA-S” model (Fig
3); (iv) the two-factor Dozois et al model [18]; (v) the
three-factor Bahrain model [36]; (vi) the higher order
models of each of these lower - order factor models (Fig
4); (vii) the bifactor model of each of the lower-or der
factor models (Fig 5); and (viii) the one-factor general
depression model [35].
CFA is done by comparing the “goodness - of - fit”
(GOF) indices of the various models. We used the maxi-
mum likelihood method of estimation (MLE). There are
three broad types of GOF measures. Hooper et al [54]
have suggested that, while there are no golden rules for
ass essment of model fit, reporting a v ariety of indices is
necessary because different indices reflect different
aspects of a model fit. In addition, fit indices may not
perform uniformly across conditions [37]. Hence, in
order to examine the robustness of our results and
make our findings comparable with the international
data, we chose fit indices from each of the three GOF
measures [54], viz:
(a) Absolute fit indices, which do not make any com-
parison to a specified null model, or adjust for the num-
ber of parameters in the estimated model. From this
group we chose the following: (i) the normed chi-square
(chi-square or CMIN/DF). A value of <5 is considered
adequate fit, while ≤2 is considered excellent fit [54]; (ii)
GOF Index (GFI); (iii) adjusted GFI (AGFI). A value >
0.90 is considered adequate fit, while ≥0.95 is considered
excellent fit, especially for small sample sizes [54]; (iv)
Root mean square error of approximation (RMSEA).
The recommended value is < 0.08 for adequate fit and <
0.06 for excellent fit [54];
(b) Incremental fit indices, which assess how well the
estimated model fits relative to some alternative (null)
model. From this group we chose: (v) Tucker-Lewis
Index (TLI) or non-normed fit index (NNFI); and (vi)
Al-Turkait and Ohaeri BMC Psychiatry 2010, 10:60
/>Page 8 of 14
comparative fit index (CFI). The recommended value is
> 0.90 for adequate fit and ≥0.95 for excellent fit; (c)
Parsimony fit indices, which attempt to correct any
overfitting of the model and evaluate the parsimony of
the model compared to the GOF. From this group we
chose: (vii) the parsimony comparative fit index (PCFI).
Therecommendedvalueis>0.6.Finally,weused(viii)
the Akaike Information Criterion (AIC) , a parsimony fit
index, to make an overall comparison. A model with the
smaller AIC has the better fit [54].
Assessment of multivariate normality of distribution of
data in AMOS, using recommendations for item skew-
ness (± 3) and kurtosis (± 7) [55] indicated that the data
did not significantly deviate from normality. (For our
sample, skew was 0.43-2.39; and kurtosis was - 0.28-
6.87, all of which were within the recommended ranges).
Corrected total item correlations, mea sured by Pea r-
son’ s correlation, were assessed after controlling for
item overlap. Since the summary scores of the BDI fac-
tors and the anxiety/depression scores of the HSCL-25
were fairly normally distributed, gender differences in
the BDI summary scores were assessed by t-tests, while
their correlations with the HSCL-25 was done by Pear-
son’s correlation. Comparison of our BDI mean s cores
with those of student data from other countries was
done by effe ct size calculations. The l evel of statistical
significance was set at P < 0.05.
Results
The highlights of the CFA results are as follows (Table
1): (i) all the models met most of the criteria for good
“ fit” , with CMIN/DF < 2.4, GFI > 0.90, AGFI > 0.90,
PCFI > 0.74, and RMSEA < 0.05; (ii) for the dimensional
first - order factor models, all regression weights (0.57-
2.2) were significantly dif ferent from zero at 0.001 to
0.004 levels, two-tailed; and all covariance paths between
the factors were significant . The standardized regression
weights were 0.27 -0. 60 for 20 items, and 0. 14-0. 16 for
the item on concentration (BDI item 19). Further details
for the standardized regression weights are as follows,
using the results for Fig 1: 0.15-0.29 (for two items),
0.30-0.39 (three items), 0.40-0.49 (for eight items), 0.50-
0.59 (five items) and 0.60 (for two items); (iii) the higher
- order models and the one-factor model had identical
fit indices; (iv) judging by the AIC values, the higher -
order models did not result in better “ fit” to the data
(514.13), in comparison with the first - order factor
models (481.7-510.4), especially as th ey had similar
NNFI and CFI indices (each < 0.90 for the higher order
models); (v) the bifactor versions (especially of the two-
factor first order models) had the best fit indices, includ-
ing the lowest AIC values. The bifactor version of the
CA-S model (i.e., Beck et al [12] model from students’
sample) had the best fit indices, with the lowest CMIN/
DF and AIC values; (vi) the regression weights of the
general factor of the bifactor models (0.51-2.5) were all
significantly different from zero, mostly at 0.001 level,
two-tailed. The standardized regression weights of the
general factor for BDI items 1-18 were 0.35 -0.59 (i.e.,
accounted for 12.3% -35% of variance explained), 0.27
for BDI-II items 20 and 21(i.e., 7.3% variance) and 0.11
for item 19 (i.e., 1.2% of variance); (vii) the regression
weights of the uncorrelated first-order factors of the
bifactor models were not significantly different from
zero. This suggests that the variance related to these
specific factors was mostly explained by the general fac-
tor [47]. There was no particular tendency for cognitive
symptoms to load higher than the somatic symptoms.
The alpha coefficients of the two-factor models are as
follows: (i) CA-S model: factor CA (No. of items = 16):
0.81; factor “S” (No. of items = 5): 0.49; (ii) SA-C model:
factor “C” (No. of items = 9): 0.73, factor “ SA” (No. of
items = 12): 0.72.
The mean total BDI score was 15.5 (SD = 8.5), and
median was 14. The mean scores for the items ranged
from 0.26 to 1.1 (average 0.76) (Table 2). Using standard
cut-off scores [12], 125 (20.0%) had moderate depression
(score 21-30); 33 (5.3%) had severe depression (score 31-
40), while 5(0.8%) had extreme depression (score 41-63).
The BDI total score for women (16.2, SD = 8.8) was sig-
nificantly higher than that for men (14.04, SD = 7.5)
(t = 2.82, df = 622, P < 0.005). This significant gender
trend was maintained for summary scores for the
doma ins of the two-factor models (P < 0.01), except the
cognitive factor of the SA-C model (P = 0.088).
All corrected item-total correlations were significant
(P < 0.001); for items 1-18 (range of r: 0.36 -0.52) it was
mostly 0.40 -0.49; it was lowest for “ concentration”
(0.14) (Table 2).
All correlations with the HSCL-25 domain scores were
highly significant (r mostly > 0.5, P < 0.001) (Ta ble 3).
The summed scores of the cognitive factors of the two-
factor models had significantly higher correlations with
the depression score of the HSCL-25 (r: 0.66-0.70) than
with the HSCL-25 anxiety score (r: 0.54-0.57) (Z = 3.9,
P < 0.001).
Discussion
We analyzed the responses of 624 Arab college students
to the BDI-II, in order to investigate whether the exist-
ing factor structures fit the data. We did this by com-
paring the “fit” of eleven models of depression at lower
order (dimensional) and hierarchical levels to the data,
using eight “fit” indices. We also examined the psycho-
metric characteristics of the BDI-II. Our results were
broadly in support of the majority finding s in the litera-
ture, indicating that the multi-domain structure of the
BDI-II is robust, t he bifactor model is the best
Al-Turkait and Ohaeri BMC Psychiatry 2010, 10:60
/>Page 9 of 14
representation of the relationship b etween the items of
depression, and the psychometric characteristics of the
BDI-II are adequate. We note that, in exploratory factor
analysis by principal axis factoring and oblique rotation
for our data, four factors emerged, accounting for 41.8%
of varia nce explained, and that these factors were effec-
tively one-half of each of the two domains of the data
for college students from the USA (data not shown)
[12,16,17].
While the first - order factor dimensional models had
mostly similar fit indices (AIC values: 481.7 -510.4), the
original three - factor model had a slightly better fit.
Although the higher - order version of these lower order
models did not result in improved fit, the bifactor models
did. Interestingly, the bifactor version of the CA-S model
(derived from data of college students by Beck et al [12])
had the best fit indices, indicating the robustness of this
model within samples of students across cultures. The
loadings on the general factor of the bifactor model pro-
vide some insight into the nature of the specific domains
of the BDI-II. First, we were surprised that for such a con-
servative culture, the item on sex (BDI-II 21) was appar-
ently not much problematic for this age group [12,14],
since it had highly significant loadings (regression weights
on its lower order factor in the various models was 0.56
-0.89, P < 0.001) and the standardized regression weight
on the general factor of the bifactor model was 0.27. How-
ever, along with the item on concentration and tiredness/
fatigue, they constituted the lowest standardized regression
weights (< 0.3), implying that they are poor indicators of
the latent construct [56]. Second, the regression weights of
the specific, uncorrelated factors of the BFM were not sig-
nificantly differen t from zero, indicating that these lower
order factors were very closely related to the general factor
because the variance related to them was mostly explained
by the general factor [47]. This supports the use of the
Table 1 Confirmatory factor analyses of the BDI-II: comparison of models by MLE method. N = 624
Models CMNI/
DF
1
GFI
2
AGFI
3
TLI:
NNFI
4
CFI
5
PCFI
6
RMSEA
7
AIC
8
Regression weights: P values Standardized regression
weights
3-factor: Fig 1 2.11 0.94 0.93 0.89 0.90 0.79 0.042 481.7 All significant at
0.001, 2-tailed
For BDI 19: 0.14
Others: 0.27- 0.60. All
covariance paths b/w
factors: P <0.001
Higher order for
3-factor
2.28 0.94 0.92 0.87 0.89 0.79 0.045 514.1 All significant at 0.001, 2-tailed, except
“concentration” (0.004)
BDI 19 = 0.14
Others: 0.26-0.59
Bifactor for 3-
factor
2.10 0.95 0.93 0.89 0.91 0.73 0.042 479.4 For general factor, all P < 0.001; for
other factors, P >0.05
For general factor:
BDI 19 = 0.16
Others: 0.25-0.59
SA-C: Fig 2 2.16 0.94 0.93 0.88 0.89 0.80 0.043 492.7 All significant at
0.001, 2-tailed
BDI 19 = 0.14
Others: 0.27 -0.60
CA-S: Fig 3 2.3 0.94 0.92 0.88 0.89 0.79 0.045 510.4 All P <0.001, except ‘concentration”
(0.002)
BDI 19 = 0.16
Others: 0.30-0.60
Higher order for
SA-C and CA-S
(Fig 4)
2.28 0.94 0.92 0.87 0.89 0.79 0.045 514.1 All P < 0.001, except concentration 0.14-0.59
Bifactor for SA-C 1.82 0.95 0.94 0.92 0.94 0.75 0.036 431.4 For general factor: P <0.001, except
BDI 19 = 0.04. For other factors, mostly
P > 0.05
General factor: BDI 19:
0.097
Others: 0.25-0.60
Bifactor for CA-S
(Fig 5)
1.73 0.96 0.94 0.93 0.94 0.75 0.034 416.7 For general factor: P < 0.001, except
BDI 19 = 0.02. For other factors, mostly
P > 0.05
General factor: BDI 19: 0.14.
Other items: 0.28-0.59
One-factor 2.28 0.94 0.92 0.87 0.89 0.79 0.045 514.1 All P < 0.001, except concentration
(0.004)
BDI 19 = 0.14
Others: 0.28-0.59
Bahrain* 2.17 0.94 0.93 0.88 0.89 0.79 0.043 494.4 All P <0.001, except ‘concentration”
(0.003)
BDI 19 = 0.15
Others: 0.38-0.60. All
covariance paths: P < 0.001
Dozois** 2.12 0.94 0.93 0.89 0.90 0.81 0.042 484.6 All P < 0.001, except ‘concentration’
(0.004)
BDI 19 = 0.14
Others = 0.27 -0.61
Covariance paths: P < 0.001
Notes:
1
CMIN/DF = Chi-square divided degre es of freedom;
2
GFI = “goodness-of-fit” index;
3
AGFI = Adjusted GFI;
4
TLI = Tucker -Lewis Index or Non-normed fit
index;
5
CFI = comparative fit index;
6
PCFI = Parsimony adjusted comparative fit index;
7
RMSEA = root mean square error of estimation;
8
AIC = Akaike information
criterion.
Standard values for the above fit indices are: GFI, AGFI, CFI, TLI: > 0.9
For others: PCFI > 0.6; CMIN/DF < 5; RMSEA < 0.08. In comparing models, the one with lesser AIC indicates better fit to the data.
* BDI items: 4,8,10-13,17 constituted the “overt emotional upset” domain
** BDI items 1-3, 5-9 and 13-14 loaded on the “C-A” factor; while items 4,10-12 and 15-21 loaded on the somatic-vegetative factor
Al-Turkait and Ohaeri BMC Psychiatry 2010, 10:60
/>Page 10 of 14
total score for assessment of severity of depression [45,57].
However, the dimensional models from the lower order
factors also had adequate fit to the data. The interpretation
of these findings, according to the theory of bifactor mod-
els [46], is that, while the general factor of the bifactor
model represents the common trait shared by all the items
of the BDI (e.g., low positive affect - [58]), the lower order
factors are independent sources of common variation (e.g.,
tendency to endorse cognitive or somatic symptoms) that
reflect coherency among particular subgroups of symp-
toms. In line with this, Shafer[1] concluded from a meta -
analysis of the factor structure of four popular depression
rating scales, that these instruments can be conceptualized
as measuring a single, higher order general depression fac-
tor, and at a lower level as measuring a number of specific
depression symptom - factors. This pattern of relationship
has been shown to be useful in settings, such as intelli-
gence, externalizing disorders, health-related quality of life,
and psychopathology [44,46,47,37,59,60]. Using the exam-
ple of studies in attention deficit hyperactivity disorder
[60], the clinical implication is that the symptom domains
interact synergistically to give rise to the heterogeneous
expression of clinical depression.
Finally, we have replicated the finding that the bifactor
model tends to result in improved “fit” statistics in CFA
[44,37,59]. In other words, the bifactor model appears to
be emerging as the best representation of relationships
in general constructs that are comprised of several
highly related domains.
We have replicated the robust finding in the literature
that the BDI-II is psych ometrically sound across cultures,
because the internal consistency was adequate, our mean
item score was similar to the average for student samples,
all corrected item -total correlations were significant (P <
0.001), there was adequate convergent/discriminant
validity using the HSCL-25, and the women had signifi-
cantly higher scores than the men [35].
The mean total BDI-II score for our subjects was
much significantly higher than those of students
reported from neighboring Iran (9.79, SD = 7.96,
Table 2 Psychometric characteristics of the BDI-II: N = 624
BDI-II item Corrected item total correlation Mean (SD) % subjects scoring > 0
BDI 1: sadness 0.46 0.86(0.73) 70.0
BDI 2: pessimism 0.42 0.52(0.80) 36.4
BDI 3: past failure 0.48 0.49(0.76) 33.5
BDI 4: loss of pleasure 0.42 0.95(0.97) 62.0
BDI 5: guilty feelings 0.36 0.91(0.86) 60.4
BDI 6: punishment feelings 0.41 0.75(0.95) 45.7
BDI 7: self-dislike 0.51 0.40(0.73) 28.2
BDI 8: self-criticalness 0.36 1.1(0.87) 76.6
BDI 9: suicidal thoughts 0.45 0.26(0.54) 22.4
BDI 10: crying 0.39 0.73(1.1) 40.5
BDI 11: agitation 0.37 0.98(1.1) 63.5
BDI 12: loss of interest 0.39 0.64(0.79) 45.7
BDI 13: indecisiveness 0.52 0.98(0.89) 63.1
BDI 14: worthlessness 0.40 0.49(0.81) 29.3
BDI 15: loss of energy 0.50 0.99(0.81) 67.9
BDI 16: sleep pattern 0.43 0.83(0.82) 61.7
BDI 17: irritability 0.49 1.1(0.93) 72.3
BDI 18: appetite 0.37 0.68(0.84) 49.0
BDI 19: concentration 0.14 0.75(1.0) 44.6
BDI 20: tiredness 0.26 0.68(0.84) 49.0
BDI 21: loss of interest in sex 0.23 0.47(0.81) 30.8
Table 3 convergent validity: Pearson’s correlations for domains of BDI-II with HSCL-25 anxiety and depression
subscale scores: N = 624
BDI-II models HSCL-25 anxiety subscale: r* HSCL-25 depression subscale: r* HSCL-25 total: r*
CA-S model: cognitive domain 0.57 0.70 0.69
CA-S model: somatic domain 0.48 0.57 0.54
SA -C model: cognitive domain 0.54 0.66 0.66
SA - C model somatic domain 0.56 0.65 0.66
*P<0.0001
Al-Turkait and Ohaeri BMC Psychiatry 2010, 10:60
/>Page 11 of 14
N = 125) [27], as well as those from North America,
reported by Beck and colleagues [12] (12.56, SD = 9.93,
N = 120), Dozois et al [18] (9.11, SD = 7.57), Whisman
et al [16] (8.36, SD = 7.16, N = 576), and Storch et al
[17] (11.03, SD = 8.17) (Effect sizes ranged from 0.34 to
0.91; 95% C.I. ranged from 0.14 to 1.03). While only one
item was endorsed by over 50% of subjects in the Ira-
nian report, eight items were endorsed by over 50% of
our participants (Table 2). In the five-country European
study of non-clinical samples, Nuevo et al [3] reported
that the BDI-I mean scores ranged from 3.12(SD = 4.8;
N = 1245) for Spain, to 8.51 (SD = 9.16; N = 456) for
Ireland. Eight items were endorsed by 60.4%-70% of our
subjects.
We have no specific explanation for the relatively high
rate of depressive symptoms among our subjects. How-
ever, we note that in r ecent face-to-face interview-based
reports on posttraumatic stress disorder (PTSD) among a
representative sample of Kuwaiti military men, their
wives and children, it was found that, six years after the
First Gulf War, the prevalence of PTSD remained high
among the subj ects(31.5% for the men, 28% for their
wives, and 14% anxiety/depression for their children)
[61-63]. The speculation is that Kuwaitis may be prone
to anxiety/dep ression because of their experience during
the Iraqi occupation and the heightened security situa-
tion that persisted thereafter [61]. In a review of epide-
miological studies of anxiety disorders in the Arab world,
it was found that the prevalence of anxiety was highest in
post conflict countries, such as Algeria, Palestine and
Lebanon [64]. Furthermore, university students in two
Ara b countries (Lebanon and the UAE) had high er anxi-
ety scores than comparison Canadian students [64].
Limitations and strengths
Although our study was cross -sectional and based on
only one population, our findings have merit because we
performed the CFA in a standard manner, using a large
sample size and with a broad variety of indices to judge
the fitness of hierarchical and dimension al models to
the data. However, our sample is different from the gen-
eral population because it is made up of a homogenous
group of individuals from one college. Hence, future
studies in this setting should attempt to study other
population groups in order to see how r eplicable the
findings are in various population groups.
Although it has been noted that it is difficult to inter-
pret what the general factor of the bifactor model mea-
sures [31], we suggest that the needed interpretation has
been provided by theorists in the field, as indicated
above [46,47,37,59], and that the success of the tripartite
model of anxiety and depression [58,65] implies that
low positive affect is a good proxy for the general factor.
Conclusions
As alternative approaches for representing the multi-
domain construct of depression, the broadly adequate fit
of the various models shows that they have some merit.
This implies that the relationship between the domains
of depression probably contains hierarchical and dimen-
sional elements. In support of this point, it has been
reported that models are not mutually exclusive; they
can coexist in different parts of the same complex
model [47,66]. In line with this view, and using the
example of externalizing disorders, Krueger and Piasecki
[67] have su ggested that a hierarchical spectrum model
treats psychopathological variations as contin uous and
dimensional;andthatthecontinuous variations are
organized in a hierarchy. That is, while the general fac-
tor of the bifactor model represents the unifying, inter-
nalizing liability to depression, the specific factors
represent the etiologic variables that undergird the phe-
notypic coherence of this liability[68]. The hierarchical
model represented by the bifactor approach is emerging
as the best way to account for the clinical heterogeneity
of depression, and the adequacy of the psychometric
characteristics of the BDI-II in our sample lends support
to this view. This is in line with the emerging evidence
that a hierarchic al model is the best representation of
affect and psychopathology [48,49,65,67].
Acknowledgements
The project was carried out with a grant from the Public Authority for
Applied Education and Training to FAA (Grant number BE-08-08). Dr A. M. El-
Abassi played an invaluable role in data analysis. Joy Wilson coded some of
the data. We thank Charles Osuagwu and Ramani Varghese for their role in
locating literature.
Author details
1
Department of Psychology, College of Education, Public Authority for
Applied Education and Training, Kuwait, P.O. Box 117, Safat, 13002, Kuwait.
2
Department of Psychiatry, Psychological Medicine Hospital, Gamal Abdul
Naser Road, P.O. Box 4081, Safat, 13041, Kuwait.
Authors’ contributions
FAA conceived the study and supervised collection of data. FAA and JUO
designed the study and analyzed the data. FAA and JUO drafted the
manuscript. All authors read and approved the manuscript.
Competing interests
The authors declare that they have no competing interests.
Received: 29 January 2010 Accepted: 29 July 2010
Published: 29 July 2010
References
1. Shafer AB: Meta-analysis of the factor structures of four depression
questionnaires: Beck, CES-D, Hamilton and Zung. J Clin Psychol 2006,
62:123-146.
2. Simms LJ, Gros DF, Watson D, O’Hara MW: Parsing the general and
specific components of depression and anxiety with bifactor modeling.
Depress Anxiety 2008, 25:E34-E46.
3. Nuevo R, Dunn G, Dowrick C, Vázquez-Barquero JL, Casey P, Dalgard OS,
Lehtinen V, Ayuso-Mateos JL: Cross-cultural equivalence of the Beck
Al-Turkait and Ohaeri BMC Psychiatry 2010, 10:60
/>Page 12 of 14
Depression Inventory: a five-country analysis from the ODIN study. J
Affect Disord 2009, 114:156-62.
4. Duncan LE, Hutchison KE, Carey G, Craighead WE: Variation in brain-
derived neurotrophic factor (BDNF) gene is associated with symptoms
of depression. J Affect Disord 2009, 115:215-219.
5. Schotte CK, Maes M, Cluydts R, De Doncker D, Cosyns P: Construct validity
of the Beck Depression Inventory in a depressive population. J Affect
Disord 1997, 46:115-125.
6. Pujol J, Bello J, Deus J, Cardoner N, Martí-Vilalta JL, Capdevila A: Beck
Depression Inventory factors related to demyelinating lesions of the left
arcuate fasciculus region. Psychiatry Res 2000, 99:151-159.
7. Thombs BD, Ziegelstein RC, Parakh K, Stewart DE, Abbey SE, Grace SL:
Probit structural equation regression model: general depressive
symptoms predicted post-myocardial infarction mortality after
controlling for somatic symptoms of depression. J Clin Epidemiol 2008,
61:832-839.
8. Grunebaum MF, Keilp J, Li S, Ellis SP, Burke AK, Oquendo MA, Mann JJ:
Symptom components of standard depression scales and past suicidal
behavior. J Affect Disord 2005, 87:73-82.
9. Bennett DS, Ambrosini PJ, Bianchi M, Barnett D, Metz C, Rabinovich H:
Relationship of Beck Depression Inventory factors to depression among
adolescents. J Affect Disord 1997, 45:127-134.
10. Demyttenaere K, De Fruyt J: Getting what you ask for: on the selectivity
of depression rating scales. Psychother Psychosom 2003, 72:61-70.
11. American Psychiatric Association: Diagnostic and statistical manual for
mental disorders. Arlington VA , 4 1994.
12. Beck AT, Steer RA, Brown GK: Beck Depression Inventory manual. San
Antonio, TX: Psychological Corporation, 2 1996.
13. Harris CA, D’Eon JL: Psychometric properties of the Beck Depression
Inventory - second edition (BDI-II) in individuals with chronic pain. Pain
2008, 137:609-622.
14. Byrne BM: Factor analytic models: viewing the structure of an
assessment instrument from three perspectives. J Pers Assess 2005,
85:17-32.
15. Steer RA, Ball R, Ranieri WF: Dimensions of the Beck Depression Inventory
-II in clinically depressed outpatients. J Clin Psychol 1999, 55:117-128.
16. Whisman MA, Perez JE, Ramel W: Factor structure of the Beck Depression
Inventory- second edition (BDI-II) in a student sample. J Clin Psychol 2000,
56:545-551.
17. Storch EA, Roberti JW, Roth DA: Factor structure, concurrent validity, and
internal consistency of the Beck Depression Inventory -second edition in
a sample of college students. Depress Anxiety 2004, 19:187-189.
18. Dozois DJA, Dobson KS, Ahnberg JL:
A psychometric evaluation of the
Beck Depression Inventory-II. Psychol Assess 1998, 10:83-89.
19. Palmer EJ, Binks C: Psychometric properties of the Beck Depression
Inventory-II with incarcerated male offenders aged 18-21 years. Crim
Behav Ment Health 2008, 18:232-242.
20. Munoz DJ, Chen E, Fischer S, Roehrig M, Sanchez-Johnson L, Alverdy J,
Dymek-Valentine M, le Grange D: Considerations for the use of the Beck
Depression Inventory in the assessment of weight-loss surgery seeking
patients. Obes Surg 2007, 17:1097-101.
21. Basker M, Moses PD, Russell S, Russell PS: The psychometric properties of
Beck Depression Inventory for adolescent depression in a primary-care
paediatric setting in India. Child Adolesc Psychiatry Ment Health 2007,
1(1):8.
22. Poole H, Bramwell R, Murphy P: Factor Structure of the Beck Depression
Inventory-II in patients With chronic pain. Clin J Pain 2006, 22:790-8.
23. Visser M, Leentjens AF, Marinus J, Stiggelbout AM, van Hilten JJ: Reliability
and validity of the Beck depression inventory in patients with
Parkinson’s disease. Mov Disord 2006, 21:668-72.
24. Penley JA, Wiebe JS, Nwosu A: Psychometric properties of the Spanish
Beck Depression Inventory-II in a medical sample. Psychol Assess 2003,
15:569-77.
25. Kojima M, Furukawa TA, Takahashi H, Kawai M, Nagaya T, Tokudome S:
Cross-cultural validation of the Beck Depression Inventory-II in Japan.
Psychiatry Res 2002, 110:291-9.
26. Wiebe JS, Penley JA: A psychometric comparison of the Beck Depression
Inventory-II in English and Spanish. Psychol Assess 2005, 17:481-485.
27. Ghassemzadeh H, Mojtabai R, Karamghadiri N: Psychometric properties of
a Persian-language version of the Beck Depression Inventory–Second
edition: BDI-II-PERSIAN. Depress Anxiety 2005, 21:185-192.
28. Gorenstein C, Andrade L, Zanolo E, Artes R: Expression of depressive
symptoms in a nonclinical Brazilian adolescent sample. Can J Psychiatry
2005, 50:129-136.
29. Bonilla J, Bernal G, Santos A, Santos D: A revised Spanish version of the
Beck Depression Inventory: psychometric properties with a Puerto Rican
sample of college students. J Clin Psychol 2004, 60:119-130.
30. Hayden MJ, Dixon JB, Dixon ME, O’Brien PE: Confirmatory Factor Analysis
of the Beck Depression Inventory in Obese Individuals Seeking Surgery.
Obes Surg 2009, Epub Sep18.
31. Vanheule S, Desmet M, Groenvynck H, Rosseel Y, Fontaine J: The factor
structure of the Beck Depression Inventory-II: an evaluation. Assessment
2008,
15:177-87.
32. Dunkel D, Froehlich S, Antretter E, Haring C: Replication of a two-factor
model of the Beck Depression Inventory in alcohol dependents and
suicide attempters. Psychopathology 2002, 35:228-33.
33. Buckley TC, Parker JD, Heggie J: A psychometric evaluation of the BDI-II in
treatment-seeking substance abusers. J Substance Abuse Treat 2001,
20:197-204.
34. Tashakkori A, Barefoot J, Mehryar AH: What does the Beck Depression
Inventory measure in college students? Evidence from a non-western
culture. J Clin Psychol 1989, 45:595-602.
35. Richter P, Werner J, Heerlein A, Kraus A, Sauer H: On the validity of the
Beck Depression Inventory: a review. Psychopathology 1998, 31:160-168.
36. Al-Musawi NM: Psychometric properties of the Beck Depression
Inventory-II with university students in Bahrain. J Personal Assessment
2001, 77:568-579.
37. Cook KF, Kallen MA, Amtmann D: Having a fit: impact of number of items
and distribution of data on traditional criteria for assessing IRT’s
unidimensionality assumption. Qual Life Res 2009, 18:447-460.
38. Siegert RJ, Walkey FH, Turner-Stokes L: An examination of the factor
structure of the Beck Depression Inventory-II in a neurorehabilitation
inpatient sample. J Int Neuropsychol Soc 2009, 15:142-147.
39. Arnarson TO, Olason DT, Smári J, Sigurethsson JF: The Beck Depression
Inventory Second Edition (BDI-II): psychometric properties in Icelandic
student and patient populations. Nord J Psychiatry 2008, 62:360-365.
40. Grothe KB, Dutton GR, Jones GN, Bodenlos J, Ancona M, Brantley PJ:
Validation of the Beck Depression Inventory-II in a low-income African
American sample of medical outpatients. Psychol Assess 2005, 17:110-114.
41. Novy DM, Nelson DV, Berry LA, Averill PM: What does the Beck Depression
Inventory measure in chronic pain?: a reappraisal. Pain 1995, 61:261-270.
42. Thombs BD, Ziegelstein RC, Beck CA, Pilote L: A general factor model for
the Beck Depression Inventory-II: validation in a sample of patients
hospitalized with acute myocardial infarction. J Psychosom Res 2008,
65:115-121.
43. Ward LC: Comparison of factor structure models for the Beck Depression
Inventory -II. Psychol Assess 2006, 18:81-88.
44. Patrick CJ, Hicks BM, Nichol PE, Krueger RF: A bifactor approach to
modeling the structure of the psychopathy checklist -revised. J Pers
Disord 2007, , 21: 118-141.
45. Holzinger K, Swineford F: The bi-factor method. Psychometrika
1937,
2:41-54.
46. Yang FM, Jones RN: Measurement differences in depression: chronic
health-related and socio-demographic effects in older Americans.
Psychosom Med 2008, 70:993-1004.
47. Chen FF, West SG, Sousa KH: A Comparison of Bifactor and Second-Order
Models of Quality of Life. Multivariate Behav Res 2006, 41:189-225.
48. Zinbarg RE, Barlow DH: Structure of anxiety and the anxiety disorders: a
hierarchical model. J Abnormal Psychol 1996, 105:181-193.
49. Watson D, O’Hara MW, Stuart S: Hierarchical structures of affect and
psychopathology and their implications for the classification of
emotional disorders. Depress Anxiety 2008, 25:282-288.
50. Derogatis LR, Lipman RS, Rickels K, Uhlenhuth EH, Covi L: The Hopkins
Symptom Checklist (HSCL): a self-report inventory. Behav Sci 1974,
19:1-15.
51. Hamdan A, Hawamdeh S, Hussein A: The prevalence and correlates of
depressive symptoms among Arab women in a primary health care
setting. Int J Psychiatry Med 2008, 38:453-67.
52. Al-Otaibi B, Al-Weqayyan A, Taher H, Sarkhou E, Gloom A, Aseeri F, Al-
Mousa E, Al-Zoubi H, Habeeba S: Depressive symptoms among Kuwaiti
population attending primary healthcare setting: prevalence and
influence of sociodemographic factors. Med Princ Pract 2007, 16:384-8.
Al-Turkait and Ohaeri BMC Psychiatry 2010, 10:60
/>Page 13 of 14
53. Arbuckle JL, Wothke W: AMOS 4.0 User’s Guide. SmallWaters, Corporation,
Chicago, IL 1999.
54. Hooper D, Coughlan J, Mullen MR: Structural Equation Modelling:
Guidelines for Determining Model Fit. Electronic J Business Res Methods
2008, 6:53-60.
55. West SG, Finch JF, Curran PJ: Structural equation models with non-normal
variables. Problems and remedies. In R. Hoyle (ed), Structural Equation
Modeling: concepts, issues and applications. Newbury Park, CA: Sage 1995,
56-75.
56. Crowley SL, Xitao F: Structural equation modeling: basic concepts and
applications in personality assessment research. J Person Assess 1997,
68:508-531.
57. Bech P: Applied psychometrics in clinical psychiatry: the
pharmacopsychometric triangle. Acta Psychiatr Scand 2009, 120:400-409.
58. Clark LA, Watson D: Tripartite model of anxiety and depression:
psychometric evidence and taxonomic implications. J Abnormal Psychol
1991, 100:316-336.
59. Reise SP, Morizot J, Hays RD: The role of the bifactor model in resolving
dimensionality issues in health outcome measures. Qual Life Res 2007,
16(suppl 1):19-31.
60. Toplak ME, Pitch A, Flora DB, Iwenofu L, Ghelani K, Jain U, Tannock R: The
unity and diversity of inattention and hyperactivity/impulsivity in ADHD:
evidence for a general factor with separable dimensions. J Abnormal
Child Psychol 2009, 37:1137-1150.
61. Al-Turkait FA, Ohaeri JU: Prevalence and correlates of posttraumatic stress
disorder among Kuwaiti military men according to level of involvement
in the First Gulf War. Depress Anxiety 2008, 25:932-941.
62. Al-Turkait FA, Ohaeri JU: Posttraumatic stress disorder among wives of
Kuwaiti veterans of the First Gulf War. J Anxiety Disord 2008, 22:18-31.
63. Al-Turkait FA, Ohaeri JU: Psychopathological status, behavior problems,
and family adjustment of Kuwaiti children whose fathers were involved
in the first gulf war. Child Adolesc Psychiatry Ment Health 2008, 2(1):12.
64. Tanios CY, Abou-Saleh MT, Karam AN, Salamoun MM, Mneimneh ZN,
Karam EG: The epidemiology of anxiety disorders in the Arab world: a
review. J Anxiety Disord 2009, 23:409-419.
65. Brown TA, Chorpita BF, Barlow DH: Structural relationships among
dimensions of the DSM-IV anxiety and mood disorders and dimensions
of negative affect, positive affect and autonomic arousal. J Abnormal
Psychol 1998, 107:179-192.
66. Eid M, Lischetzke T, Nussbeck F, Trierweiler L: Separating trait effects from
trait-specific method effects in multi-trait-multimethod models: A
multiple indicator CT-C(M-1) model. Psychol Methods 2003, 8
:38-60.
67. Krueger RF, Piasecki TM: Toward a dimensional and psychometrically-
informed approach to conceptualizing psychopathology. Behav Res Ther
2002, 40:485-499.
68. Krueger RF, Markon KE, Patrick CJ, Benning SD, Kramer MD: Linking
Antisocial Behavior, Substance Use, and Personality: An integrative
quantitative model of the adult externalizing spectrum. J Abnorm Psychol
2007, 116:645-666.
Pre-publication history
The pre-publication history for this paper can be accessed here:
/>doi:10.1186/1471-244X-10-60
Cite this article as: Al-Turkait and Ohaeri: Dimensional and hierarchical
models of depression using the Beck Depression Inventory-II in an Arab
college student sample. BMC Psychiatry 2010 10:60.
Submit your next manuscript to BioMed Central
and take full advantage of:
• Convenient online submission
• Thorough peer review
• No space constraints or color figure charges
• Immediate publication on acceptance
• Inclusion in PubMed, CAS, Scopus and Google Scholar
• Research which is freely available for redistribution
Submit your manuscript at
www.biomedcentral.com/submit
Al-Turkait and Ohaeri BMC Psychiatry 2010, 10:60
/>Page 14 of 14