Báo cáo y học: " The potential role of appetite in predicting weight changes during treatment with olanzapine" ppt
Bạn đang xem bản rút gọn của tài liệu. Xem và tải ngay bản đầy đủ của tài liệu tại đây (683.36 KB, 9 trang )
RESEARC H ARTIC LE Open Access
The potential role of appetite in predicting
weight changes during treatment with
olanzapine
Michael Case
1*
, Tamas Treuer
2
, Jamie Karagianis
3
, Vicki Poole Hoffmann
1
Abstract
Background: Clinically significant weight gain has been reported during treatment with atypical antipsychotics. It
has been suggested that weight changes in patients treated with olanzapine may be associated with increased
appetite.
Methods: Data were used from adult patients for whom both appetite and weight data were available from 4
prospective, 12- to 24-week clinical trials. Patients’ appetites were assessed with Eating Behavior Assessment (EBA,
Study 1), Platypus Appetite Rating Scale (PARS, Study 2), Eating Inventory (EI, Study 3), Food Craving Inventory (FCI,
Study 3), and Eating Attitude Scale (EAS, Study 4).
Results: In Studies 1 (EBA) and 4 (EAS), patients who reported overall score increases on appetite scales, indicating
an increase in appetite, experienced the greatest overall weight gains. However, in Studies 2 (PARS) and 3 (EI, FCI),
patients who reported overall score increases on appetite scales did not experience greater weight changes than
patients not reporting score increases. Early weight changes (2-4 weeks) were more positively correlated with
overall weight changes than early or overall score changes on any utilized appetite assessment scale. No additional
information was gained by adding early appetite change to early weight change in correlation to overall weight
change.
Conclusions: Early weight changes may be a more useful predictor for long-term weight changes than early score
changes on appetite assessment scales.
Clinical Trials Registration: This report represents secondary analyses of 4 clinical studies. Studies 1, 2, and 3 were
registered at under NCT00190749, NCT00303602, and NCT00 401973, respectively.
Study 4 predates the registration requirements for observational studies that are not classified as category 1
observational studies.
Background
Treatment with atypical antipsychotics has been tem-
porally associated with weight gain. Hypotheses about
the potential mechanism have included direct effects of
the known receptor affinities of each compound [1,2],
effects o n gastric and intestinal hormones [3], direct or
indirect effects on the feeding and satiety centers in
the brain [4], disturbance of the hypothalamus-pitui-
tary-adrenal (HPA) axis [5], d irect effect on insulin
sensitivity [6], decrease in physical activity, and
decrease in metabolic rate [7].
The extent of weight change and changes in metabolic
parameters during treatment with antipsychotics varies
between drugs. These variations may be due to differences
in receptor pharmac ology [8]. Kroeze et al. demonstrated
that affinity to the histamine H1 receptor predicts weight
gain associated with typical and atypical antipsychotics [9].
Olanzapine and clozapine both have high affinities for the
5-HT2C and the histamine H1 recepto rs, while antagon-
ism of peripheral M3 muscarinic receptor and effects on
central 5-HT2C may potentially be related to treatment-
emergent diabetes observed independent of obesity.
* Correspondence:
1
Lilly USA, LLC, Indianapolis, IN, USA
Full list of author information is available at the end of the article
Case et al. BMC Psychiatry 2010, 10:72
/>© 2010 Case et al; licensee BioMed Central Ltd. This is an Open Access article distributed under the te rms of the Creative Commons
Attribution License ( which permits unrestricted use, distribution, and reproduction in
any medium, provided the original work is properly cited.
While potential m echanisms for weight gain have
been widely studied, the ro le of changes in appetite
remains poorly understood. It is well known that
executive functions are necessary to successfully man-
age eating behavior, and their impairment and dis-
turbed weight regulation are often observed in patients
with schizophrenia treated with antipsychotics. A
recent pilot study showed that a delay of gratification
and executive performance in individuals with schizo-
phrenia may play a putative role for eating behavior
and body weight regulation [10]. Additionally, increas-
ing evidence suggests that general obesity is linked to
adverse neurocognitive outcomes. Altered cognitive
functions can independently affect the control of appe-
tite [11]. Treatment with both clozapine and olanza-
pine have been temporally associated with food craving
and binge eating [12,13].
Previous studies hav e observed that patients treated
with atypical antipsychotics are more reactive to exter-
nal eating cues as measured by the Three Factors Eating
Behavior Questionnaire and the Dutch Eating Behavior
Questionnaire [14]. Based on the observation of an asso-
ciation between weight gain and lack of cognitive
restraint in the presence of increased appetite, it has
been suggested that psychoeducational counseling in
conjunction with adjunctive pharmacotherapeutic agents
might l imit weight gain during antipsycho tic drug
therapy [15].
An understanding of the role of appetite changes in
weight gain during antipsychotic treatment would be
helpful to clinicians and patients, some of whom report
substantially increased appetite starting after their first
dose of an antipsychotic.
Changes in appetite might serve as early warning signs
of risk of weight gain as well as inform treatment deci-
sions. If specific changes in appetite can be expected,
patients can be informed in advance and may be better
able to manage them. Here we test the hypothes is that
changes in appetite might be indicative of a patient’ s
weight gain during treatment with olanzapine.
Methods
Presented are secondary analyses examining potential
associations between changes in appetite and weight
changes during treatment with olanzapine. The primary
study objectives have been reported elsewhere [16-19].
The study protocols were reviewed and approved by
individual institutional review boards prior to enrolling
any patien ts, and the analyses presented here are consis-
tent with the original ethics approval s. The studies were
consistent wi th Good Clinical Practices and all applic-
able regulatory requirements. All participants provided
written informed consent before receiving study therapy
or undergoing study procedures.
Study design
Included in the analyses were patients from 4 prospec-
tive, phase IV clinical trials examining the efficacy and
safety of olanzapine in adult (18 to 65 years old i n
Studies 1, 2, and 3, ≥18 years old in Study 4) male and
female patients diagnosed with schizophrenia, schizoaf-
fective disorder, related psychosis, or bipolar disorder.
In Study 1, p atients received double-blind oral olanza-
pine 5-20 mg once daily (QD) for 12 weeks [16]. In
Study 2, patients received double-blind oral olanzapine
5-20 mg QD for 16 weeks [18]. In Study 3, patients
received open-label oral olanzapine 5-20 mg QD for
22 weeks [19]. Study 4 was an observational study in
which patients received oral olanzapine at doses deter-
mined by the investigator as appropriate f or the indivi-
dual patient for 6 months (Table 1) [17]. Detailed
inclusion and exclusion criteria can be found in the
primary study reports [16-19].
Clinical assessment of appetite
Across all 4 studies, appet ite was assessed with 5 differ-
ent scales: Eating Behavior Assessment (EBA, a Lilly-
developed scale, assessing appetite and eating behavior
with 9 standardized questions, grading responses on a
scale from 0 to 4, where 0 = not at all and 4 = extre-
mely; not validated; Study 1); Platypus Appetite Rating
Scale (PARS, a Lilly-developed visual analog scale; not
validated; Study 2); Eating Inventory (EI, Study 3) [20];
Food Craving Inventory (FCI, Study 3) [21]; and Ea ting
Attitude Scale (EAS, a Lilly-developed scale, assessing
appetite and eating behavior during the past 4 weeks
with 10 standardized categories; not validated; Study 4)
(Table 1).
Statistical analysis
For each study, only patie nts for whom weight and
appetite data at baseline, at 2 weeks (Study 4, 4 weeks),
and at ≥1 later visit were available, were included in our
analyses. Patients were assigned to distinct groups based
on their overall and 2-week (Study 4, 4-week) appetite
scale item scores and total scores. Score increase was
defined as: po sitive value on EBA, >+5 units on PARS,
>+1 unit on EI, >+1 unit on FCI, or > 0 units on EAS.
No change in score was defined as: 0 unit s on EBA, ≥-5
to ≤+5 units on PARS, ≥-1 to ≤ +1 u ni t s on EI, ≥-1 to
≤+1 units on FCI, or 0 units on EAS. Score decre ase
was defined as: negative value on EBA, <-5 units on
PARS, <-1 unit on EI, <-1 unit on FCI, or <0 units o n
EAS. For each group, mean overall weight change and
mean appetite scale score changes were determined
using observed case analyses. Additionally, to test the
hypothesis of a l inear trend between appetite and
weight change s (i.e. greater increases in appetite are
associated with greater increases in weight), pair-wise
Case et al. BMC Psychiatry 2010, 10:72
/>Page 2 of 9
comparisons of mean weight changes i n the “decrease”
versus “ no change” and the “ no change” versus
“increase” appetite groups were conduct ed. If both of
these tests were significant and the magnit udes of the
changes followed the hypothesized pattern, a linear
trend would be suggested.
Additionally, several Pearson correlation coefficients
were assessed a nd tested for statistical significance: a)
between weight changes f rom baseline to endpoint and
score changes on appetite scales from baseline to
2 weeks (Study 4, 4 weeks); b) between weight changes
from baseline to endpoint and changes on appetite
scales from basel ine to endpo int; c) between baseline to
endpoint weight changes an d 2-week (Study 4, 4-week)
weight changes; and d) between overall weight change
and 2-week appetite scale changes, adjusted by 2-week
weight change (the correlation of appetite changes on
the residuals from the regression of endpoint weight
changes on 2-week weight changes).
Results
Patients
Baseline demographic data for all patients included in
our analyses are presented in Table 2. The distribution
of patient ethnicities was different across all 4 studies.
Study 1 included a majority of African American
patients, while Studies 2 and 3 included mainly white
patients, and the majority of patients in Study 4 self-
identified as East and Southeast Asians.
Weight changes
In all 4 studies, patients experienced statistically signifi-
cant (p <.05) mean weight increases from baseline to
endpoint (Study 1: 86.3 kg at baseline, 89.6 kg at end-
point; Study 2: 81.2 kg at baseline, 84.1 kg at endpoint;
Study 3: 85.4 kg at baseline, 90.8 kg at endpoint; Study
4: 64.1 kg at baseline, 68.3 kg at endpoint).
Appetite changes
An increase in patients’ appetite from baseline to endpoint
was observed in Study 1 (EBA item #1: 1.5 at baseline, 1.7
at endpoint, p = .21; EBA ite m #2: 1.6 at baseline, 1.6 at
endpoint, p = .72; EBA item #3: 1.1 at baseline, 1.2 at end-
point, p = .11; EBA item #4: 0.9 at baseline, 1.1 at end-
point, p = .22; EBA item #5: 2.5 at baseline, 2.5 at
endpoint, p = .35; EBA item #6: 0.9 at baseline, 1.1 at end-
point, p = .42; EBA item #7: 0.9 at baseline, 1.0 at end-
point, p = .32; EBA item #8: 0.4 at baseline, 0.6 at
endpoint, p = .36; EBA item #9: 0.1 at baseline, 0.3 at end-
point, p = .12), while in Studies 2, 3, and 4, patients’ appe-
tites decreased in the course of the trials (Study 2 - PARS:
65.7 at baseline, 58.9 at endpoint, p = .04; Study 3 - EI
cognitive restraint: 7.6 at baseline, 11.3 at endpoint, p =
.09, EI disinhibition: 8.7 at baseline, 5.4 at endpoint, p =
.16, EI hunger: 7.9 at baseline, 4.8 at endpoint, p = .17, FCI
total: 65.4 at baseline, 61.5 at endpoint, p <.0001; Study 4 -
EAS 1: 1.6 at baseline, 1.4 at endpoint, p <.0001, EAS 2:
1.6 at baseline, 1.4 at endpoint, p <.0001, EAS 5: 2.3 at
baseline, 2.1 at endpoint, p <.0001, EAS 6: 1.3 at baseline,
1.1 at endpoint, p <.0001, EAS 7: 1.2 at baseline, 1.1 at
endpoint, p <.0001, EAS 8: 0.7 at baseline, 0.5 at endpoint,
p = .85, EAS 9: 0.6 at baseline, 0.5 at endpoint, p = .48).
Associations between appetite scale score changes and
weight changes
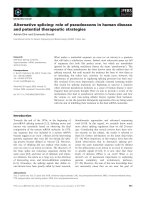
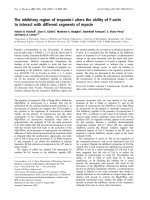
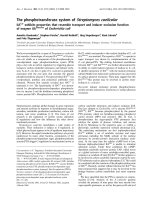
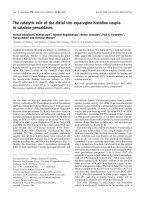
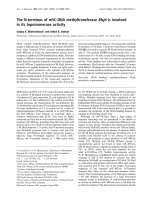
In Studies 1 (EBA) and 4 (EAS), score increases on single
appetite assessment scale items, both at 2 or 4 weeks and
at last measurement, indicating an increase in appetite,
occurred in patients who experienced the greatest overall
weigh t gains (Figures 1a+b, 2a+b). However, in Studies 2
(PARS) and 3 (EI, FCI), patients who reported score
increases on appetite scales items at 2 weeks and/or at last
measurement did not co nsistently experience greater
weight changes than patients reporting no score changes
or score decreases. The only individual appetite scale item
Table 1 Summary of Study Designs
Study 1 Study 2 Study 3 Study 4
Patient age (years) 18 to 65 18 to 65 18 to 65 ≥18
Study design Double-blind Double-blind Open-label Observational
Olanzapine dose (mg) 5 to 20 mg QD 5 to 20 mg QD 5 to 20 mg QD Determined by the
investigator
Adjunctive
pharmacotherpay
no no no or
Amantadine 100 mg BID or
Metformin 500 mg BID
no
Appetite assessment
scale
Eating Behavior
Assessment
Platypus Appetite Rating
Scale
Eating Inventory and Food Craving
Inventory
Eating Attitude Scale
Dietary counseling yes no yes no
Study length (weeks) 12 16 22 24
Abbreviations: BID = twice daily; QD = once daily.
Case et al. BMC Psychiatry 2010, 10:72
/>Page 3 of 9
that was correlated with later weight increase was an
increase in the appetite for fattyfastfoodat2weeksin
patients in Study 3 who showed the greatest overall weight
change. Analysis of overall total score changes on appetite
scales for Studies 1, 2, and 3 (no total score available for
Study 4) showed that patients who experienced a decrease
in total scores in appetite assessment scales had the lowest
weight gains (≤1.6 kg).
Statistically significant differences in the pair-wise com-
parisons among patient groups with distinct appetite rat-
ing scale scores were observed in Studies 1 (Figures 1a
and 1b) and 4 (Figures 2a and 2b), where the “increase”
appetite group showed significantly greater weight
change than the “no change” appetite group on specific
EBA and EAS items. However, the “decrease” appetite
groups did not show significantly less weight change than
the “no change” appetite groups on these same items.
Correlation coefficients between appetite scale score
changes and weight changes
In all 4 studies, early weight changes (2-4 weeks) had
stronger correlations to overall weight changes than
both overall and early (2-4 weeks) changes on any appe-
tite scale examined (Table 3). Adjustment of early appe-
tite scale changes by early weight changes demonstra ted
that early appetite scale assessments in conjunction with
early weight changes do not provide additional informa-
tion for predicting overall weight changes.
Discussion
Our analyses demonstrate an inconsistent association
between changes in appetite and weight change during
treatment with olanzapine; results varied depending on
study and appetite assessment scale used. Overall, early
weight ch anges may be a more useful predictor of long-
term weight changes compared with early score changes
on appetite assessment scales. To our knowledge, this is
the first study exploring a potential correlation between
changes in appetite and weight changes during treat-
ment with olanzapine.
Our observation that early weight changes correlate
strongly with long -term weight changes is in agreement
with earlier findings [22]. The absence of a consistent
correlation between changes in appetite and weight
Table 2 Baseline Demographics and Clinical Characteristics
Parameter Study 1 (N = 68) Study 2 (N = 65) Study 3 (N = 50) Study 4 (N = 622)
Age (years), mean (SD) 43.5 (9.5) 38.7 (12.2) 38.5 (12.0) 35.6 (12.2)
Male gender, n (%) 45 (66.2) 33 (50.8) 120 (60.3) 269 (43.2)
Ethnicity, n (%)
White 27 (39.7) 36 (55.4) 87 (43.7) 148 (23.8)
African American 34 (50.0) 4 (6.2) 16 (8.0) 0
East/Southeast Asian 1 (1.5) 1 (1.5) 39 (19.6) 369 (59.3)
Native American 0 0 0 0
Hispanic 4 (5.9) 23 (35.4) 52 (26.1) 83 (13.3)
West Asian 0 0 4 (2.0) 1 (0.2)
Other 2 (2.9) 1 (1.5) 0 0
Native American/First Nation 0 0 1 (0.5) 0
Missing 0 0 0 21 (3.4)
Weight (kg), mean (SD) 86.3 (16.8) 81.2 (17.0) 77.5 (16.6) 64.1 (12.5)
BMI, mean (SD) 28.7 (5.1) 28.3 (4.8) 27.1 (4.7) 23.2 (3.9)
Appetite, mean (SD) EBA Item #1: 1.5 (1.1)
a
PARS: 65.7 (19.2) EI-Cognitive Restraint: 7.6 (5.2)
b
EAS 1: 1.6 (1.2)
c
EBA Item #2: 1.6 (1.1)
a
EI-Disinhibition: 8.7 (4.6)
b
EAS 2: 1.6 (1.1)
c
EBA Item #3: 1.1 (1.2)
a
EI-Hunger: 7.9 (4.5)
b
EAS 5: 2.3 (1.2)
d
EBA Item #4: 0.9 (1.1)
a
FCI Total: 65.4 (20.1) EAS 6: 1.3 (1.2)
f
EBA Item #5: 2.5 (1.0)
a
EAS 7: 1.2 (1.2)
f
EBA Item #6: 0.9 (1.2)
a
EAS 8: 0.7 (0.9)
f
EBA Item #7: 0.9 (1.2)
a
EAS 9: 0.6 (0.9)
f
EBA Item #8: 0.4 (0.9)
a
EBA Item #9: 0.1 (0.3)
a
Abbreviations: BMI = Body Mass Index; EAS = Eating Attitude Scale; EAS 1 = More hungry than usual; EAS 2 = Stronger appetite than usual; EAS 5 = Felt comfortably
full when meal was finished; EAS 6 = It took an excessive amount of food to feel full; EAS 7 = Thoughts were preoccupied with food; EAS 8 = Ate until
uncomfortably full; EAS 9 = Could not stop eating; EB = Eating Behavior Assessment; EI = Eating Inventory; FCI = Food Craving Inventory; kg = kilograms;
N = number of patients in study included in the current analyses; n = number of patients affected; PARS = Platypus Appetite Rating Scale; SD = standard deviation;
a
n = 68;
b
only assessed in patients in the United States, n = 17;
c
n = 606;
d
n = 602;
e
n = 604;
f
n = 605.
Case et al. BMC Psychiatry 2010, 10:72
/>Page 4 of 9
changes was an unexpected finding, as one would expect
that changes in appetite will result in changes in eating
habits and consequently changes in weight. We cannot
exclude the possibility that the appetite assessment
scales might not have accurately measured appetite in
our patient population. However, weight increase during
treatment with olanzapine might n ot be associated with
increased appetite. In experiments with female rats,
hyperphagia and sedation were observed to occur con-
comitantly during exposure to olanzapine, two behaviors
that interact competitively without necessarily increasing
appetite [15,23]. How ever, earlier studie s with sulpiride
showed that there is no weight gain in female rats in
the absence of hyperphagia [24]. Another reason for the
inconsistency of our observations might be the possibi-
lity that weight gain during treatment with olanzapine
may be associated with several biochemical mechanisms,
which might manifest in a variety of clinical conditions
accompanying weight gain [25].
The observed variations in associations between changes
on appetite assessment scales and weight changes might
also be due to inherent differences between the scales that
were utilized and differences among the study populations.
Onesuchdifferenceamongstudypopulationsmightbe
the extent of clinical improvement during therapy. While
our analysis is limited by the lack of a subanalysis of clini-
cal improvement versus appetite, it has been observed pre-
viously that clinical improvement of ps ychotic symptoms
in patients with schizophrenia seems to coincide with
increased food intake [26]. Interestingly, EBA and EAS,
which showed within the examined assessment scales the
greatest similarities with one another with regard to items
included, were also most similar in their assessment
results. EBA and EAS were the only appetite scales for
Figure 1 Study 1 – A) Relationship of overall EBA item score changes and overall weight changes. B) Relationship of 2-week EBA item
score changes and overall weight changes. Abbreviations: EBA = Eating Behavior Assessment; kg = kilogram.
Case et al. BMC Psychiatry 2010, 10:72
/>Page 5 of 9
which pati ents with a score increase indic ating increased
appetite consistently showed the greatest overall weight
gains compared with patients with no score increase.
Additionally, score increases of several EBA and EAS
items that might indicate binge eating showed strong cor-
relations with weight gain.
All correlation analyses were repeated using a 7%
increase in weight (clinically significant weight gain) as
cutoff point. The results from those analyses were in
agreement with the presented data from analyses exam-
ining correlations between change in weight and change
in appetite assessment scale scores.
Our analyses were limited by the differences in study
design across the 4 studies that were utilized: differ ences
included study length, numbers and geographic locatio ns
of participating sites (resulting in differe nt patient ethni-
cities), previous antipsychotic exposure, timing of appe-
tite assessment, co-treatment of some patients in Study 3
with amantadine or metformin, and blinding procedures.
Additionally, in Studies 1 and 3 patients received dietary
counseling to control potential weight gain, while
patients did not receive dietary counseling in Studies 2
and 4. Interestingly, the strongest correlations between
change in appetite and change in weight were observed
in Study 1, which was also the shortest study included in
the current analyses and the only study in which
increased appetite was observed (12 weeks versus 16 to
24 weeks for Studies 2, 3, and 4). In Study 2, patients had
Figure 2 Study 4 –- A) Relationship of overall EAS item score changes and overall weight changes. B) Relationship of 4-week EAS item
score changes and overall weight changes. Abbreviations: EAS = Eating Assessment Scale; kg = kilogram.
Case et al. BMC Psychiatry 2010, 10:72
/>Page 6 of 9
to have already gained at least 5 kg or 1 unit of body
mass index (BMI) before rando mization; therefore, most
appetite increase probably occurred before the study
started, especially when considering that all patients had
been receiving olanzapine for 6 to 54 weeks before the 2-
week appetite assessment occurred. Consequently, com-
parisons betwee n Study 2 and Studies 1, 3, and 4 have to
be approached very carefully. For all studies analyzed
here, it is possible that appetite assessments might not
have been administered early enough in the course of
treatment to capture meaningful changes; our earliest
measurements are at 2 weeks, but changes in appetite
might have occurred as early as Day 1 of treatme nt, and
by 2 weeks weight changes we re as informative as appe-
tite changes. Additionally, the use of different appetite
assessment scales limits comparisons across studies and
most of the appetite scales used here have not been vali-
dated. Within each study, appetite assessment scales
Table 3 Weight Changes and Appetite Scale Score Changes
Overall Change
a
2- or 4-Week Change
b
2- or 4-Week Change - Adjusted
c
Study 1 - Eating Behavior Assessment
How hungry? .304* (n = 59) .058 (n = 59) 050 (n = 59)
Appetite? .282* (n = 59) .157 (n = 59) .097 (n = 59)
Craved sweets? .444*** (n = 59) .336** (n = 59) .238 (n = 59)
Craved fatty? .356** (n = 59) .243 (n = 59) .229 (n = 59)
Felt full? 062 (n = 59) .048 (n = 59) .039 (n = 59)
Ate excessive amount? .277* (n = 59) .240 (n = 59) .117 (n = 59)
Thinking of food? .427*** (n = 59) .164 (n = 59) .129 (n = 59)
Overeating? .482*** (n = 59) .345** (n = 59) .209 (n = 59)
Out of control eating? .493*** (n = 59) .299* (n = 59) .154 (n = 59)
Study 1 – Weight 1 (n = 59) .533*** (n = 59) N/A
Study 2 – Platypus Appetite Rating Scale .141 (n = 65) .090 (n = 63) .101 (n = 63)
Study 2 – Weight 1 (n = 63) .502*** (n = 63) N/A
Study 3 – Eating Inventory
d
Cognitive Restraint 012 (n = 66) .044 (n = 66) .227 (n = 66)
Disinhibition .138 (n = 66) 089 (n = 66) 084 (n = 66)
Hunger 046 (n = 66) 196 (n = 66) 139 (n = 66)
Study 3 – Food Craving Inventory
Carbohydrates 063 (n = 188) 046 (n = 186) 061 (n = 186)
Fatty Fast Food .019 (n = 188) 037 (n = 188) 032 (n = 188)
High Fat .045 (n = 187) .001 (n = 186) 029 (n = 186)
Sweets 017 (n = 188) 030 (n = 187) 048 (n = 187)
Total .001 (n = 185) 024 (n = 184) 051 (n = 184)
Study 3 – Weight 1 (n = 189) .507*** (n = 189) N/A
Study 4 – Eating Attitude Scale
More hungry than usual .162*** (n = 611) .153*** (n = 605) .013 (n = 591)
Stronger appetite than usual .198*** (n = 611) .173*** (n = 605) .023 (n = 591)
Felt comfortably full when meal was finished 018 (n = 609) 025 (n = 600) 041 (n = 591)
It took an excessive amount of food to feel full .212*** (n = 610) .119** (n = 603) 029 (n = 591)
Thoughts were preoccupied with food .189*** (n = 609) .199*** (n = 604) .069 (n = 591)
Ate until uncomfortably full .105** (n = 610) .116** (n = 603) 001 (n = 591)
Could not stop eating .019 (n = 610) .106** (n = 603) .027 (n = 591)
Study 4 – Weight 1 (n = 608) .561*** (n = 608) N/A
a
Pearson Correlation Coefficients between overall weight chang e and overall appetite scale changes or overall weight change.
b
Pearson Correlation Coefficients between overall weight change and 2-week appetite scale changes or 2-week weight change; Study 4: Pearson Correlation
Coefficients between overall weight change and 4-week appetite scale changes or 4-week weight change.
c
partial Pearson Correlatio n Coefficients between overall weight change and 2-week appetite scale changes, adjusted by 2-week weight change (the correlation
of appetite changes on the residuals from the regression of endpoint weight changes on 2-week weight changes).
*p < .05; **p < .01; ***p < .001.
Case et al. BMC Psychiatry 2010, 10:72
/>Page 7 of 9
were administered repeatedly to all patients, which might
have desensitized the scales and resulted in a loss of
accuracy. Also, the analyses were not adjusted for base-
line psychopathology in the different patient g roups and
for dose of olanzapine. Finally, the cutoffs to define
patient groups that experienced appetite scale score
increases, no change, or decreases were based on clinical
experience, but without access to previous reports in the
literature to guide this decision. Future research is war-
ranted to further assess the validity of the chosen cutoffs.
Conclusion
In conclusion, no consistent correlation between
changes in appetite and weight changes could be
observed in our analysis. However, when it was present,
it was in the expected direction, and the trend was con-
sistently in the expected direction. Consequently, appe-
tite change should be considered in patient care, but
when regular weight monitoring is performed, appetite
does not add additional information predicting future
weight changes during treatment with olanzapine: early
weight ch ange may be a more useful predictor for lo ng-
term weight change. Patients who experience early
weight gain or are otherwise at risk for significant
weight gain during olanzapine treatment should receive
regular monitoring of weight and lifestyle educational
programs early in the course of illness and of treatment.
Acknowledgements
The authors thank Dr Alexandra Heinloth and Ms Caron Modeas, both of
i3Statprobe, for writing and editorial assistance.
Author details
1
Lilly USA, LLC, Indianapolis, IN, USA.
2
Eli Lilly & Company, Budapest,
Hungary, EU.
3
Eli Lilly Canada Inc., Toronto, Ontario, Canada and Memorial
University of Newfoundland, St. John’s, Newfoundland and Labrador,
Canada.
Authors’ contributions
MC was involved in the design of the study, performed the statistical
analyses, and revised the manuscript. TT and JK conducted the clinical
studies, were involved in study design, contributed to interpreting the
results in a clinical context, and revised the manuscript. VPH was involved in
study design and conduct of the clinical studies, in design of the current
analyses, contributed to interpreting the results in a clinical context, and
revised the manuscript. All authors read and approved the final manuscript.
Competing interests
This work was sponsored by Eli Lilly and Company and/or any of its
subsidiaries. Drs. Karagianis, Treuer, and Hoffmann and Mr. Case are full-time
employees and minor stockholders of Eli Lilly and Company and/or any of
its subsidiaries.
Received: 22 February 2010 Accepted: 14 September 2010
Published: 14 September 2010
References
1. Matsui-Sakata A, Ohtani H, Sawada Y: Receptor occupancy-based analysis
of the contributions of various receptors to antipsychotics-induced
weight gain and diabetes mellitus. Drug Metab Pharmacokinet 2005,
20:368-378.
2. Starrenburg FC, Bogers JP: How can antipsychotics cause Diabetes
Mellitus? Insights based on receptor-binding profiles, humoral factors
and transporter proteins. Eur Psychiatry 2009, 24:164-170.
3. Palik E, Birkas KD, Faludi G, Karadi I, Cseh K: Correlation of serum ghrelin
levels with body mass index and carbohydrate metabolism in patients
treated with atypical antipsychotics. Diabetes Res Clin Pract 2005, 68(Suppl
1):S60-S64.
4. Weston-Green K, Huang XF, Han M, Deng C: The effects of antipsychotics
on the density of cannabinoid receptors in the dorsal vagal complex of
rats: implications for olanzapine-induced weight gain. Int J
Neuropsychopharmacol 2008, 11:827-835.
5. Baptista T, Zarate J, Joober R, Colasante C, Beaulieu S, Paez X, Hernandez L:
Drug induced weight gain, an impediment to successful
pharmacotherapy: focus on antipsychotics. Curr Drug Targets 2004,
5:279-299.
6. Chintoh AF, Mann SW, Lam L, Lam C, Cohn TA, Fletcher PJ, Nobrega JN,
Giacca A, Remington G: Insulin resistance and decreased glucose-
stimulated insulin secretion after acute olanzapine administration. J Clin
Psychopharmacol 2008, 28:494-499.
7. Sharpe JK, Stedman TJ, Byrne NM, Wishart C, Hills AP: Energy expenditure
and physical activity in clozapine use: implications for weight
management. Aust N Z J Psychiatry 2006, 40:810-814.
8. Reynolds GP, Kirk SL: Metabolic side effects of antipsychotic drug
treatment - Pharmacological mechanisms. Pharmacol Ther 2009.
9. Kroeze WK, Hufeisen SJ, Popadak BA, Renock SM, Steinberg S, Ernsberger P,
Jayathilake K, Meltzer HY, Roth BL: H1-histamine receptor affinity predicts
short-term weight gain for typical and atypical antipsychotic drugs.
Neuropsychopharmacology 2003, 28:519-526.
10. Knolle-Veentjer S, Huth V, Ferstl R, Aldenhoff JB, Hinze-Selch D: Delay of
gratification and executive performance in individuals with
schizophrenia: putative role for eating behavior and body weight
regulation. J Psychiatr Res 2008, 42:98-105.
11. Cserjesi R, Luminet O, Poncelet AS, Lenard L: Altered executive function in
obesity. Exploration of the role of affective states on cognitive abilities.
Appetite 2009, 52:535-539.
12. Kluge M, Schuld A, Himmerich H, Dalal M, Schacht A, Wehmeier PM, Hinze-
Selch D, Kraus T, Dittmann RW, Pollmacher T: Clozapine and olanzapine
are associated with food craving and binge eating: results from a
randomized double-blind study. J Clin Psychopharmacol 2007, 27:662-666.
13. Theisen FM, Linden A, Konig IR, Martin M, Remschmidt H, Hebebrand J:
Spectrum of binge eating symptomatology in patients treated with
clozapine and olanzapine. J Neural Transm 2003, 110:111-121.
14. Sentissi O, Viala A, Bourdel MC, Kaminski F, Bellisle F, Olie JP, Poirier MF:
Impact of antipsychotic treatments on the motivation to eat: preliminary
results in 153 schizophrenic patients. Int Clin Psychopharmacol 2009,
24:257-264.
15. Stauffer VL, Lipkovich I, Hoffmann VP, Heinloth AN, McGregor HS, Kinon BJ:
Predictors and correlates for weight changes in patients co-treated with
olanzapine and weight mitigating agents; a post-hoc analysis. BMC
Psychiatry 2009, 9:12.
16. Hardy T, Henry RR, Forrester TD, Kryzhanovskaya LA, Watson SB, Marks DM,
Mudaliar S: Insulin Sensitivity in Patients with Schizophrenia or
Schizoaffective Disorder Treated with Olanzapine or Risperidone
[abstract]. Presented at APA San Francisco 2007.
17. Treuer T, Hoffmann VP, Chen AK, Irimia V, Ocampo M, Wang G, Singh P,
Holt S: Factors associated with weight gain during olanzapine treatment
in patients with schizophrenia or bipolar disorder: results from a six-
month prospective, multinational, observational study. World J Biol
Psychiatry 2009, 10:729-740.
18. Karagianis J, Grossman L, Landry J, Reed VA, de Haan L, Maguire GA,
Hoffmann VP, Milev R: A randomized controlled trial of the effect of
sublingual orally disintegrating olanzapine versus oral olanzapine on
body mass index: the PLATYPUS Study. Schizophr Res 2009, 113:41-48.
19. Poole Hoffman V, Case M, Jacobson JG: Algorithms Including Amantadine,
Metformin and Zonisamide for Mitigation of Weight Gain During
Olanzapine Treatment in Outpatients with Schizophrenia [abstract].
Presented at APA San Francisco 2007 2009.
20. Stunkard AJ, Messick S: The three-factor eating questionnaire to measure
dietary restraint, disinhibition and hunger. J Psychosom Res 1985,
29:71-83.
Case et al. BMC Psychiatry 2010, 10:72
/>Page 8 of 9
21. White MA, Whisenhunt BL, Williamson DA, Greenway FL, Netemeyer RG:
Development and validation of the food-craving inventory. Obes Res
2002, 10:107-114.
22. Kinon BJ, Kaiser C J, Ahmed S, Rotelli MD, Kollack-Walker S: Association
between early and rapid weight gain and change in weight over one
year of olanzapine therapy in patients with schizophrenia and related
disorders. J Clin Psychopharmacol 2005, 25:255-258.
23. Cooper G, Goudie A, Halford J: Acute effects of olanzapine on
behavioural expression including the behavioural satiety sequence in
female rats. J Psychopharmacol 2009.
24. Baptista T, Contreras Q, Teneud L, Albornoz MA, Acosta A, Paez X, de QM,
LaCruz A, Hernandez L: Mechanism of the neuroleptic-induced obesity in
female rats. Prog Neuropsychopharmacol Biol Psychiatry 1998, 22:187-198.
25. Karagianis J, Hoffmann VP, Arranz B, Treuer T, Maguire GA, de HL, Chawla B:
Orally disintegrating olanzapine and potential differences in treatment-
emergent weight gain. Hum Psychopharmacol 2008, 23:275-281.
26. Treuer T, Karagianis J, Hoffmann VP: Can increased food intake improve
psychosis? A brief review and hypothesis. Curr Mol Pharmacol 2008,
1:270-272.
Pre-publication history
The pre-publication history for this paper can be accessed here:
/>doi:10.1186/1471-244X-10-72
Cite this article as: Case et al.: The potential role of appetite in
predicting weight change s during treatment with olanzapine. BMC
Psychiatry 2010 10:72.
Submit your next manuscript to BioMed Central
and take full advantage of:
• Convenient online submission
• Thorough peer review
• No space constraints or color figure charges
• Immediate publication on acceptance
• Inclusion in PubMed, CAS, Scopus and Google Scholar
• Research which is freely available for redistribution
Submit your manuscript at
www.biomedcentral.com/submit
Case et al. BMC Psychiatry 2010, 10:72
/>Page 9 of 9