Báo cáo y học: " P300 amplitude is insensitive to working memory load in schizophrenia" potx
Bạn đang xem bản rút gọn của tài liệu. Xem và tải ngay bản đầy đủ của tài liệu tại đây (847.05 KB, 6 trang )
RESEARCH ARTICLE Open Access
P300 amplitude is insensitive to working memory
load in schizophrenia
Pablo A Gaspar
1,2*
, Sergio Ruiz
3,4,5
, Francisco Zamorano
5
, Marcela Altayó
5
, Carolina Pérez
5
, Conrado A Bosman
6
,
Francisco Aboitiz
5
Abstract
Background: Working memory (WM) tasks usually elicit a P300 ERP component, whose ampli tude decreases with
increasing WM load. So far, this effect has not been studied in schizophrenics (SZs), a group that is considered to
have an aberrant brain connectivity and impairments in WM capacity. The aim of this study was to determine the
dependency of the P300 component on WM load in a sample of SZ subjects.
Methods: We recorded 26 subjects (13 SZ patients and their matched controls) with an 80-channel
electroencephalogra m. Subjects performed an N-back task, a WM paradigm that manipulates the number of items
to be stored in memory.
Results: In healthy subjects, P300 amplitude was highest in the low WM load condition, and lowest in both the
attentional control condition and the high WM load condition. In contrast, SZs evidenced low P300 amplitude in
all conditions. A significant between group difference in P300 amplitude was evidenced only at the low WM load
condition (1 -back), being smaller in SZs.
Conclusions: SZ sub jects display a lower than normal P300 amplitude, which does not vary as a function of
memory load. These results are consistent with a general impairment in WM capacity in these patients.
Background
Working memory (WM) refers to a set of cognitive pro-
cesses that actively hold and manipulate information in
the brain for subsequent behavior in the short term [1].
Event Related Potential (ERP) waveforms have been pro-
posed to be markers of cognitive demands during the
execution of WM tasks in both normal [2] and schizo-
phrenic (SZ) subjects [3]. More specifically, the P 300
component is considered to reflect the activation of wide-
spread fronto-parietal networks, possibly including the
anterior cingulate cortex [4,5], involved in attentional
and mnemoni c processing resources. In normal subjects,
this potential has been observed to decrease its amplitude
with increasing memory load in WM tasks [6].
SZ is characterized by strong impairments in multiple
attentional and WM processes, which have been pro-
posed to be among t he core cognitive deficits in this
condition [7,8]. Verbal and spatial WM dysfunction s
have been consistently repo rted in first episode patients
as well as in groups of non-psychotic persons at familial
high risk to develop SZ [9,10]. Thus, the study of WM
mechanisms and their impairments in SZ might contri-
bute to unveil some of the underlying affected mechan-
isms in this disease. Specifically, our aim is to analyze
the pattern of activation, as seen in the P300 amplitude,
of the SZ brain as a function of increasing WM load.
Although alterations in P300 amplitude have been con-
sistently reported in SZ [11,12], to the best of our knowl-
edge there are no studies t hattesttheP300patternat
high WM load conditions in these patients. Herein, we
compared the behavioral performance and the elicited
P300 component under the execution of a verbal N-back
task at different WM loads (0-back to 2-back) in a sample
of paranoid SZ patients and matched controls.
Methods
Participants
Thirteen chronic SZ (paranoid type) outpatient s were
recruited from the mental health service of the Pontifi-
cia Universidad Católica de Chile. Two psychiatrists
* Correspondence:
1
Clínica Psiquiátrica Universitaria, Hospital Clínico de la Universidad de Chile,
Santiago, Chile
Full list of author information is available at the end of the article
Gaspar et al. BMC Psychiatry 2011, 11:29
/>© 2011 Gaspar et al; licensee BioMed Central Ltd. This is an Open Access article distributed under the terms of the Creative Commons
Attribution License ( which permits unrestricted use, distribution, an d reproduction in
any me dium, provided the original work is properly cited.
confirmed t he diagnosis of SZ (according to the DSM-
IV-TR clinical version). Patients were matched by sex,
age and socioeconomic status with 13 healthy subjects
(HS). All subjects in this study were right handed and
had normal or corrected -to-normal vision. Every subject
underwent a medical and a psychiatric interview, which
included the Mini international neuropsychiatry inter-
view 5.0 (M.I.N.I plus). Demographic data were recol-
lected and a local-validated structured socioeconomic
scale w as performed. A trained psychologist performed
an IQ scale (WAIS) to both patients and controls.
Severity assessment of SZ patients was determined with
the positive and negative syndrome scale (PANSS) for
SZ and the Clinical Global Impression Scale (CGI-S)
[13]. Exclusion criteria for this study were any current
or past psychiatric diagnosis ( excluding schizoaffective
disorder diagnosis in the SZ group), substance abuse/
dependence, the use of benzodiazepines or anticonvul-
sive drugs, mental retardation, a clinically significant
medical illness o r any history of neurological disease.
We also excluded any control with family rec ords of SZ,
psychosis o r bipolar disease. Table 1 shows all relevant
clinical and demographic data for patients and controls.
Clinical rate evaluation (PANSS and WAIS) was per-
formed no more than 1 month since the EEG recording.
This protocol was approved for the ethics committee
of the Pontificia Universidad Católica de Chile.Every
subject signed an informed consent. In case of SZ
patients, this consent was also signed by a well-informed
relative.
Task and stimulation procedures
WM was assessed using an implicit verbal N-back task
[6,14], in which subjects were presented a sequence of
digitnumbers,andhadtodeterminewhetherthecur-
rently displayed stimulus at any given time had been
already displayed in the previous presentation (1-back
condition, low WM load); or in the second-to-previous
presentation (2-back condition, high WM load) (see
figure 1). There was also a control condition (0-back), in
which the subject had to recognize a specific digit -zero-
when it appeared on the screen. Subjects had to distin-
guish between targets and non-targets, by pressing two
buttons localized in a response palette. Reaction times
were recorded afte r pressing the butt on. A trial was
defined by the presentation of one number followed by
the subject’s motor response. Trials were presented in 3
blocks; each block representing either the control (0-
back) or WM conditions (1- and 2- back). Each block
consisted in 180 trials with a 1:1 target/no target rela-
tion [6]. Stimuli consisted in a 0.2 sec. presentation of a
gray digit (size: 2.6 × 5.2 deg at 65 cm. from the face)
located in the center of a black background screen in a
21’ CRT monitor. Inter stimulus interval (ISI) were
Table 1 Socio-demographic variables
Variable Healthy
Controls
Schizophrenic
Patients
n = 13 n = 13
Age (y), mean (SD) 31.2 (12.1) 30.3 (10.6)
Sex, n (%) male 9 (69.2) 10 (76.9)
Symptom severity scale (PANSS)
(30-210), score (SD)
Negative scale - 20.8 (6.59)
Positive scale - 14.5 (4.84)
General psychopathology - 36.4 (12.1)
Total score - 71.7 (20)
Clinical rated CGI severity score
(CGI-s)
(1-7), score (SD) - 4 (6.4)
Socio economic scale, level,
n (%)
High 4 (30.8) 3 (23.1)
Medium 9 (69.2) 10 (76.9)
Low 0 0
Years of treatment
mean (SD) - 12.9 (11.4)
Chlorpromazine equivalent
doses mg/day - 419.2 (186.5)
Antipsychotic treatment n (%)
First generation - 12 (92.3)
Second generation - 1 (7)
Socio economic scale includes: education, employment status, family
economic status and graduate living conditions.
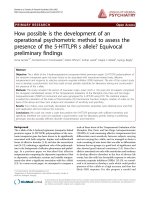
Figure 1 N-back task timeline. Trial time sequences for 0-, 1- and
2- back conditions. Black squares represent each stimulus in the
task. The symbol * shows the target number during each trial. Inter
stimulus interval (ISI): 1.7 sec. Stimulus presentation: 0.2 sec.
Gaspar et al. BMC Psychiatry 2011, 11:29
/>Page 2 of 6
1.7 sec in all the conditions studied. All the subjects
used the dominant hand to respond. Stimulus presenta-
tion was implemented using the STIM 1.0 software
(Compumedics-Neuroscan
®
).
Data acquisition
Continuous EEG signals were acquired using an 80-
channel electroencephalographic system (Neuroscan
®
EEG Nuamps device). Electrodes were placed using a
10/20 extended QuikCap system (Neuroscan
®
Inc).
References were placed at vertex by default, but were
subsequently off-line re-referenced to averaged mastoids.
Impedance values wer e kept at 5 KΩ for all electrodes.
We used thre e external flat e lectrodes to monitor eye
movements (two above and below the left eye and one
3 cms. next to the outer canthus of the right eye).
Recordings were sampled at 1000 Hz and band-pass fil-
tered between 0.1 and 100 Hz using an on-line amplifier.
Event Related Potential analyses
Trials with undesired eye movements and eye blink arti-
facts were eliminated from the analysis using a semi-
automatic and manual block rejection procedure. To
remove unwanted ERP components, such as the CNV
like co mponent evoked in this kind of task [15], we exe-
cuted an offline digital band-pass filter from 2 to 30 Hz
(zero phase shift filter). The continuous EEG was subse-
quently segmented between 500 ms. previous to the
appearance of a target stimulus to 800 ms. after stimu-
lus onset. However, the baseline used for the ERP analy-
sis was 200 ms. previous to the appearance of the target
stimuli. We included in our analysis only successful
trials (defined as match stimuli). I ndividual segments
were excluded if the absolute volt age of each channel
was higher than 80 μV. In each subject, successful,
artifact-free trials were averaged in each task (0 -1- and
2- back tasks) to obtain the corresponding ERP waves
[16].Subjectswithlessthan30epochstoaveragefor
each task were excluded. The number of trials (mean
and error rate) of each condition (0-, 1- and 2-back)
and group (HS and SZ) w ere: Control group: 0- back:
46.5 (4.2), 1- back: 47.3 (3.9), 2- back: 43.3 (4.5); SZ
group: 0- back: 50.5 (4.8), 1- back: 41.8 (4.5), 2- back:
38.6 (4.5). Finally, we calculated a group average over
the ERPs obtained across subjects for visualization pur-
poses. All these analyses were made using Scan 4.3
(Compumedics-Neuroscan
®
), Matlab 7.0 software (The
Mathworks Inc.) and the EEGLAB 4.5 toolbox.
Statistical analyses
The behavioral effects of WM load (0-, 1- and 2- back
tasks) and group (patients and controls) were statisti-
cally evaluated using a repeated measures analysis
(ANOVA general linear model). Hit rate (HR) was
defined as percentage of correct responses, while reac-
tion times (RTs) were definedasthefirstresponseof
the subject 200 ms. after the appearance of target sti-
mulus. Greenhouse-Geisser and Bonferroni methods
were used to correct compound symmetry violations in
the ANOVAs. Post Hoc analy sis and main-eff ect com-
parisons were adjusted using the Bonferroni correction.
Uncorrected DFs were reported for each F s tatistics.
Statistical analysis between conditions (0-, 1- and 2-
back) and groups (HS and SZ) was perf ormed using
non-parametric Mann-Whitney tests and confirmed by
cluster permutation procedure [17]. In the latter, the
cluster-level test statistics is defined by pooling the z
scores of neighboring electrodes showing the same
effect (pooled z scores >1.96) in a given time window
of interest. The type I erro r rate for the com plete set
of electrodes was managed by evaluating the cluster-
level test statistics under the randomization null distri-
bution of the maximum cluster-level statistics. This
was obtained by randomly permuting the data between
conditions and between groups. By creating a distribu-
tion from 100 random sets of permut ation, statistical
significance (p < 0.05) was estimated as the proportion
of elements in the randomization null distribution
exceeding the observed maximum-cluster level test
statistics.
Additionally, we performed an analysis of regions of
interest (ROI) by averaging fifteen neighboring electro-
des for each one [18]. The 5 resulting ROIs were labeled
as follows: central midline (CMROI), frontal right (FR-
ROI), frontal left (FL-ROI), parietal right (PR-ROI) and
parietal left (PL-ROI). Using these measures, two differ -
ent analyses were performed. First, we assessed whether
changes in P300 amplitude/latency r elated to WM load,
by comparing ERPs from low WM load (1-back) and
high WM load (2- back) conditions within each group
(SZ and HS). Second, to compare SZ group with con-
trols, we compared the averaged ERP values for each
condition between both groups. In addition, we sub-
tracted the high WM load condition from the low WM
condition to each subject, and resulting differences were
compared across groups.
Results
Behavioral responses
In each WM condition, HR percentages were more than
90% and 70% in control and SZ patients, respectively.
As expected, in both groups we found increments in
RTs and decrements of HRs due to the increase in WM
load. In the control group, only the RT differences
between 0- to 2- and 1- to 2- back tasks were signifi-
cant. In the SZ group differences were significant from
0- to 2- back in both HT and RT (figure 2). Between
groups, SZ patients made more errors and had longer
Gaspar et al. BMC Psychiatry 2011, 11:29
/>Page 3 of 6
reaction times than HS in each condition (figure 2).
These differences were significant in both 1-back and
2-back tasks, for HR [ F(2.1) = 16.7, p < .001] as well as
in the RT task [F(1.5) = 4.7, p = .028].
EEG data analyses
Within-group analyses: The control g roup showed a
significant decrease of P300 peak amplitude from 1- to
2-back (p = 0.018, Mann- Whitney test) and from 0- to
2- back condition (p = 0.023, Mann-Whitney test). On
the contrary, SZ patients did not show a significant dif-
ference in P300 peak amplitude among any condition
studied (from 0- to 1- back, p value = 0,56; 0- to 2-
bac k p value = 0,34; and 1- to 2- b ack p value = 0,086).
Besides, we did not find significant differences in P300
latency between 1- and 2- back tasks inside each group
(Table 2 and figure 3).
Between-group a nalyses: The mean P300 peak ampli-
tude was higher in the control group for every WM
conditio n, but this differ ence was significant only in the
1- back task (Mann-Whitney test, p = 0,019, see Table 2
and figure 3). The decrement in P300 amplitude
between 1- and 2- back was higher in the control group
(p = 0.023; Mann-Whitney test). Finally, there was no
difference of P300 latency in the SZ group compared
with controls (See Table 2 and figure 3).
Discussion
Consistent with previous results, behavioural perfor-
mance during the N-back task is better in HS compared
with SZ patients [19]. As expected, differences in hit
rate and reaction times between SZ patients and
controls became larger with higher WM demands. In
addition, our ERP findings are in general consistent with
previous proposals suggesting that a diminished P300
component represents a marker of cognitive dysfunction
in SZ, possibly representing an endophenotype of the ill-
ness [12,20]. As opposed to the control group, in SZ
subjects we failed to observe a decreased P300 pe ak
ampli tude from low (attentional) to high WM load con-
ditions ( See figures 2 and 4). Interestingly, the betwe en
group comparison of e ach condition studied (0-back,
1-back and 2-back) displayed a significant difference
only at the low WM load condition (1-back).
Functional neuroimaging [21,22] and electrophysiologi-
cal approaches [23] suggest that SZ patients show impor-
tant dysfunctions in the prefrontal cortex and in
widespread cortical networks [24], which is consistent
with our findings of a systematically reduced P300 in these
patients. The cognitive interpretation of the P300 has been
widely debated, and has different interpretations depend-
ing on the author and the specific cognitive t ask that is
assessed. Furthermore, it is likely that the P300 represents
a family of related potentials related to different aspects of
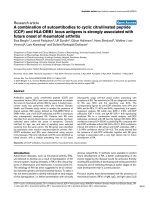
Figure 2 Task behavioral performance. Lines graph representing
Hit rate (upper panels, %+S.E.M.) and reaction time (lower panels,
ms +S.E.M.) for SZ patients (empty circle) and HS (filled circle) in all
the conditions (0-,1- and 2 back). * Symbol represent significant: p <
0.05; and ** represent p < 0.01.
Table 2 Statistical analysis of the P300 component in the CM- ROI
P300 amplitude (μV) P300 latency (ms.)
mean (SD) mean (SD)
Condition HS SZ Dif p value HS SZ Dif p value
0 back 3.17 (2.7) 2.80 (1.4) 1.37 0.189 320 (49.9) 331 (47.7) -11 0.170
1 back 3.29 (1.9) 1.43 (1.0) 1.85 0.019* 330 (29.0) 337 (41.3) -7 0.869
2 back 2.24 (1.4) 1.36 (0.9) 0.87 0.076 330 (42.7) 332 (40.7) -14 0.856
p value p value
1-2 back 0.023 0.086 0.87 0.84
Comparison of amplitude and latency measures among SZ group and HS. *p value < 0.05 (Mann-Whitney test).
Gaspar et al. BMC Psychiatry 2011, 11:29
/>Page 4 of 6
WM processing [5,25]. A current model states that this
potential reflects attentional capacity invested in the cate-
gorization of task relevant events [4] . More specifically,
this author proposes that the neural network underlying
the P300 participates in the comparison of the stimulus
attributes with a mental representation of the target, a
function that is dependent on attention, working memory
load, and task difficulty. The difficulty of our task may par-
tially account for the diminished P300 in our SZ subjects,
as they showed a lower hit rate than controls (70% vs.
90%, respectively). In addition, in these patients a reduced
P300 may also reflect either a deficit in WM or attentional
capacity, or an inability to correctly compare the received
sensory percept with the short-term memory representa-
tion that is active at the time.
We did no t find significant differ ences of P300 latency
between groups (HS and SZ). The observation of a pro-
longed latency in SZ patients is controversial. A few
studies have described a P300 latency prolongation in SZs
and their siblings, suggesting a slower stimulus processing
[26,27], but other reports failed to find this effect [20].
Fin ally, some limi tations should be considered for the
right interpretation of our results. Although our P300
amplitude measures were consistent among subjects, the
size of the sample in this study (n = 26) is rather small.
The absence of a) P300 latency alterations in our results
and b) a correlation between some psychopathological
measures (PANSS and CGI) and P300 amplitude might
be explained by the small size of subjects. Larger sam-
ples of patients will be needed to confirm the possible
contribution of these and other clinical factors (such as
sex or progression of the disease) in these results.
Conclusions
In this study, we observed differential patterns of P300 in
HS and SZ patients, a s a functi on of WM loa d. More
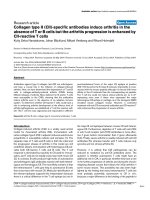
Figure 3 Grand averages and topographical distribution of the evoked P300 potentials elicited by 1- and 2- back tasks in the CM-ROI.
The third column represents the subtraction of the P300 amplitudes at 1- and 2- back conditions for HS and SZ group. The differences were
significant for controls (p <0.05), but not for SZ group (p > 0.05). Color bar indicates amplitude (uV).
Gaspar et al. BMC Psychiatry 2011, 11:29
/>Page 5 of 6
specifically, in the SZ sample there was a notorious invar-
iance of the P300 at different WM loads, which was not
different from that elicited by a primarily attentional task
(0-back). Our findings point to a general impairment of
attentional and WM capacity in these patients.
Acknowledgements
Funding for this study was provided by the millenium center for integrative
neuroscience and the millenium center for the neurobiology of memory.
Gaspar PA is supported by Clinical Hospital of University of Chile and
CONICYT bicentennial Becas - Chile. Special thanks to Diego Cosmelli and
Pablo Billeke for the critical revision of this manuscript; Claudia Andrade for
her constant support and fundación Senderos for their generous
contribution of patients. Finally, we are very grateful to the reviewers of this
work for providing helpful insights for both the organization of the
manuscript and its theoretical interpretations.
Author details
1
Clínica Psiquiátrica Universitaria, Hospital Clínico de la Universidad de Chile,
Santiago, Chile.
2
The Nathan S. Kline Institute for Psychiatric Research,
Orangeburg, New York, USA.
3
Institute of Medical Psychology and
Behavioural Neurobiology, Tübingen, Germany.
4
Graduate School of Neural
and Behavioural Sciences, International Max Planck Research School.
Tübigen, Germany.
5
Centro Interdisciplinario de Neurociencia, Departamento
de Psiquiatría, Escuela de Medicina, Pontificia Universidad Católica de Chile.
Santiago, Chile.
6
Donders Institute for Brain, Cognition and Behaviour, Centre
for Cognitive Neuroimaging. Radboud University Nijmegen, The Netherlands.
Authors’ contributions
PAG participated in the conception and design of the study, acquisition of
the data, analysis and interpretation of the results, and in drafting the
manuscript. SR participated in selection of the participants, acquisition of the
data, and in drafting the manuscript. FZ and CAB participated in the
acquisition of the data, analysis and interpretation of the results and drafting
the manuscript. MA and CP helped in the acquisition of the data and
selection of the participants. FA participated in the conception and design
of the study, interpretation of the results, and in drafting the manuscript.
All authors read, critically revised, and approved the final manuscript.
Competing interests
The authors declare that they do not have competing interests.
Received: 23 June 2010 Accepted: 15 February 2011
Published: 15 February 2011
References
1. Fuster JM: Unit activity in prefrontal cortex during delayed-response
performance: neuronal correlates of transient memory. J Neurophysiol
1973, 36:61-78.
2. Vogel EK, McCollough AW, Machizawa MG: Neural measures reveal
individual differences in controlling access to working memory. Nature
2005, 438:500-503.
3. Schmiedt C, Brand A, Hildebrandt H, Basar-Eroglu C: Event-related theta
oscillations during working memory tasks in patients with schizophrenia
and healthy controls. Brain Res Cogn Brain Res 2005, 25:936-947.
4. Kok A: On the utility of P3 amplitude as a measure of processing
capacity. Psychophysiology 2001, 38:557-577.
5. Linden DE: The p300: where in the brain is it produced and what does it
tell us? Neuroscientist 2005, 11:563-576.
6. Gevins A, Cutillo B: Spatiotemporal dynamics of component processes in
human working memory. Electroencephalogr Clin Neurophysiol 1993,
87:128-143.
7. Green MF: What are the functional consequences of neurocognitive
deficits in schizophrenia? Am J Psychiatry 1996, 153:321-330.
8. Goldman-Rakic PS: Working memory dysfunction in schizophrenia.
J Neuropsychiatry Clin Neurosci 1994, 6:348-357.
9. Conklin HM, Curtis CE, Calkins ME, Iacono WG: Working memory
functioning in schizophrenia patients and their first-degree relatives:
cognitive functioning shedding light on etiology. Neuropsychologia 2005,
43:930-942.
10. Heaton RK, Gladsjo JA, Palmer BW, Kuck J, Marcotte TD, Jeste DV: Stability
and course of neuropsychological deficits in schizophrenia. Arch Gen
Psychiatry 2001, 58:24-32.
11. Bramon E, McDonald C, Croft RJ, Landau S, Filbey F, Gruzelier JH, Sham PC,
Frangou S, Murray RM: Is the P300 wave an endophenotype for
schizophrenia? A meta-analysis and a family study. Neuroimage 2005,
27:960-968.
12. Jeon YW, Polich J: Meta-analysis of P300 and schizophrenia: patients,
paradigms, and practical implications. Psychophysiology 2003, 40:684-701.
13. Kay SR, Fiszbein A, Opler LA: The positive and negative syndrome scale
(PANSS) for schizophrenia. Schizophr Bull 1987, 13:261-276.
14. Gevins A, Smith ME: Neurophysiological measures of working memory
and individual differences in cognitive ability and cognitive style. Cereb
Cortex 2000, 10
:829-839.
15. McEvoy LK, Smith ME, Gevins A: Dynamic cortical networks of verbal and
spatial working memory: effects of memory load and task practice. Cereb
Cortex 1998, 8:563-574.
16. Hillyard SA, Kutas M: Electrophysiology of cognitive processing. Annu Rev
Psychol 1983, 34:33-61.
17. Maris E, Schoffelen JM, Fries P: Nonparametric statistical testing of
coherence differences. J Neurosci Methods 2007, 163:161-175.
18. Oken BS, Chiappa KH: Statistical issues concerning computerized analysis
of brainwave topography. Ann Neurol 1986, 19:493-497.
19. Krieger S, Lis S, Janik H, Cetin T, Gallhofer B, Meyer-Lindenberg A: Executive
function and cognitive subprocesses in first-episode, drug-naive
schizophrenia: an analysis of N-back performance. Am J Psychiatry 2005,
162:1206-1208.
20. Winterer G, Coppola R, Egan MF, Goldberg TE, Weinberger DR: Functional
and effective frontotemporal connectivity and genetic risk for
schizophrenia. Biol Psychiatry 2003, 54:1181-1192.
21. Perlstein WM, Dixit NK, Carter CS, Noll DC, Cohen JD: Prefrontal cortex
dysfunction mediates deficits in working memory and prepotent
responding in schizophrenia. Biol Psychiatry 2003, 53:25-38.
22. Tan HY, Choo WC, Fones CS, Chee MW: fMRI study of maintenance and
manipulation processes within working memory in first-episode
schizophrenia. Am J Psychiatry 2005, 162:1849-1858.
23. Molina V, Sanz J, Munoz F, Casado P, Hinojosa JA, Sarramea F, Martin-
Loeches M: Dorsolateral prefrontal cortex contribution to abnormalities
of the P300 component of the event-related potential in schizophrenia.
Psychiatry Res 2005, 140:17-26.
24. van den Heuvel MP, Mandl RC, Stam CJ, Kahn RS, Hulshoff Pol HE: Aberrant
frontal and temporal complex network structure in schizophrenia: a
graph theoretical analysis. J Neurosci 2010, 30:15915-15926.
25. Polich J: Updating P300: an integrative theory of P3a and P3b. Clin
Neurophysiol 2007, 118:2128-2148.
26. Mathalon DH, Ford JM, Rosenbloom M, Pfefferbaum A: P300 reduction and
prolongation with illness duration in schizophrenia. Biol Psychiatry 2000,
47:413-427.
27. Karoumi B, Laurent A, Rosenfeld F, Rochet T, Brunon AM, Dalery J,
d’Amato T, Saoud M: Alteration of event related potentials in siblings
discordant for schizophrenia. Schizophr Res 2000, 41:325-334.
Pre-publication history
The pre-publication history for this paper can be accessed here:
/>doi:10.1186/1471-244X-11-29
Cite this article as: Gaspar et al.: P300 amplitude is insensitive to
working memory load in schizophrenia. BMC Psychiatry 2011 11:29.
Gaspar et al. BMC Psychiatry 2011, 11:29
/>Page 6 of 6