Báo cáo y học: " Modifiable risk factors predicting major depressive disorder at four year follow-up: a decision tree approach" ppt
Bạn đang xem bản rút gọn của tài liệu. Xem và tải ngay bản đầy đủ của tài liệu tại đây (1.06 MB, 8 trang )
BioMed Central
Page 1 of 8
(page number not for citation purposes)
BMC Psychiatry
Open Access
Research article
Modifiable risk factors predicting major depressive disorder at four
year follow-up: a decision tree approach
Philip J Batterham*
1
, Helen Christensen
1
and Andrew J Mackinnon
2
Address:
1
Centre for Mental Health Research, The Australian National University, Canberra, Australia and
2
Orygen Research Centre, The University
of Melbourne, Melbourne, Australia
Email: Philip J Batterham* - ; Helen Christensen - ;
Andrew J Mackinnon -
* Corresponding author
Abstract
Background: Relative to physical health conditions such as cardiovascular disease, little is known
about risk factors that predict the prevalence of depression. The present study investigates the
expected effects of a reduction of these risks over time, using the decision tree method favoured
in assessing cardiovascular disease risk.
Methods: The PATH through Life cohort was used for the study, comprising 2,105 20-24 year
olds, 2,323 40-44 year olds and 2,177 60-64 year olds sampled from the community in the Canberra
region, Australia. A decision tree methodology was used to predict the presence of major
depressive disorder after four years of follow-up. The decision tree was compared with a logistic
regression analysis using ROC curves.
Results: The decision tree was found to distinguish and delineate a wide range of risk profiles.
Previous depressive symptoms were most highly predictive of depression after four years,
however, modifiable risk factors such as substance use and employment status played significant
roles in assessing the risk of depression. The decision tree was found to have better sensitivity and
specificity than a logistic regression using identical predictors.
Conclusion: The decision tree method was useful in assessing the risk of major depressive
disorder over four years. Application of the model to the development of a predictive tool for
tailored interventions is discussed.
Background
Depression is a leading cause of disease burden world-
wide [1,2], and is the leading risk factor for completed sui-
cide. It frequently leads to substance abuse and lowered
work productivity and is a risk factor for physical illnesses
such as cardiovascular disease [3]. Despite the disease bur-
den associated with depression, and its high personal and
financial costs, knowledge about prevention lags the evi-
dence base for treatment. Little is known about risk factors
which predict the incidence, recurrence and chronicity of
depression. Risk factor research has focused on specific
subgroups such as the elderly or adolescents, or has been
restricted to general practice (i.e., treated or help seeking)
samples [4,5]. The analysis of the expected effects of a
reduction of these risks over time is rarely investigated,
although a few papers which break this rule using longitu-
dinal data have begun recently to model risk reduction
[4,5].
Published: 22 November 2009
BMC Psychiatry 2009, 9:75 doi:10.1186/1471-244X-9-75
Received: 5 June 2009
Accepted: 22 November 2009
This article is available from: />© 2009 Batterham et al; licensee BioMed Central Ltd.
This is an Open Access article distributed under the terms of the Creative Commons Attribution License ( />),
which permits unrestricted use, distribution, and reproduction in any medium, provided the original work is properly cited.
BMC Psychiatry 2009, 9:75 />Page 2 of 8
(page number not for citation purposes)
Compare this situation with what is known about the pre-
vention of cardiovascular disease (CVD). In the CVD area,
there is considerable research aimed at predicting the inci-
dence rather than just the prevalence of cardiovascular
disease, with an accompanying emphasis on determining
individual risk profiles. A combination of risk factors,
including history, age, gender, diabetes, smoking, blood
pressure and cholesterol have been identified as absolute
risk factors [6]. Secondly, there is evidence from interven-
tion studies that reducing factors such as smoking, blood
pressure and lipids will reduce the risk of disease and
stroke. Using a decision tree approach, risk assessment
charts have been developed coupled with guidelines to
enable clinicians to predict risk for their patients [6], with
the estimate of risk usually covering a five year period.
These charts can then be linked to a computerised deci-
sion support system, and to Internet based tools designed
for clinicians and patients. From a clinical point of view,
it is possible to establish the likely treatment or interven-
tion benefit to be expected on the basis of intervention.
Such information can be tailored and personalised, and
may serve as a direct motivator for behavioural change in
patients. Given the relative progress towards prevention
made in CVD, and the lack of progress in mental health
field, there is clear need to extend the CVD approach to
risk estimation and reduction to the area of depression.
While the decision tree methodology has been widely
used to identify modifiable risk factors for CVD, the
approach has been rarely used in the mental health
domain. There have, however, been attempts to use deci-
sion tree methods to predict suicide attempts [7], levels of
neuroticism [8], quality of life [9], and late-life depression
[4,5]. Decision trees are a family of analytic techniques,
which include CHAID (Chi-square Automatic Interaction
Detector) and CART (Classification and Regression Trees).
They provide estimates of risk by partitioning the sample
on the basis of the best predictors of the outcome.
Using a large prospective narrow age cohort study, the
present paper has three aims: to establish which of many
candidate risk factors predict the continuation or emer-
gence of depression at a four year interval; to determine
individual risk profiles based on combination of modifia-
ble and non modifiable risk indicators, and, given that
risk factors vary across the lifespan [10], to determine risk
profiles across different age groups. To develop the risk
model, a range of risk indicators were identified which
have individually been found either to predict depression
at follow-up or to be associated with the prevalence of
depression in community studies. Relevant risk factors
shown in cohort studies to predict depression included in
this cohort study were initial depression levels [4,11], use
of alcohol [11,12], cannabis use [13-15], smoking
[16,17], life events [4,18,19], chronic illness [4], medical
illness [4,20], low level of education or low levels of mas-
tery [21], employment status or financial pressure
[22,23], religious service attendance [24,25], living alone
[5], age and gender [10]. Evidence from intervention trials
also point to the importance of physical activity in the
treatment of depression [26]. Additional health measures
such as body mass index have also been implicated as risk
factors for depression [27].
Methods
Participants
The PATH Through Life Project is a community survey
examining the health and well-being of people who are
20-24, 40-44, and 60-64 years of age [28]. Each cohort is
being followed up every four years over a total period of
20 years. Participants were sampled from the electoral
rolls for the city of Canberra, Australia, and in the neigh-
bouring town of Queanbeyan. Registration on the elec-
toral roll is compulsory for Australian citizens. Results
presented here concern the first two waves of interviews,
conducted in 1999-2002 and 2003-2006 (recruitment
was staggered by age group). At baseline, interviews were
completed with 7,485 participants: 2,404 in the 20-24
group, 2,530 in the 40-44 group and 2,551 in the 20-24
group. Participation rates of those who were found to be
in the appropriate age ranges were 58.6% for the 20-24 s,
64.6% for the 40-44 s and 58.3% for the 60-64 s.
Wave 2 interviews were completed four years later by
6,715 participants (89.7% follow-up rate): 2,139 (89.0%)
20-24 s, 2,354 (93.0%) 40-44 s and 2,222 (87.8%) 60-64
s. Participants missing the depression measurement at
Wave 2 (n = 76, 1.1%), missing the baseline Goldberg
depression score (n = 32, 0.5%) or missing education sta-
tus (n = 2, < 0.1%) were excluded from the analysis, leav-
ing a sample of 6,605. The sample included 2,105
(31.9%) participants in their 20 s, 2,323 (35.2%) in their
40 s and 2,177 (33.0%) in their 60 s, including 3,383
(51.2%) females overall.
Procedure
Participants were interviewed at a convenient location,
usually the participant's home or the Centre for Mental
Health Research at the Australian National University.
Most of the interview was self-completed on a palmtop or
laptop computer. However, testing by the interviewer was
required for the physical tests, some of the cognitive tests
and a cheek swab used for genetic testing. Approval for the
research was obtained from The Australian National Uni-
versity's Human Research Ethics Committee.
Measures
The outcome measure was presence or absence of major
depressive disorder (MDD) at the four-year follow-up.
The assessment of MDD was made using the Patient
BMC Psychiatry 2009, 9:75 />Page 3 of 8
(page number not for citation purposes)
Health Questionnaire (PHQ), a measure that has 73%
sensitivity and 93% specificity in detecting MDD [29].
Baseline modifiable risk indicators included: depressive
symptoms, tobacco use, alcohol use, marijuana use, Body
Mass Index, hypertension and physical activity. Depres-
sive symptoms were assessed using the Goldberg Depres-
sion Scale [30], which was categorized into four groups
for the analysis (0-1, 2-3, 4-6 and 7-9 symptoms). Based
on their response to the item, "Do you currently smoke?",
participants were categorized as current smokers or not. A
cut-off of eight points on the World Health Organization's
Alcohol Use Disorders Identification Test (AUDIT) [31]
was used to identify those participants who exhibited
harmful or hazardous levels of alcohol consumption.
Marijuana use in the past year was identified using a single
item, "Have you used marijuana in the past 12 months?"
Participants were classified as being overweight if their
body mass index (BMI) exceeded 25. Current hyperten-
sion was based on both blood pressure measurements
and a self-reported item, "Are you currently taking any
tablets for high blood pressure?" Low threshold criteria
were used to define hypertension, with cut-offs of systolic
blood pressure ≥140 mmHg or diastolic blood pressure
≥90 mmHg. Physical activity level was assessed by asking
participants how many hours they spent in an average
week engaged in mildly energetic, moderate energetic and
vigorous physical activity, with examples provided for
each level. Responses were categorized in two ways for
each level: zero vs. any weekly hours and <3 vs. ≥3 weekly
hours.
Background risk indicators measure at baseline included:
gender, age group, education, employment status, finan-
cial pressure, religious service attendance, self-rated health
and life events. Age group consisted of the three age
cohorts recruited to the study (20 s, 40 s and 60 s). Years
of education was classified into "less than high school" (<
13 years), "high school" (13-<15 years) and "greater than
high school" (≥15 years) based on responses to four ques-
tions regarding past and current educational attainment.
Employment status was categorized in the survey as
"Employed full-time", "Employed part-time, looking for
full-time work", "Employed part-time", "Unemployed,
looking for work", or "Not in the labour force". The part-
time employment categories were combined and the not
employed categories were combined, resulting in three
employment categories: full-time (FT), part-time (PT) and
not in the labour force (NILF). Participants were classified
as being under financial pressure if they responded "Yes,
often" or "Yes, sometimes" to the item, "Have you or your
family had to go without things you really needed in the
last year because you were short of money?" Participants
who attended religious services "once a month", "more
than once a month", "once a week" or "more than once a
week" were classified as religious attendees. General
health status was self-rated using a five-category item,
with responses combined into two categories: "excellent"/
"very good"/"good" and "fair"/"poor". Stressful life events
in the six months prior to the survey were assessed using
a list of 16 events, from which categories of "fewer than
two events" and "two or more events" were distinguished.
Analysis
Sample characteristics were tabulated, broken down by
presence or absence of major depressive disorder after
four years. The decision tree was constructed using the
treedisc macro in SAS v9.1.3. The treedisc macro chooses
each of the branches on the basis of the risk indicator with
the minimum p-value from the chi-square statistic of that
division. Branching stops when there are no risk indica-
tors with a p-value less than 0.1 for division. The mini-
mum sample size for each leaf (node) was specified as n =
50, and branching was limited to five levels. To examine
the effectiveness of the decision tree in predicting depres-
sion risk relative to conventional methods, the method
was compared to a logistic regression that used identical
risk indicators. Receiver operating characteristic (ROC)
curves for the decision tree and the logistic regression were
plotted to assess the performance of each approach with
the areas under the curve compared using the method of
DeLong, DeLong and Clarke-Pearson [32].
Results
Sample characteristics are presented in Table 1, showing
the prevalence of major depressive disorder broken down
by each of the risk indicators. The table shows that the risk
of depression after four years was significantly higher for
participants who were younger, smoked, used alcohol at a
harmful or hazardous level, used marijuana, did not par-
ticipate in moderate physical activity, rated their health
more poorly, had less education, were in less secure
employment or under financial pressure, or had experi-
enced more life events.
As expected, those who were depressed after four years
had initial depression symptom scores more than twice as
high as those who were not depressed.
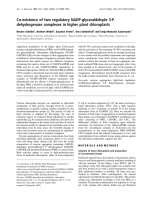
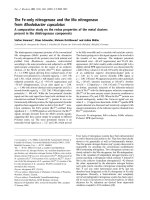
The decision tree resulting from the treedisc analysis is
shown in Figure 1. Initial depression symptoms were
most strongly associated with risk of depression. How-
ever, within symptom categories there was a large range of
risk profiles. For example, male smokers who were not
full-time employed and had only 2-3 symptoms were at a
17% risk of having major depressive disorder after four
years. This risk was less than 5% for those engaged in full-
time employment. Likewise, participants with 4-6 symp-
toms who were under financial pressure and used mari-
juana had an 18% risk of depression if they were using
BMC Psychiatry 2009, 9:75 />Page 4 of 8
(page number not for citation purposes)
Table 1: Descriptive statistics based on absence or presence of major depressive disorder at the four year follow-up of the PATH cohort
No major depressive disorder n = 6334 Major depressive disorder n = 271 Chi-square/F value p value
Goldberg depression: M
(SD)
2.17 (2.18) 5.08 (2.41) 461.8 < 0.001
Gender
Male 3097 (96.1%) 125 (3.9%) 0.8 0.372
Female 3237 (95.7%) 146 (4.3%)
Age group
20-24 1978 (94.0%) 127 (6.0%) 46.6 < 0.001
40-44 2221 (95.6%) 102 (4.4%)
60-64 2135 (98.1%) 42 (1.9%)
Current smoker
Yes 1167 (92.3%) 98 (7.7%) 52.8 < 0.001
No 5167 (96.8%) 173 (3.2%)
Harmful/hazardous alcohol
use
Yes 1182 (92.7%) 93 (7.3%) 40.7 < 0.001
No 5144 (96.7%) 178 (3.3%)
Marijuana user
Yes 818 (92.3%) 68 (7.7%) 33.2 < 0.001
No 5516 (96.5%) 203 (3.5%)
Do mild physical activity
Yes 3438 (96.4%) 130 (3.6%) 4.2 0.041
No 2743 (95.3%) 134 (4.7%)
Do moderate physical
activity
Yes 3700 (96.5%) 134 (3.5%) 8.5 0.004
No 2201 (95.0%) 116 (5.0%)
Do vigorous physical activity
Yes 2968 (96.1%) 122 (3.9%) 0.4 0.518
No 3207 (95.7%) 143 (4.3%)
3+ hours moderate physical
activity
Yes 1940 (96.1%) 78 (3.9%) 0.3 0.580
No 3961 (95.8%) 172 (4.2%)
Subjective health rating
Excellent 1303 (98.9%) 14 (1.1%) 183.6 < 0.001
Very good 2658 (97.2%) 76 (2.8%)
Good 1820 (94.8%) 99 (5.2%)
Fair 479 (88.1%) 65 (11.9%)
Poor 73 (81.1%) 17 (18.9%)
Hypertension
Yes 2442 (96.2%) 96 (3.8%) 0.3 0.587
No 3525 (95.9%) 149 (4.1%)
Overweight (BMI>25)
Yes 2839 (96.2%) 112 (3.8%) 1.8 0.179
No 3049 (95.5%) 143 (4.5%)
Education status
Less than high school 1165 (94.6%) 66 (5.4%) 30.9 < 0.001
High school graduate 2455 (94.8%) 135 (5.2%)
University graduate 2714 (97.5%) 70 (2.5%)
Employment status
Full-time 3212 (96.5%) 115 (3.5%) 9.3 0.010
Part-time 1436 (95.8%) 63 (4.2%)
Not in the work force 1686 (94.8%) 93 (5.2%)
Financial pressure
Yes 1184 (91.7%) 107 (8.3%) 71.4 < 0.001
No 5150 (96.9%) 164 (3.1%)
Life events
0 2452 (98.1%) 48 (1.9%) 85.6 < 0.001
1 1768 (96.7%) 61 (3.3%)
2 or more 2114 (92.9%) 162 (7.1%)
Religious service attendee
Yes 1249 (96.4%) 47 (3.6%) 0.9 0.335
No 5085 (95.8%) 224 (4.2%)
BMC Psychiatry 2009, 9:75 />Page 5 of 8
(page number not for citation purposes)
alcohol to a harmful/hazardous extent, while the risk was
less than 5% for those not using harmful/hazardous
amounts of alcohol. While those with 7-9 symptoms had
a 21% risk overall of having depression after four years,
the risk is as low as 7% for certain subgroups, such as
those who are in good physical health and employed.
Significantly, factors associated with depression risk were
different depending on the initial level of symptoms. Sub-
stance use particularly smoking and alcohol use appear
as predictors in all but the highest symptom level group.
Employment status, financial pressure and education also
feature prominently, particularly for those with higher
symptom levels. Life events, religious service attendance,
age group, weight and self-rated health also appear as pre-
dictors in the tree. However, physical activity and hyper-
tension did not distinguish between depression risk
groups and were omitted from the tree.
In order to examine the performance of the decision tree
approach in predicting depression risk, it was compared
to a conventional logistic regression model limited to
additive effects of each variable. The regression included
risk indicators that appeared once or more in the decision
tree, that is, Goldberg Depression Scale category, smoking
status, marijuana use, harmful/hazardous alcohol use, age
group, gender, employment status, financial pressure,
education level, life events, overweight, self-rated health
and religious service attendance. In the logistic regression,
Goldberg Depression symptom category (OR
0-1 vs. 2-3
=
2.8, = 9.1, p = .0025; OR
0-1 vs. 4-6
= 7.8, = 27.2, p <
.0001; OR
0-1 vs. 7-9
= 16.3, = 97.5, p < .0001), harmful/
hazardous alcohol use (OR = 1.6, = 6.8, p = .0090),
age group (OR
20 s vs. 60 s
= 2.3, = 4.3, p = .0378; OR
40 s
vs. 60 s
= 2.4, = 7.7, p = .0056), full-time employment
(OR
FTvs.NILF
= 2.1, = 8.3, p = .0040), financial pressure
(OR = 1.4, = 4.4, p = .0355), and poor/fair self-rated
χ
1
2
χ
1
2
χ
1
2
χ
1
2
χ
1
2
χ
1
2
χ
1
2
χ
1
2
Decision tree predicting the risk of major depressive disorder at the four year follow-up of the PATH cohortFigure 1
Decision tree predicting the risk of major depressive disorder at the four year follow-up of the PATH cohort.
BMC Psychiatry 2009, 9:75 />Page 6 of 8
(page number not for citation purposes)
health (OR = 1.9, = 14.3, p = .0002) were significantly
associated with major depressive disorder after four years.
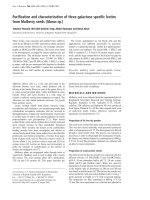
Figure 2 shows the ROC curves for the logistic regression
and the decision tree. The standard against which sensitiv-
ity and specificity were calculated for both curves was
major depressive disorder at wave 2 as diagnosed by the
PHQ. From the logistic regression, predicted probabilities
were output and used to create the curve. For the decision
tree, the risk at the endpoints of the tree (shaded leaves in
Figure 1) were used as the predicted probabilities for each
individual in that leaf. The areas under the curves were
0.850 for the decision tree and 0.828 for the logistic
regression. The area under the decision tree ROC curve
was significantly greater than the area under the logistic
regression ROC curve ( = 7.5, p = .006).
Discussion
Decision tree methodology successfully categorized par-
ticipants in the PATH cohort into a wide range of depres-
sion risk groups, distinguishing subgroups of participants
with virtually no risk through to groups with almost 40%
risk of having major depressive disorder four years after
their status on a raft of risk indicators was ascertained.
Both background and potentially modifiable risk indica-
tors were used to form categories. The importance of indi-
vidual risk indicators in predicting status at wave 2 was
dependent on previous level of symptoms. The decision
tree showed a modest overall performance but a usable
advantage in cut regions having clinical or preventive util-
ity. Furthermore, risk factors that may have been over-
looked by a logistic regression, such as gender, smoking
status and education status, were important predictors of
risk for certain subgroups of participants. While adding
higher-order interaction terms to the logistic regression
model may bring it closer to the decision tree model,
choosing which interactions to include is problematic,
requiring a selection strategy and leading to a decrease in
parsimony. The decision tree model provides a way to
identify important interactions and breaks down risk pro-
files into manageable categories with high clinical utility.
This method has been very effective for identifying CVD
risk and now shows promise in identifying mental health
risk. This paper further contributes by its focus on three
lifespan groups, its emphasis on determining the effects of
both modifiable risk factors and non-modifiable risk fac-
tors, and its aim to develop a tool to assist patients and
their clinicians to determine absolute risk. Unlike previ-
ous models of depression risk that studied only those with
late-life depression [4,5] this model is applicable across a
broad adult age range.
The present findings are consistent with the previous stud-
ies examining the determinants of depression risk in older
populations. Schoevers et al. [4] found that initial depres-
sion symptoms most strongly distinguished depression
risk, with illness and disability, living situation and
female gender also having an impact. Smits et al. [5]
found that anxiety symptoms, functional impairment,
chronic illness, low mastery, low education and having no
partner were the risk factors that best predicted depression
risk. These studies echo the finding of initial symptoms
being most strongly associated with the risk of depression.
However, among these elderly cohorts, health status and
living situation had a larger impact on depression risk
than was found in the present study. Substance use,
employment and life pressures were not examined in the
two studies of late-life depression, yet these factors con-
tributed strongly to predicting depression risk in the
present study.
The most highly predictive risk factor for future depres-
sion was the initial symptom score severity. While it may
appear circular to include participants with subclinical or
incident depression in the analysis, the modifiability of
depression symptoms through treatment is a vital way to
decrease the prevalence of major depressive episodes. The
findings support the need for increased access to treat-
ment through interventions that provide targeted preven-
tion programs and increased mental health literacy.
Furthermore, while sub-clinical symptom levels are a
χ
1
2
χ
1
2
Receiver Operating Characteristic curves for the decision tree and the logistic regression modelFigure 2
Receiver Operating Characteristic curves for the
decision tree and the logistic regression model.
BMC Psychiatry 2009, 9:75 />Page 7 of 8
(page number not for citation purposes)
powerful predictor of developing future caseness, the
present study indicates that there are subgroups with low
symptom levels that still have a markedly increased risk of
experiencing a future major depressive episode and sub-
groups with high symptoms levels with low risk of depres-
sion. Although a baseline measure of depression caseness
was not available for this cohort, future research could
examine whether there are differences in the predictors of
new versus existing cases of depression.
There are several limitations in applying the decision tree
method to treatment and prevention programs. Most
importantly, the causal relationships between depression
and risk behaviours, such as substance use, employment
status and physical health, may be bidirectional to some
extent. This limitation is mitigated by the longitudinal
nature of the present data, in that the depression outcome
was assessed four years after the initial measurements
were taken. Nevertheless, care must be taken in stating the
effects of making lifestyle or behavioural changes, such as
quitting smoking, reducing alcohol intake or finding full-
time employment. The outcome measure poses addi-
tional methodological limitations, specifically, a full clin-
ical interview could not be used due to resource
limitations, and depressive episodes that occurred within
the four years between measurement occasions may not
have been captured. These missed episodes may have led
to an underestimation of absolute risk. Further validation
of the model in other cohorts or specific populations will
enhance the applicability of using the model to predict
risk. Finally, this analysis was confined to a restricted set
of modifiable risk indicators for depression and variables
which might delimit sub-groups with differential risk pro-
files. There may be additional variables that would
improve the predictive accuracy of the model, including
psychological indicators such as personality, ruminative
style and mastery, however the present analysis was
intended to focus on factors that are more amenable to
modification.
Conclusion
The decision tree method was useful in assessing the risk
of major depressive disorder over four years. This method
has potential to be developed into a predictive tool for use
by both clinicians and patients. Such a tool would have
high clinical utility by providing customized feedback to
mental health consumers which focuses on personal
attributes which put them at risk and identifies possible
ways in which they might modify aspects of their lifestyle
to reduce their risk. It would highlight to clinicians the
importance of different combinations of characteristics
and the different roles of risk indicators for individuals in
different circumstances. Prevention or early intervention
programs may also be tailored based on the assessed level
of risk by focussing on the specific modifiable factors that
are driving that risk. Although predicting depression risk
appears to be more complex and multifaceted than pre-
dicting CVD risk, the decision tree methodology used for
CVD risk assessment provides a useful framework for
depression screening. While further validation is required
in other samples, there is much promise in developing
these models to guide future prevention and treatment
efforts aimed at reducing the prevalence of depression.
Competing interests
The authors declare that they have no competing interests.
Authors' contributions
PJB drafted the manuscript and performed the analysis;
HC revised the manuscript and contributed to the design
of the study; AJM contributed to the design of the study,
contributed to the analysis and revised the manuscript. All
authors read and approved the final manuscript.
Acknowledgements
Funding was provided by National Health and Medical Research Council
Program Grant 179805. Helen Christensen is funded by NHMRC Fellow-
ship 525411. Philip Batterham is supported by Capacity Building Grant in
Population Health Research 418020 from the National Health and Medical
Research Council. We gratefully acknowledge the men and women who
participated in this study, Patricia Jacomb, Karen Maxwell and PATH inter-
viewers for their assistance.
References
1. Lopez AD, Mathers CD, Ezzati M, Jamison DT, Murray CJ: Global
and regional burden of disease and risk factors, 2001: sys-
tematic analysis of population health data. Lancet 2006,
367(9524):1747-1757.
2. Mathers CD, Vos ET, Stevenson CE, Begg SJ: The Australian Bur-
den of Disease Study: measuring the loss of health from dis-
eases, injuries and risk factors. The Medical journal of Australia
2000, 172(12):592-596.
3. National Institute for Clinical Excellence: Depression: management of
depression in primary and secondary care London: National Institute for
Clinical Excellence; 2004.
4. Schoevers RA, Smit F, Deeg DJ, Cuijpers P, Dekker J, van Tilburg W,
Beekman AT: Prevention of late-life depression in primary
care: do we know where to begin? The American journal of psychi-
atry 2006, 163(9):1611-1621.
5. Smits F, Smits N, Schoevers R, Deeg D, Beekman A, Cuijpers P: An
epidemiological approach to depression prevention in old
age. Am J Geriatr Psychiatry 2008, 16(6):444-453.
6. Jackson R: Guidelines on preventing cardiovascular disease in
clinical practice. BMJ (Clinical research ed) 2000,
320(7236):659-661.
7. Mann JJ, Ellis SP, Waternaux CM, Liu X, Oquendo MA, Malone KM,
Brodsky BS, Haas GL, Currier D: Classification trees distinguish
suicide attempters in major psychiatric disorders: a model of
clinical decision making. The Journal of clinical psychiatry 2008,
69(1):23-31.
8. Schmitz N, Kugler J, Rollnik J: On the relation between neuroti-
cism, self-esteem, and depression: results from the National
Comorbidity Survey. Comprehensive psychiatry 2003,
44(3):169-176.
9. D'Alisa S, Miscio G, Baudo S, Simone A, Tesio L, Mauro A: Depres-
sion is the main determinant of quality of life in multiple scle-
rosis: a classification-regression (CART) study. Disability and
rehabilitation 2006, 28(5):307-314.
10. Leach LS, Christensen H, Mackinnon AJ, Windsor TD, Butterworth P:
Gender differences in depression and anxiety across the
adult lifespan: the role of psychosocial mediators. Social psy-
chiatry and psychiatric epidemiology 2008, 43(12):983-998.
Publish with BioMed Central and every
scientist can read your work free of charge
"BioMed Central will be the most significant development for
disseminating the results of biomedical research in our lifetime."
Sir Paul Nurse, Cancer Research UK
Your research papers will be:
available free of charge to the entire biomedical community
peer reviewed and published immediately upon acceptance
cited in PubMed and archived on PubMed Central
yours — you keep the copyright
Submit your manuscript here:
/>BioMedcentral
BMC Psychiatry 2009, 9:75 />Page 8 of 8
(page number not for citation purposes)
11. Aneshensel CS, Huba GJ: Depression, alcohol use, and smoking
over one year: a four-wave longitudinal causal model. Journal
of abnormal psychology 1983, 92(2):134-150.
12. Sullivan LE, Fiellin DA, O'Connor PG: The prevalence and impact
of alcohol problems in major depression: a systematic
review. The American journal of medicine 2005, 118(4):330-341.
13. Degenhardt L, Hall W, Lynskey M: Exploring the association
between cannabis use and depression. Addiction (Abingdon, Eng-
land) 2003, 98(11):1493-1504.
14. Harder VS, Morral AR, Arkes J: Marijuana use and depression
among adults: Testing for causal associations. Addiction (Abing-
don, England) 2006, 101(10):1463-1472.
15. Hayatbakhsh MR, Najman JM, Jamrozik K, Mamun AA, Alati R, Bor W:
Cannabis and anxiety and depression in young adults: a large
prospective study. Journal of the American Academy of Child and Ado-
lescent Psychiatry 2007, 46(3):408-417.
16. Klungsoyr O, Nygard JF, Sorensen T, Sandanger I: Cigarette smok-
ing and incidence of first depressive episode: an 11-year, pop-
ulation-based follow-up study. American journal of epidemiology
2006, 163(5):421-432.
17. Korhonen T, Broms U, Varjonen J, Romanov K, Koskenvuo M, Kin-
nunen T, Kaprio J: Smoking behaviour as a predictor of depres-
sion among Finnish men and women: a prospective cohort
study of adult twins. Psychological medicine 2007, 37(5):705-715.
18. Kessler RC: The effects of stressful life events on depression.
Annual review of psychology 1997, 48:191-214.
19. Tennant C: Life events, stress and depression: a review of
recent findings. The Australian and New Zealand journal of psychiatry
2002, 36(2):173-182.
20. Geerlings SW, Beekman AT, Deeg DJ, Van Tilburg W: Physical
health and the onset and persistence of depression in older
adults: an eight-wave prospective community-based study.
Psychological medicine 2000, 30(2):369-380.
21. Ross CE, Mirowsky J: Sex differences in the effect of education
on depression: resource multiplication or resource substitu-
tion? Social science & medicine (1982) 2006, 63(5):
1400-1413.
22. Maffeo PA, Ford TW, Lavin PF: Gender differences in depression
in an employment setting. Journal of personality assessment 1990,
55(1-2):249-262.
23. Zimmerman FJ, Katon W: Socioeconomic status, depression
disparities, and financial strain: what lies behind the income-
depression relationship? Health economics 2005,
14(12):1197-1215.
24. Maselko J, Gilman SE, Buka S: Religious service attendance and
spiritual well-being are differentially associated with risk of
major depression. Psychological medicine 2008:1-9.
25. Norton MC, Skoog I, Franklin LM, Corcoran C, Tschanz JT, Zandi PP,
Breitner JC, Welsh-Bohmer KA, Steffens DC: Gender differences
in the association between religious involvement and
depression: the Cache County (Utah) study. The journals of ger-
ontology 2006, 61(3):P129-136.
26. Lawlor DA, Hopker SW: The effectiveness of exercise as an
intervention in the management of depression: systematic
review and meta-regression analysis of randomised control-
led trials. BMJ (Clinical research ed) 2001, 322(7289):763-767.
27. de Wit LM, van Straten A, van Herten M, Penninx BW, Cuijpers P:
Depression and Body Mass Index, a U-shaped association.
BMC public health 2009, 9(1):14.
28. Jorm AF, Anstey KJ, Christensen H, Rodgers B: Gender differences
in cognitive abilities: The mediating role of health state and
health habits. Intelligence 2004, 32:7-20.
29. Spitzer RL, Kroenke K, Williams JB: Validation and utility of a self-
report version of PRIME-MD: the PHQ primary care study.
Primary Care Evaluation of Mental Disorders. Patient
Health Questionnaire. JAMA 1999, 282(18):1737-1744.
30. Goldberg D, Bridges K, Duncan-Jones P, Grayson D: Detecting anx-
iety and depression in general medical settings. BMJ (Clinical
research ed) 1988, 297(6653):897-899.
31. Babor TF, Higgins-Biddle JC, Saunders JB, Monteiro MG: AUDIT: The
Alcohol Use Disorders Identification Test, Guidelines for Use in Primary Care
2nd edition. Geneva: World Health Organization; 2001.
32. DeLong ER, DeLong DM, Clarke-Pearson DL: Comparing the
areas under two or more correlated receiver operating
characteristic curves: a nonparametric approach.
Biometrics
1988, 44(3):837-845.
Pre-publication history
The pre-publication history for this paper can be accessed
here:
/>pub