Ecotoxicological Testing of Marine and Freshwater Ecosystems: Emerging Techniques, Trends, and Strategies - Chapter 7 pdf
Bạn đang xem bản rút gọn của tài liệu. Xem và tải ngay bản đầy đủ của tài liệu tại đây (729.32 KB, 19 trang )
229
chapter seven
Risk perception and public
communication of aquatic
ecosystem assessment
information
M.R. Reiss and L. Pelstring
Contents
Introduction 229
Risk perception 230
Risk perception and aquatic ecosystem assessment 232
Aquatic ecosystem assessment communication 234
Audience analysis 235
Interacting with the public 239
Communicating results of aquatic ecosystem assessments 240
Pretesting message effectiveness 240
Emphasizing the relevance of results 241
Data framing 241
Graphic and visual representations of data 242
Uncertainty discussion 243
Conclusions 244
Summary 244
References 245
Introduction
Aquatic ecosystem assessments provide technical information about ecosys-
tem health and integrity and inform recommendations to preserve, enhance,
or restore ecosystem functions. Nontechnical experts (such as elected
3526_book.fm Page 229 Monday, February 14, 2005 1:32 PM
© 2005 by Taylor & Francis Group, LLC
230 Ecotoxicological testing of marine and freshwater ecosystems
officials) in consultation with the public often make decisions regarding the
commitment of political or resource expenditures. These decision-makers
are often unfamiliar with data and techniques used to assess aquatic ecosys-
tems. As such, it is important that assessment results be effectively commu-
nicated in comprehensible terms and language to ensure that decision-mak-
ers and the public are adequately informed.
The preceding chapters described advancements in aquatic bioassess-
ment tools and techniques. Experts use the data obtained from studies
employing these techniques in mathematical models, such as ecological risk
assessments, to evaluate ecosystem health and integrity. While aquatic sci-
entists may find the results of these models persuasive or indeed conclusive,
policy-makers and the general public often remain unconvinced.
The seeming inability or unwillingness of the public to associate “appro-
priate” levels of risk with specific activities, technologies, and events is often
frustrating to those conducting the assessments. Literature noting the dis-
parity between risk judgments of technical and lay groups has been reported
in many fields, including the environment, public health, and technology
sectors (Kraus et al. 1992; Harrington 1998; Flynn et al. 1993; Wright et al.
2000). Technical experts often consider this disparity as symptomatic of a
lack of education or of obstinacy on the part of the public (Slovic 1987; Kraus
et al. 1992). Such a simplistic view, however, discounts the complexities of
how risk attitudes are actually formed.
Clearer communication based on a better understanding of how nonex-
perts perceive ecological risk may close this disparity. This chapter provides
the aquatic ecosystem assessor with an appreciation of the variety of factors
that contribute to public perceptions of risk, an understanding of the impact
of these factors on the communication of assessment results, and some spe-
cific strategies for fostering credibility and trust with public stakeholders,
establishing avenues for meaningful public involvement, and communicat-
ing assessment results.
Risk perception
There are fundamental psychological, socioeconomic, and cultural dimen-
sions to risk perception. Two dominant lines of research exploring risk atti-
tudes are the psychometric and cultural approaches. Psychometric theory
hypothesizes that risk perceptions reflect the inherent characteristics or
nature of the hazard associated with a given situation (Slovic 1987). Cultural
theory proposes that risk perceptions reflect an individual’s life perspective
or worldview (Douglas and Wildavsky 1982).
Increasingly, there is a convergence of the psychometric and cultural
approaches in explaining risk attitudes. Experts acknowledge that while the
specific characteristics of a situation are undoubtedly important contributors
to its perceived risk, consideration of sociodemographic and cultural con-
texts explains much of the variability in the risk attitudes of individuals (and
groups).
3526_book.fm Page 230 Monday, February 14, 2005 1:32 PM
© 2005 by Taylor & Francis Group, LLC
Chapter seven: Risk perception and public communications 231
Surveys using the psychometric approach pose a series of questions
designed to assess the perceived characteristics of potentially risky situa-
tions, and ask respondents to quantitatively rank their level of concern
associated with each situation. Rank scores from each of these questions are
then considered in multivariate factorial analyses and the situations are
mapped in factorial space. The shared characteristics of situations occupying
similar positions in factorial space can then be used to characterize the nature
of the psychological factors underlying the way that risks are perceived and
assigned by the respondents.
The psychometric approach described above can help identify the com-
plex and rich assortment of underlying factors that contribute to a situation’s
perceived riskiness by the public. However, not everyone perceives or
assigns relative risk in exactly the same manner. An individual’s personal
history and circumstances (such as previous accidents or illnesses, or paren-
tal status) also contribute to perception and allocation of risk (Marris et al.
1997). Differences in risk attitudes across gender, racial, and demographic
lines have also been reported (Flynn et al. 1994).
Variability in risk perception is a function of the social, political, geo-
graphic (proximity to risk situation), and economic circumstances of indi-
viduals and groups. Recognition of the importance of these extra-situational
factors is the impetus for cultural research. Cultural risk perception research
is conducted along sociological and anthropological lines of inquiry to
explain the variability in human allocation of risk.
Cultural theory suggests that an individual’s worldview is supported
by a set of biases that color perceptions of risk. Individuals subconsciously
choose to adopt perceptions of risk that reinforce their perspective and way
of life (Douglas and Wildavsky 1982). While an individual’s perceptions of
risk are expected to be more or less stable, a degree of evolution in an
individual’s outlook occurs based on life experience, social interactions, and
changes in surrounding conditions (Boholm 1996). Adherents to a given
worldview tend to selectively accommodate information that reinforces their
worldview. Therefore it is difficult to win over skeptics solely by seeking to
educate them with more or better technical information.
Adherence to a particular worldview cannot be predicted solely on the
basis of social group; nevertheless, demographics and prevalence of specific
worldviews are not independent (Brenot et al. 1998; Gustafson 1998; Marris
et al. 1998). Cultural theorists suggest that worldviews influence attitudes
toward many social issues, extending well beyond perception of risk. Dif-
ferences in risk perceptions that have been reported for different social
groups, such as racial and gender differences, may actually be manifestations
of cultural differences in other areas, such as attitudes regarding trust,
empowerment, and equity (Flynn et al. 1994).
Both psychometric and cultural risk research have shown that the degree
of public trust in the institution, organization, or individual responsible for
assessment and communication plays a critical role in public attitudes
toward risks managed by that entity (Siegrist and Cvetkovich 2000; Bord
3526_book.fm Page 231 Monday, February 14, 2005 1:32 PM
© 2005 by Taylor & Francis Group, LLC
232 Ecotoxicological testing of marine and freshwater ecosystems
and O’Connor 1992). Numerous surveys have been conducted to identify
the important factors that the public considers when judging the trustwor-
thiness and credibility of risk-management entities. Institutions with dem-
onstrated records of honesty and openness, knowledge and expertise, care
and concern, and commitment to public or ecological health enjoy greater
levels of public trust (Frewer et al. 1996; Peters et al. 1997; Bord and O’Connor
1992). To build public trust, it is necessary to establish the credibility, integ-
rity, and accountability of those performing key risk analysis, management,
and communication functions and to demonstrate that adequate resources
and technologies are available to fully address the risk situation.
Demonstrations of technical knowledge alone (presenting the public
with more or better technical data) do not significantly alter trust and public
risk attitudes (Slovic 1993). Therefore, investment in outreach and involve-
ment strategies that fosters trusting relationships with public stakeholders
may be a more promising direction for changing risk attitudes than simply
improving technical assessment methodologies. Effective communication
with public stakeholders is important in building these relationships.
Risk perception and aquatic ecosystem assessment
Attaining consensus on what should be achieved when assessing and
managing aquatic ecosystems presents a challenge that is not shared by other
(such as human health) risk-assessment and management scenarios — there
is no single definition of ecological health or integrity that is widely accepted
or that is applicable across ecosystems (McDaniels 1998). Moral, value, and
ethical judgments about the system are often made in selecting a particular
state for the ecosystem to be considered healthy (Fisher 1998; Kapustka and
Landis 1998). When an assessment fails to address those aspects of the system
that are valued by the public, there is increased potential for conflict. Making
these types of judgments (establishing ecosystem goals) is an inherently
societal function.
In addition, ecosystems are complex and dynamic and assessors must
make numerous judgments in technical areas of the assessment (such as
selection of assays, exposure assumptions, dose-response curves, and mea-
sures of fitness) to obtain maximally relevant lines of evidence (Kapustka
and Landis 1998; Otway and von Winterfeldt 1992). Although the public
grants assessors a degree of latitude to exercise judgment in technical areas
of assessments (Fisher 1998), the public may not understand how these
choices relate to its ecosystem concerns. This can present difficulties in com-
municating assessment results or in attaining consensus on assessment find-
ings.
Research has shown that the public has more confidence in assessments
that employ formal processes for making judgments in key areas of assess-
ments (Otway and von Winterfeldt 1992), such as selecting goals and end-
points. Using formal processes, such as citizen advisory groups or scientific
peer review panels, to inform judgments made in key areas improves public
3526_book.fm Page 232 Monday, February 14, 2005 1:32 PM
© 2005 by Taylor & Francis Group, LLC
Chapter seven: Risk perception and public communications 233
acceptance of those judgments (Otway and von Winterfeldt 1992) and can
enhance perceptions of openness and trust by providing a mechanism for
ongoing dialogue with the affected public (Lynn and Busenberg 1995).
Communication challenges can be minimized if public values and con-
cerns regarding the aquatic system are evaluated as part of the study scoping
process, and considered in designing and conducting assessments. Assess-
ments should target the prevailing values and attitudes of the majority of
the audience while being sensitive and responsive to minority values and
views.
Relatively little research has specifically investigated risk attitudes
related to perceived hazards to the environment. However, one study that
has particular relevance to aquatic ecosystem assessors is that of McDaniels
et al. (1997). In this study, psychometric techniques were used to evaluate
how residents from three communities (suburban, rural, and mixed urban
and rural) in a watershed (the Fraser River Basin in British Columbia, Can-
ada) perceived risks to the aquatic ecosystem associated with 33 situations.
Respondents were also asked questions regarding their worldviews on the
environment.
The situations posed to Fraser River Basin residents by McDaniels et al.
ranged broadly in nature and in potential for ecological impact to the system.
Situations included activities having a direct impact on the ecosystem (such
as commercial fishing, urban development, and waste disposal), human
activities (such as irrigation withdrawal), indirect environmental conse-
quences of those activities (agricultural runoff and landfill leaching), natural
phenomena (drought), and recreational activities (such as canoeing and sport
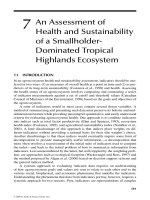
fishing). A survey of expert opinions (aquatic scientists and environmental
managers) was also conducted to contrast and compare expert and public
perceptions of risks posed by these situations. General relationships among
situations revealed in this study are presented in Figure 7.1. The results of
this survey are used to illustrate how to maximize effective public commu-
nication of aquatic assessment information.
Expert and lay judgments of ecological hazard were similar for most
situations posed to survey respondents; there were, however, notable differ-
ences for certain situations. For example, experts associated higher levels of
risk with introduced species, hydrodevelopment, and population growth,
and they assigned lower risks to natural phenomena than did the lay public.
These differences in risk allocations suggest that the lay public has a more
limited understanding of causal relationships in ecological systems, and
tends to emphasize impacts to species (including humans) in ecological-risk
allocations.
The McDaniels et al. study revealed only modest differences among lay
groups’ perceptions of aquatic ecosystem risk. Differences in risk allocation
among lay groups were correlated with differences in the level of human
benefits that each group associated with the posed situation. For example,
urban residents rated withdrawal of water for irrigation as riskier than did
residents of rural, farming communities that would receive the benefits of
3526_book.fm Page 233 Monday, February 14, 2005 1:32 PM
© 2005 by Taylor & Francis Group, LLC
234 Ecotoxicological testing of marine and freshwater ecosystems
such withdrawal. The inverse relationship between perceived risk and ben-
efit has been consistently reported in studies attempting to capture this
interaction (e.g., Alhakami and Slovic 1994; Gregory and Mendelsohn 1993).
Therefore, although perceived benefit is independent from technical
assessments of hazard, it clearly plays an extremely important role in the
psychological calculation that an individual makes in attributing “net” risk
to a given situation (Gregory and Mendelsohn 1993). This suggests that
effective communication might be enhanced by specifically relating assess-
ment results to impacts on species (including humans) and derived or lost
human benefits.
Aquatic ecosystem assessment communication
The intent of aquatic ecosystem assessment communication programs
should
not
be to persuade or convince the public, but rather to provide them
with the information necessary to understand assessment goals, methods,
and findings, and the implications for those attributes of the system that
they value. Aquatic ecosystem assessment communication programs require
frequent interaction with the public to assist them in forming balanced
opinions about the assessment and its recommendations, to identify areas
of agreement and disagreement, and to solicit their input as to how any
differences might be resolved.
Figure 7.1
Location of 33 potential hazards to aquatic ecosystem derived from rela-
tionships among 17 risk characteristics. Situations in the upper left quadrant (high
perceived impact and low perceived benefit) of the factorial space were perceived as
posing the greatest risk to the river ecosystem. (Reprinted from McDaniels, T.L.,
Axelrod, L.J., Cavanagh, N.S., and Slovic, P.,
Risk Anal.
17, 341–352, 1997. With
permission of author and Blackwell Publishers, Inc.)
3526_book.fm Page 234 Monday, February 14, 2005 1:32 PM
© 2005 by Taylor & Francis Group, LLC
Chapter seven: Risk perception and public communications 235
Given the importance of public support in aquatic ecosystem manage-
ment, public outreach and communication must be an integral part of overall
assessment project planning. Poorly constructed public involvement and
communication strategies can heighten the public’s sense of mistrust and
lead to conflict that can derail or delay the assessment or implementation of
its recommendations (Box 7.1).
The remainder of this chapter provides an overview of risk communi-
cation basics and emphasizes obtaining and using information about audi-
ence concerns, values, abilities, and information preferences to improve com-
munication about aquatic ecosystem assessments. Recommendations made
are based on the authors’ experiences in communicating aquatic ecosystem
information. Some useful Web sites for obtaining additional information
about public outreach and risk communication are provided in Box 7.2.
Audience analysis
Aquatic ecosystem assessors and managers typically have a very good
understanding of the information they wish to convey, but have only a
cursory understanding of their target audiences and the media or channels
that will reach those audiences. Obtaining public attention and participation
in aquatic ecosystem assessments depends on a communication plan that
incorporates audience values, abilities, and preferences (Bath 1996; EPA 1995;
Lundgren and McMakin 1998). Audience analysis, often referred to as human
dimensions research (Decker et al. 1987), should be performed as early as
possible in the assessment and communication planning process to obtain
this information. Human dimensions information allows financial and staff
resources to be focused on communications strategies that are tailored to
effectively reach and resonate with the audience.
A communication program for a specific aquatic ecosystem assessment
may target stakeholders from a relatively restricted geographic region or
stakeholders that share a somewhat homogeneous demographic profile
(such as farming communities within a specific watershed). In this case, it
may be possible to rely on a focused range of communication formats and
channels. Communicating with stakeholders from a broad geographic area
or who may have diverse backgrounds and attitudes may require the use of
multiple formats and channels to reach these different audiences. Appropri-
ate methods for obtaining representative human dimensions information for
these situations also differ.
In cases where the target population is relatively small and homoge-
neous or the communicator is in the initial stages of developing an outreach
strategy, small group meetings, focus groups, or interpersonal, face-to-face
communication (such as interviews) are useful methods for obtaining human
dimensions information to support public outreach and communication
planning. For example, the U.S. Environmental Protection Agency (EPA)
recommends 15 to 25 community interviews when developing a community
3526_book.fm Page 235 Monday, February 14, 2005 1:32 PM
© 2005 by Taylor & Francis Group, LLC
236 Ecotoxicological testing of marine and freshwater ecosystems
One of New York’s largest watersheds, the Hudson River, spans 500 kilometers
from its lake source in the Adirondacks to New York Harbor. It is also one of the
largest hazardous waste sites in the U.S. Until 1977, the General Electric Com-
pany (GE) legally discharged approximately 600,000 kilograms of polychlori-
nated biphenyls (PCBs) from two capacitor-manufacturing facilities into the
upper Hudson River. In the mid-1980s, the U.S. Environmental Protection Agency
(EPA) designated 325 kilometers of the river as a Superfund site and embarked
on a lengthy remedial investigation. GE strongly opposed dredging as a cleanup
option and maintained that it was unnecessary because the river was ridding
itself of PCBs through natural attenuation.
In addition to the technical and scientific complexities of the remedial
investigation, the Hudson River Superfund site generated unprecedented polit-
ical and public controversy. Interest groups and GE waged media battles in
attempts to sway public opinion. Fearful of what dredging would do to local
economies and the impact it would have on the river, many upriver residents
sided with GE. Citizens living further downriver, however, tended to support
dredging of the river as the preferred remedy. Gaining the public’s trust was a
critical issue for both GE and EPA.
To build support for its theory of natural attenuation as a cleanup strategy
and discourage EPA from selecting dredging as a remedy, GE waged a massive
public relations campaign. The company placed multiple television, radio, and
full-page newspaper advertisements, issued colorful, glossy newsletters, estab-
lished a Web site, and conducted surveys of citizens. EPA received thousands
of postcards from residents opposing dredging; the postcards were provided
by GE. The company spent an estimated $15 to $30 million on its public relations
campaign. As the media began reporting about the millions that GE was devot-
ing to public relations, many citizens questioned whether this money would be
better spent cleaning the river.
EPA’s early outreach plan included mailings about the investigation and
cleanup process to roughly 1500 interested citizens, meetings with local elected
officials, and establishing four stakeholder groups comprising a range of inter-
ests, including scientists, academics, interested and affected citizens, repre-
sentatives from interest groups, GE employees, and state agency officials. EPA
also held multiple public meetings at cities along the river, with as many as 400
citizens attending. One EPA staff member was devoted full-time to orchestrating
these activities, with support from contractors.
The agency’s early outreach program was subject to significant public
criticism. Some complained about the balance of representation in the stake-
holder advisory groups. Advocates from both the pro- and anti-dredging camps
complained that EPA was not providing adequate or timely information and that
its decision-making process was not transparent. These critics declared that
EPA had already decided on its cleanup plan and was merely going through
the motions of public involvement.
Box 7.1
Evolution of an EPA community involvement program
3526_book.fm Page 236 Monday, February 14, 2005 1:32 PM
© 2005 by Taylor & Francis Group, LLC
Chapter seven: Risk perception and public communications 237
relations plan (EPA 1992). Care must be taken, however, to ensure that the
public is fairly represented in these forums (Lynn and Busenberg 1995).
For those issues involving a large geographic area and potentially a more
diverse range of citizen opinions, there may be a need for larger-scale inves-
tigations (such as administering questionnaires by mailings, telephone, or
polling stations) to determine audiences’ sociocultural attitudes and trusted
information sources. The planning, execution, and results analysis for these
surveys may entail resource investments that are disproportionate to the
scale or controversy of many aquatic ecosystem assessment programs. Con-
ducting such surveys, however, is not the only means to obtain information
EPA issued a cleanup decision in early 2002 requiring the dredging of two
million cubic meters of sediment to remove an estimated 68,000 kilograms of
PCBs from a 250-kilometer stretch of the upper Hudson. Since its announcement
to dredge, EPA has taken actions to address shortcomings in its public outreach
program and to rebuild public trust. The agency discontinued the earlier stake-
holder groups and replaced most formal public meetings with public availability
sessions. Public availability sessions use a meeting format that allows agency
officials to interact with attendees on an informal, one-on-one basis. EPA now
provides timely information about the cleanup and other activities on its Web
site, mails periodic newsletters that contain text and graphic presentation of
information and data, and started an e-mail listserve.
A critical move demonstrating that the agency was serious about improving
public involvement was the establishment of an on-site field office in Hudson
Falls, NY, where criticism of the agency’s efforts was often the loudest. The
upriver office enables residents to obtain information quickly and agency officials
to be more in tune with local concerns. EPA has also devoted significantly more
financial and personnel resources to outreach — approximately three full-time
staff with internal administrative support.
Finally, in early 2002, EPA contracted an independent consulting company
with expertise in facilitation. The contractor helped EPA develop a community
involvement program to ensure active public participation during the design and
implementation of the dredging project. EPA interviewed hundreds of individuals
and held local workshops to develop the community involvement plan. The final
plan identifies tools and activities the agency will use to address community
concerns, providing the public with multiple opportunities for involvement. The
plan also contains a glossary, references, and a series of appendices designed
to serve as resources for both EPA and the community. Specific sections include
contact information for the EPA and the project team, local government, and
media, and information on how to obtain additional information.
EPA’s outreach plan for the Hudson has evolved from a largely one–staff-per-
son effort to a comprehensive program. Increasing the agency budget and the
number of personnel for outreach, using contractors with experience in facilita-
tion, expanding the avenues by which citizens may obtain information, and
developing a public involvement plan shaped by community input demonstrates
an agency commitment to ensuring that citizens are able to provide informed
input throughout a complex aquatic remediation project.
Box 7.1 (continued)
Evolution of an EPA community involvement program
3526_book.fm Page 237 Monday, February 14, 2005 1:32 PM
© 2005 by Taylor & Francis Group, LLC
238 Ecotoxicological testing of marine and freshwater ecosystems
Below is a brief list of Web sites that provide additional information about risk
communication in a variety of contexts. Additional documents and sites may be
obtained by typing “risk communication” in search engines at the home Web
sites for the organizations. This list is not intended to provide a complete
overview of Web resources, but rather to direct the reader to several particularly
useful sites. Many of these sites have additional links that the reader may also
find helpful.
Government
www.atsdr.cdc.gov/HEC/primer.html
This site provides a primer on health risk communication by the Agency for Toxic
Substances and Disease Registry.
www.inspection.gc.ca/english/corpaffr/publications/riscomm/riscomme.shtml
This Canadian site provides an excellent overview of risk communication, includ-
ing a review of recent risk communication theories.
www.epa.gov/oerrpage/superfund/tools/index.htm
This site provides guidance for promoting successful community participation,
specifically for hazardous waste cleanup programs. The site contains 46 tools,
each of which describes activities that the EPA has used successfully, or pro-
vides information on available resources.
www.epa.gov/waterscience/fish/guidance.html
This site provides guidance for assessing and managing health risks associated
with the consumption of chemically contaminated fish. The EPA developed the
guidance documents to help state, local, regional, and tribal environmental
health officials who are responsible for establishing fish consumption advisories.
The fourth volume of the guidance is specifically devoted to risk communication.
www.who.int/whr/2002/en/
Chapter 3 of the World Health Organization’s 2002
World Health Report
provides
information about risk perception, presenting data, the importance of risk com-
munication, the role of the media in risk perceptions, and the social and cultural
interpretations of risk.
www.who.int/water_sanitation_health/Documents/IWA/iwachap14.pdf
This World Health Organization site provides a chapter on risk communication
in the context of threats to water supplies. It specifically provides information
on developing a risk communication program and managing the overall com-
munication effort, including audience identification, message development, and
crisis management.
Organizations
www.sra.org/
The Society for Risk Analysis (SRA) provides an open forum for all those who
are interested in risk analysis. Risk analysis is broadly defined to include risk
assessment, risk characterization, risk communication, risk management, and
policy relating to risk.
www.riskworld.com/
RiskWorld is a comprehensive collection of links to risk-related news, events,
and societies.
Box 7.2
Risk communication Internet sites
3526_book.fm Page 238 Monday, February 14, 2005 1:32 PM
© 2005 by Taylor & Francis Group, LLC
Chapter seven: Risk perception and public communications 239
necessary to characterize the communication requirements for large or
diverse audiences.
Government census databases may also provide useful demographic
information (such as education level, ethnicity, income level, familial status,
and age) for communication planning. Public opinion polls, such as electoral
efforts, may also be available. In many countries, useful data on regional
demographics and social attitudes (environmental and political values) can
also be identified through commercially available databases or through con-
sumer market data (e.g., subscription lists).
Communication strategies should never be based exclusively on infor-
mation from census and market databases. Generally, these data are not
sufficiently site- and issue-specific to develop an effective public outreach
and communication strategy. Prevailing public attitudes revealed by these
data, however, may be useful for identifying candidate strategies for con-
ducting outreach.
Attitudes, knowledge levels, concerns, and information preferences can
and often do change during the course of a communication campaign (Fis-
chhoff 1995; Peters et al. 1997). Attitudes can change based on evolution of
trust dynamics during the campaign (Peters et al. 1997) or can shift abruptly
as a result of events that are outside the communicator’s control, such as
media reports of environmental calamities (Lindell and Perry 1990; Liu et
al. 1998). Therefore, audience analysis and communication planning should
be viewed as continuous programs, rather than as one-time efforts, to allow
the individual and collective effectiveness of communication elements and
the overall strategy to be gauged and adapted as necessary (Bradbury 1994).
Interacting with the public
Many communication efforts fail because they use ineffective methods to
reach audiences. For example, government agencies typically rely on public
meetings (Fiorino 1990) to convey environmental information to the public.
While public meetings are often required by law, they may not always
effectively inform and involve citizens (EPA 1995). Public meetings transmit
information to the public but often do not enable information exchange or
dialogue between speaker and audience.
Communication strategies such as interviews, small group meetings,
and focus groups that allow for two-way information exchange should be
emphasized in aquatic ecosystem assessment programs. These forums allow
the communicator to convey a message and learn more about audience
concerns. Furthermore, members of the public may share insights, experi-
ence, or expertise that can be invaluable to aquatic ecosystem assessors (for
example, farmers may be uniquely qualified to comment on assumptions
regarding rates of irrigation, or fertilization and pesticide application). There-
fore, forums that allow for information exchange may help establish trust
between the institution and the recipient, as well as enable the communicator
3526_book.fm Page 239 Monday, February 14, 2005 1:32 PM
© 2005 by Taylor & Francis Group, LLC
240 Ecotoxicological testing of marine and freshwater ecosystems
to identify areas where improved information or alternate approaches may
improve the assessment or enhance public understanding.
In addition to direct interaction with the public, there are many other
options for conveying information to the public. The public is not indiscrim-
inate in its preferences for receiving information (Jungermann et al. 1996).
Ideally, a combination of media, forums, or intermediaries (such as academ-
ics or community leaders) that the audience relies on and trusts should be
used to disseminate messages.
Communicating results of aquatic ecosystem assessments
Aquatic ecosystem assessments often generate a great deal of technical infor-
mation. In the interest of demonstrating openness or full disclosure, or to
demonstrate the thoroughness of an assessment, aquatic scientists often feel
compelled to present the public with large quantities of technical data. How-
ever, presenting too much data can overwhelm and distract the public from
the most essential components of the assessment (Fischhoff 1995). Only those
data that are essential to convey key aspects of an assessment should be
included in communication materials. The audience should also, however,
be provided with information on how to obtain additional data, should they
desire it.
Differences between expert and public risk perceptions relating to
aquatic ecosystems are not overcome simply by crafting an effective message;
well-crafted messages, however, can serve to fill knowledge gaps, reinforce
public beliefs, or correct misconceptions (Fischhoff 1995). Messages should
be objective and balanced — presenting factual material about all sides of
the issue (Lundgren and McMakin 1998). Message content must be econom-
ically, socially, and culturally responsive to the needs, interests, and values
of the audience (EPA 1995). Crafting such a message is difficult, if not impos-
sible, without early and adequate audience analysis.
Pretesting message effectiveness
A wide variety of message formats and contents are possible for presenting
aquatic ecosystem information to the public. Because not all formats are
equally effective in communicating to different audiences, it is important to
pretest the effectiveness and clarity of multiple information formats and
contents. The effectiveness of candidate messages can be pretested by pre-
senting them to representative samples of the audience in small, interactive
forums, such as stakeholder focus groups. Pretesting in this manner ensures
that concepts, language, and graphics used in messages are clear, compre-
hensive, and unbiased (Lundgren and McMakin 1998).
Communicating aquatic ecosystem assessment information may be more
effective if attention is devoted to three areas in crafting messages: emphasiz-
ing the relevance of results, using graphics and framing to convey data, and
addressing uncertainty. A brief discussion of these points is provided below.
3526_book.fm Page 240 Monday, February 14, 2005 1:32 PM
© 2005 by Taylor & Francis Group, LLC
Chapter seven: Risk perception and public communications 241
Emphasizing the relevance of results
As discussed above, technical assessments of environmental quality of an
aquatic system are necessarily focused on measurable endpoints. The ratio-
nale for these endpoints may be self-evident to the aquatic assessor. How-
ever, the public may have an entirely different set of endpoints or concerns
and may not understand how assessment findings relate to their concerns.
Similarly, while comparing data to established numerical standards can help
convey the relevance and importance of assessment findings to the public
(Lundgren and McMakin 1998), such comparisons are of limited assistance
if the public does not understand how those standards relate to their partic-
ular endpoints or concerns.
Because the public employs ecological risk constructs that emphasize
impacts to species (including humans) and perceived human benefits
(McDaniels et al. 1997), implications of assessment results for the public’s
ecosystem goals can be emphasized in communicating with the public by
specifically relating assessment results to impacts to species (including
humans) and derived or lost human benefits.
For example, an assessor may learn that an audience has identified
recreational angling as an important value for the ecosystem. The assessor
may then extend a water-quality model to explicitly consider the effect of
changes in water quality on game fish populations. Assessment results can
then be communicated in terms that more fully resonate with public values
and concerns (the importance of angling and impacts to species) while
accommodating potential limits in the public’s knowledge of ecological rela-
tionships and linkages.
Data framing
An important consideration in presenting assessment results is the effects of
framing of data (the specific manner in which data is presented) on public
reactions. For example, research has shown that the public may respond
differently to the same proportion or probability result, depending on
whether it is expressed as probability (
p
) of an adverse effect occurring or
as the inverse probability (1 -
p
) of no adverse effect occurring (Slovic 2001).
For example, the public may judge a bioassay very differently based solely
on whether the results are presented as a percentage of survival or a per-
centage of mortality.
There are appropriate and useful applications for data framing. Use of
comparisons to familiar concepts can help communicate numerical data that
the public may not otherwise understand (Fisher 1998). Quantities (such as
rates, volumes, areas) involved in aspects of aquatic ecosystem assessments
(such as groundwater discharge to water bodies, areal extent of impact) may
be difficult for the public to grasp. These challenges may be minimized by
using comparisons to situations that are familiar to the public to provide
senses of magnitude or proportion. For example, the public may better
understand the rate of groundwater discharge to a water body if it is
3526_book.fm Page 241 Monday, February 14, 2005 1:32 PM
© 2005 by Taylor & Francis Group, LLC
242 Ecotoxicological testing of marine and freshwater ecosystems
compared with a more familiar concept, such as a typical year’s rainfall, the
volume of water used in a shower, or the flow of a local stream. Alternatively,
adding a cup of water to a bathtub could be used to illustrate the proportion
of daily groundwater discharge to the total volume of the water body. Geo-
graphic areas might be effectively illustrated by comparisons to city blocks
or local parks.
While comparing data to situations of a similar or neutral nature can be
useful for public communication, using comparisons of concepts that differ
significantly in nature should be avoided (Freudenberg and Rursch 1994).
Psychometric research has shown that differences in the characteristics and
nature of individual situations can invoke very different public risk percep-
tions (Slovic 1987). For example, using the amount of oil released in a recent
spill to describe the volume of oil introduced to a water body from urban
runoff would not be useful. The acute and visual impacts of spills evoke
feelings of outrage in the public. Using such a comparison could result in
the public misjudging the nature of the urban runoff problem.
Graphic and visual representations of data
Displaying data in a graphic format organizes and reduces voluminous
information and may effectively increase public comprehension. Graphic
and visual representations of data may also enhance the media’s judgment
of aquatic ecosystem information as newsworthy and increase their willing-
ness to report it (Greenberg et al. 1989). Visual and graphic representation
of data must effectively support key aspects of the message and be as clear
and objective as possible. Communicators of aquatic assessment information
are encouraged to be creative in developing visual data representations to
support public communication. However, because of the powerful impact
of graphic and visual data representations, it is very important that audience
reactions to the representations be carefully evaluated before they are incor-
porated into public communication materials.
Direct mail pieces and other printed communications generally allow
the audience greater time to digest, and therefore allow for inclusion of more
complex representations (such as tabulated data). Spoken presentations or
communications intended to be shown on television allow less time for
public consumption; accompanying graphics must be correspondingly less
complex (Lundgren and McMakin 1998).
Certain visual representations are better suited for communicating specific
kinds of information. Where providing full or accurate descriptions is difficult
using text alone, photographs or illustrations (or video and animation, where
practical) may effectively support messages and provide visual relief from text
(Lundgren and McMakin 1998). Communication situations that might benefit
from picture-aided text include descriptions of abnormal environmental con-
ditions (such as red tides), pathologies (such as lesions or tumors in biota), or
changes in conditions (before-and-after comparisons). Pictures, illustrations,
and animations may also be useful aids for effectively communicating meth-
ods and tools that are foreign to the public (EPA 1995). Graph and chart
3526_book.fm Page 242 Monday, February 14, 2005 1:32 PM
© 2005 by Taylor & Francis Group, LLC
Chapter seven: Risk perception and public communications 243
displays are particularly effective in facilitating comparison of data among
sites, timeframes, or management options (Lundgren and McMakin 1998).
Appropriately scaled maps and charts aid the communication of geographic
boundaries or relationships. Care must be taken when using maps, however,
as the public may make inappropriate inferences regarding the relationships
of geographically proximate map features (Moen and Ale 1998). For example,
responsibility for ecosystem impairments could mistakenly be attributed to
adjacent industries based solely on geographic proximity.
Scientists are very familiar and comfortable with graphic representations
of data. It is important to remember, however, that graphics that are familiar
and comprehensible to scientists may be misleading or bewildering to the
public. As a result, the public often misinterprets certain graphics (such as
cumulative probability plots) that are routinely used by scientists (Ibrekk
and Morgan 1987). In addition, positioning, scaling, and coloring of graphics
have been shown to affect the public’s interpretation of the meaning of
graphically displayed data (Sandman et al. 1994; Moen and Ale 1998).
Uncertainty discussion
Formal recognition and analysis of areas of uncertainty has become an inte-
gral part of the ecosystem assessment process. Assessment uncertainty is
one of the more important pieces of information that managers consider
when evaluating management recommendations that might arise from an
assessment. As the public becomes more involved in aquatic ecosystem
issues, they increasingly demand to be informed about uncertainties associ-
ated with assessments.
Failing to discuss the limitations of assessments may erode the public’s
perception of the honesty and integrity of the assessment process and of
those conducting the assessment. However, disclosure of uncertainty does
not necessarily result in improved public perceptions. Acknowledging
assessment uncertainty can either enhance the public’s perception of those
responsible for conducting the assessment as honest and forthcoming, or be
interpreted as evidence that the assessors are incapable or unqualified
(Johnson and Slovic 1995). Ultimately, the degree of trust that is present in
the assessor’s relationship with the public determines how uncertainty dis-
closures are perceived.
Discussing quantitative uncertainty associated with assessment data to
the public can be difficult. The public is generally unfamiliar with represen-
tations of uncertainty (Johnson and Slovic 1995) and tends to view guidelines
and decision points as dichotomous thresholds (Lundgren and McMakin
1998). Probabilistic techniques used to derive goals are difficult to explain
and percentiles used to set goals (such as a 95% probability) may be mis-
construed by the public as resulting in the loss of some level of ecological
function (Roberts 1999). When discussing quantitative uncertainty with the
public it is important to discuss the nature of the uncertainty, why it exists,
and steps (if any are possible) that will be taken to reduce uncertainty
(Lundgren and McMakin 1998).
3526_book.fm Page 243 Monday, February 14, 2005 1:32 PM
© 2005 by Taylor & Francis Group, LLC
244 Ecotoxicological testing of marine and freshwater ecosystems
Conclusions
Moral, value, and ethical judgments are often made by the public in selecting
preferred ecological states for aquatic ecosystems. While primarily technical
in nature, the ecosystem assessment should seek to be responsive to societal
values and concerns. Therefore, it is important that public preferences and
values for the system be evaluated and considered in the design and conduct
of aquatic ecosystem assessments.
Managers are often reluctant to allocate the required resources and com-
mit to meaningful public involvement in ecosystem assessment and man-
agement, fearing delays or a loss of institutional control over the process
(Lundgren and McMakin 1998). However, active and early participation by
the public in resource-management issues is more likely to result in decisions
and actions that incorporate a broader range of public values (Fiorino 1990)
and thereby enjoy greater public acceptance (Landre and Knuth 1993). There-
fore, budgeting the time and funding necessary to promote meaningful
public participation in the assessment process should be incorporated into
overall project planning.
Substantial research has shown that public perceptions of the credibility,
concern, and commitment of those conducting technical assessments typi-
cally have more impact on public attitudes toward the findings than do the
technical aspects of the assessment itself (Siegrist and Cvetkovich 2000; Bord
and O’Connor 1992). An important benefit of a well-designed and executed
public outreach and involvement plan is that it can significantly enhance
public perception of the institution’s credibility and its concern for societal
values and goals for aquatic ecosystems. It is likely that the trust gained by
adopting more democratic approaches to public involvement will translate
to better public acceptance of aquatic ecosystem assessments as the basis for
formulating management recommendations.
Summary
Attaining consensus on what should be achieved when assessing and man-
aging aquatic ecosystems presents certain challenges that are not shared by
other (such as human health) risk assessment and management scenarios
(McDaniels 1998). Ecological goals reflect underlying value and ethical judg-
ments regarding the system. Communication challenges can be minimized
if public values and concerns regarding the aquatic system are identified
and considered when establishing goals and designing assessments for
aquatic ecosystems. Public perceptions of assessor credibility, concern, and
commitment have more impact than do technical aspects on public attitudes
toward assessment findings. Therefore, public outreach and involvement
strategies that enable dialogue and build trusting relationships with stake-
holders should be emphasized in communicating with the public about
aquatic ecosystems.
3526_book.fm Page 244 Monday, February 14, 2005 1:32 PM
© 2005 by Taylor & Francis Group, LLC
Chapter seven: Risk perception and public communications 245
This paper has not been subjected to Agency review. Therefore, it does
not necessarily reflect the views of the National Oceanic and Atmospheric
Administration or the U.S. Environmental Protection Agency.
References
Alhakami, A.S. amd Slovic, P., 1994. A psychological study of the inverse relationship
between perceived risk and perceived benefit.
Risk Anal.
14(6), 1085–1096.
Bath, A.J., 1996. Increasing the applicability of human dimensions research to large
predators.
J. Wildlife Res.
1(2), 215–219.
Boholm, A., 1996. Risk perception and social anthropology: critique of cultural theory.
Ethnos
61, 64–84.
Bord, R.J. and O’Connor, R.E., 1992. Determinants of risk perceptions of a hazardous
waste site.
Risk Anal.
12(3), 411–416.
Brenot, J., Bonnefous, S., and Marris, C., 1998. Testing the cultural theory of risk in
France.
Risk Anal.
18(6), 729–739.
Bradbury, J.A., 1994. Risk communication in environmental restoration programs.
Risk Anal.
14(3), 357–363.
Decker, D.J., Brown, T.L., Driver, B.L., and Brown, P.J., 1987. Theoretical developments
in assessing social values of wildlife: toward a comprehensive understanding
of wildlife recreation involvement, in D.J. Decker and G.R. Goff, (Eds.),
Val-
uing wildlife — economic and social perspectives
, 76–95. Westview Press, Boulder,
CO.
Douglas, M. and Wildavsky, A., 1982.
Risk and culture
. University of California Press,
Inc., Berkeley, CA.
EPA (U.S. Environmental Protection Agency). 1992.
Community relations in Superfund:
a handbook
. Office of Emergency and Remedial Response, U.S. EPA, Washing-
ton, D.C.
EPA (U.S. Environmental Protection Agency). 1995.
Guidance for assessing chemical
contaminant data for use in fish advisories: volume 4: risk communication.
Office
of Science and Technology, U.S. EPA, Washington, D.C.
Fiorino, D.J., 1990. Citizen participation and environmental risk: a survey of institu-
tional mechanisms.
Sci. Technol. Hum. Val.
15(2), 226–243.
Fischhoff, B., 1995. Risk perception and communication unplugged: twenty years of
process.
Risk Anal.
15(2), 137–145.
Fisher, A., 1998. The challenges of communicating health and ecological risks.
Hum.
Ecol. Risk Assess.
4(3), 623–626.
Flynn, J., Slovic, P., and Mertz, C.K., 1993. Decidedly different: expert and public
views of risks from a radioactive waste repository.
Risk Anal.
13(6), 643–648.
Flynn, J., Slovic, P., and Mertz, C.K., 1994. Gender, race, and perception of environ-
mental health risks
. Risk Anal.
14(6), 1101–1108.
Freudenberg, W.R. and Rursch, J.A., 1994. The risks of “putting the numbers in
context”: a cautionary tale.
Risk Anal.
14(6), 949–958.
Frewer, L.J., Howard, C., Hedderley, D., and Shepherd, R., 1996. What determines
trust in information about food-related risks? Underlying psychological con-
structs.
Risk Anal.
16(4), 473–486.
Greenberg, M.R., Sachsman, D.B., Sandman, P.M., and Salomone, C.L., 1989. Network
evening news coverage of environmental risk.
Risk Anal
9(1), 119–126.
3526_book.fm Page 245 Monday, February 14, 2005 1:32 PM
© 2005 by Taylor & Francis Group, LLC
246 Ecotoxicological testing of marine and freshwater ecosystems
Gregory, R. and Mendelsohn, R., 1993. Perceived risk, dread, and benefits.
Risk Anal.
13(3), 259–264.
Gustafson, P.E., 1998. Gender differences in risk perception: theoretical and method-
ological perspectives.
Risk Anal.
18(6), 805–811.
Harrington, J.M., 1998. Facts, fallacies, and fears: the public and the health profes-
sionals at odds.
Ann. Occup. Hyg.
42(4), 227–232.
Ibrekk, H. and Morgan, M.G., 1987. Graphical communication of uncertain quantities
to nontechnical people.
Risk Anal.
7(4), 515–529.
Johnson, B.B. and Slovic, P., 1995. Presenting uncertainty in health risk assessment:
initial studies of its effects on risk perception and trust.
Risk Anal.
15(4),
485–494.
Jungermann, H., Pfister, H R., and Fischer, K., 1996. Credibility, information prefer-
ences, and information interests.
Risk Anal.
16(2), 251–261.
Kapustka, L.A. and Landis, W.G., 1998. Ecology: the science versus the myth.
Hum.
Ecol. Risk Assess.
4(4), 829–838.
Kraus, N., Malmfors, T., and Slovic, P., 1992. Intuitive toxicology: expert and lay
judgments of chemical risks.
Risk Anal.
12(2), 215–232.
Landre, B.K. and Knuth, B.A., 1993. The role of agency goals and local context in
Great Lakes water resources public involvement programs.
Environ. Manage.
17(2), 153–165.
Lindell, M.K. and Perry, R.W., 1990. Effects of the Chernobyl accident on public
perceptions of nuclear plant accident risks.
Risk Anal.
10(3), 393–399.
Liu, S., Huang, J-C., and Brown, G.L., 1998. Information and risk perception: a
dynamic adjustment process.
Risk Anal.
18(6), 689–699.
Lundgren, R. and McMakin, A., 1998.
Risk communication: a handbook for communicating
environmental, safety, and health risks
. 2nd ed. Battelle Press, Inc. Columbus,
OH.
Lynn, F.M. and Busenberg, G.J., 1995. Citizen advisory committees and environmental
policy: what we know, what’s left to discover.
Risk Anal.
15(2), 147–162.
Marris, C., Langford, I., Saunderson, T., and O’Riordan, T., 1997. Exploring the “psy-
chometric paradigm”: comparisons between aggregate and individual anal-
yses.
Risk Anal.
17(3), 303–312.
Marris, C., Langford, I.H. and O’Riordan, T., 1998. A quantitative test of the cultural
theory of risk perceptions: comparison with the psychometric paradigm.
Risk
Anal.
18(5), 635–647.
McDaniels, T.L., 1998. Systemic blind spots: implications for communicating ecolog-
ical risk.
Hum. Ecol. Risk Assess.
4(3), 633–638.
McDaniels, T.L., Axelrod, L.J., Cavanagh, N.S. and Slovic, P., 1997. Perception of
ecological risk to water environments.
Risk Anal.
17(3):341–352.
Moen, J.E.T. and Ale, B.J.M., 1998. Risk maps and communication.
J. Hazardous Mater.
61, 271–278.
Otway, H. and von Winterfeldt, D., 1992. Expert judgment in risk analysis and
management: process, context, and pitfalls.
Risk Anal.
12(1), 83–93.
Peters, R.G., Covello, V.T., and McCallum, D.B., 1997. The determinants of trust and
credibility in environmental risk communication: an empirical study.
Risk
Anal.
17(1), 43–54.
Roberts, S.M., 1999. Practical issues in the use of probabilistic risk assessment.
Hum.
Ecol. Risk Assess.
5(4), 729–736.
Sandman, P.M., Weinstein, N.D., and Miller, P., 1994. High risk or low: how location
on a “risk ladder” affects perceived risk.
Risk Anal.
14(1), 35–45.
3526_book.fm Page 246 Monday, February 14, 2005 1:32 PM
© 2005 by Taylor & Francis Group, LLC
Chapter seven: Risk perception and public communications 247
Siegrist, M. and Cvetkovich, G., 2000. Perception of hazards: the role of social trust
and knowledge.
Risk Anal.
20(5), 713–719.
Slovic, P., 1987. Perception of risk.
Science.
236, 280–285.
Slovic, P., 1993. Perceived risk, trust, and democracy.
Risk Anal.
13(6), 675–682.
Slovic, P., 2001. The risk game.
J. Hazardous Mater.
86, 17–24.
Wright, G., Pearman, A., and Yardley, K., 2000. Risk perception in the U.K. oil and
gas production industry: are expert loss-prevention managers’ perceptions
different from those of members of the public?
Risk Anal.
20(5), 681–690.
3526_book.fm Page 247 Monday, February 14, 2005 1:32 PM
© 2005 by Taylor & Francis Group, LLC