Flocculation In Natural And Engineered Environmental Systems - Chapter 4 ppsx
Bạn đang xem bản rút gọn của tài liệu. Xem và tải ngay bản đầy đủ của tài liệu tại đây (620.35 KB, 24 trang )
“L1615_C004” — 2004/11/19 — 02:47 — page 71 — #1
4
The Composite Nature of
Suspended and Gravel
Stored Fine Sediment in
Streams: A Case Study of
O’Ne-eil Creek, British
Columbia, Canada
Ellen L. Petticrew
CONTENTS
4.1 Introduction 71
4.2 Methods 73
4.2.1 Study Area 73
4.2.2 Field Methods 74
4.2.3 Suspended Sediment Measurements 74
4.2.4 Settling Chamber Measurements 77
4.2.5 Infiltration Gravel Bags 78
4.2.6 Visual Characterization of Aggregate Particles 78
4.3 Results 79
4.4 Discussion 86
4.4.1 Fractal Concerns 89
4.5 Conclusions 90
Acknowledgments 91
References 91
4.1 INTRODUCTION
In the past decade there has been a concerted research emphasis on the structure,
settling, and storage of suspended sediments in freshwater riverine environments.
1–5
This body of work has recognized the significance of flocculation and aggregation
(terms which are used interchangeably in the literature) in riverine sediment transport
processes, and the concomitant implications for the storage of both sediments and
1-56670-615-7/05/$0.00+$1.50
© 2005 by CRC Press
71
Copyright 2005 by CRC Press
“L1615_C004” — 2004/11/19 — 02:47 — page 72 — #2
72 Flocculation in Natural and Engineered Environmental Systems
sediment-associated contaminants. While the mechanisms and factors regulating
flocculation, defined as the combination of two or more particles of mineral or organic
material to createlarger composite particles, have been research interestsin the marine
literature for decadesthey were only reported as being significantin natural freshwater
systems in the 1990s.
6–8
While the process of flocculation increases both the effective
size of the particle and modifies its density it has been shown that the propensity for
particle settling is influenced more by the particles altered size rather than its density
or porosity.
5
While the literature details the conditions or mechanisms which promote the
flocculation and aggregation of sediments in rivers (increased sediment concentra-
tions, increased collision encounters, decreased shear velocities, high ionic strength,
increased bacterial activity, and increased temperatures) there has also been some
effort in the literature to subdivide composite particles into two separate populations
comprising flocs and aggregates. Different processes and different composite struc-
tures have been suggested as a means to differentiate flocs and aggregates. Petticrew
and Droppo
9
differentiated flocs and aggregates by visual evaluation, with flocs being
characterized as irregularly shaped and porous while aggregates appeared opaque
and compact. It was postulated by them, and reiterated by Woodward et al.
10
that
the sources of the two structures were different with the fragile, loosely bound flocs
being formed in the water column while aggregates are delivered to the stream from
the catchment as robust, compact particles. Petticrew and Droppo
9
also considered
the fact that the floc structures stored in or on the gravels could be dewatered and
potentially become more compact due to biological processes or physical reworking.
Droppo et al.
11
have proposed a floc cycle for riverine composite particles that sug-
gested a downsizing and consolidation of particles with increased exposure to bed
shearing environments, indicating a change in structure over time spent in the river
system. While it may be important to determine the source of the composite types it
is also of interest to determine the relative abundance of aggregates and flocs in the
stream channel and to determine if they behave differently in the context of settling
and storage.
The objective of this chapter is toevaluate the morphology, settling behaviour, and
characteristics of composite sediments that are transported and stored in a relatively
undisturbed productive headwater stream. A case study of a highly productive salmon
bearing stream is presented here with both the hydrologically important and biolo-
gically important periods of the open water season being investigated over several
years. The focus of this chapter is the relationship of these changing environmental
conditions with the sediment particle populations in both the water column and gravel
storage. The changes in composite particle morphology and their resultant dynamic
characteristics (settling rate and densities) were evaluated temporally over a range of
open water conditions (May through October) while both the physical environment
(suspended sediment load, stream velocities, and shear stresses) and the biological
inputs to the stream changed.
Earlier work on O’Ne-eil Creek, reporting on the structure and composition of
suspended andgravel stored sediment, indicated that in these biologically active head-
water streams the fines(sediments < 63µm)were well flocculated.
3,12
The aggregates
or flocs exhibited maximum sizes 7 (suspended) to 14 (gravel stored) times greater
Copyright 2005 by CRC Press
“L1615_C004” — 2004/11/19 — 02:47 — page 73 — #3
Composite Nature of Suspended and Gravel Stored Fine Sediment 73
than the maximumsize of theconstituent inorganic material comprisingthe composite
structures.
3
Petticrew and Droppo
9
visually identified different composite structures
and observed that these loosely bound flocs and compact aggregates exhibited dif-
ferent settling behaviors and size ranges. As these data were collected during the
1996 die-off of 10,722 sockeye salmon (Oncorhynchus nerka) that had returned to
the stream to spawn, follow-up work was undertaken to evaluate the importance of
the biological and physical influence of the fish upon the morphometric and dynamic
properties of the sediment.
The hydrologically important period in terms of sediment transport in streams of
this region is the spring melt which occurs in late May. High flows on the rising limb
of this flood event scour and break down the armoured layer in this creek
13
mobilizing
the supply of channel surface and gravel stored finesediment. Terrestrial contributions
from the floodplain and from the headwater slopes are also observed during this
event. Cyclonic summer storms can also generate high intensity rainstorms which act
to move sediment intoand within the channel. The highflow spring meltevents exhibit
increased concentrations of suspended fine sediment, increased local shear stresses,
and contributions of organic matter which are predominantly terrestrially derived. It
was of interest to determine the resultant size, structure, and settling behavior of the
composite particle population generated by these interacting set of factors.
Alternately the influence of the dominant biological influence in the stream was of
concern, as this stream can have annual sockeye returns of up to 50,000, although on
average it receives approximately 10,000 per year.
13
The physical effect of the digging
of redds, or egg nests dug to about 25cm into the gravels, is to both modify the surface
morphology of the gravel bed and to resuspend the gravel stored fines,
14
possibly
many times in one spawning season. Following this major physical disturbance of
both the gravels and the water column, the fish die in the stream and decay in the
late summer low flows. The flux of organic matter to the stream is immense and
abrupt
15,16
as these salmon spawn in only the lower 2 km of the channel and die in
a period of about 10 days, resulting in a high unit area loading of fish breakdown
products. Petticrew and Arocena
17
observed a chemical signature of salmon flesh in
the gravel stored sediments, indicating that either the breakdown products or bacteria
with the salmon signatureareassociated with the fine grainedgravelstoredaggregates.
Given the potential role of organic matter and microbial activity in the generation
of composite particles this highly productive stream was seen as a good venue to
evaluate the effect of both the supply of organic matter and the physical disturbance
of spawning on the structure of flocs and aggregates being transported and stored in
streams.
4.2 METHODS
4.2.1 S
TUDY AREA
The O’Ne-eil Creek catchment is approximately 75 km
2
and is located in an experi-
mental forest in the central interior of northern British Columbia. It is a tributary to
the Middle River which drains into the Stuart Lake system which is well known for its
highly productive sockeye salmon runs. Fish escapements to streams in this region,
Copyright 2005 by CRC Press
“L1615_C004” — 2004/11/19 — 02:47 — page 74 — #4
74 Flocculation in Natural and Engineered Environmental Systems
including O’Ne-eil, have been monitored using counting fences for nearly 50 years.
The O’Ne-eil catchment drains part of the Hogem Range of the Omenica Mountains,
and has its mouth at 700 metres above sea level (masl) and its drainage divide at
approximately 1980 masl.
18
The channel is approximately 20 km in length with a
steep upper reach which drains well-developed cirques, a steeper middle reach that
passes through a rock-walled canyon, and a gentle, low gradient depositional reach in
the lower 2 km.
19
In the lower reaches of the stream, the channel bed is comprised of
clean gravel with very low concentrations of fine sediments, well suited for salmon
redds. This lower reach is underlain by fine grained glaciolacustrine sediments and
the only anthropogenic disturbance to date consists of a road (constructed in 1980)
which cuts through this material. This road bridges the stream and allows access
approximately 1500 m upstream of the river mouth. There has been no harvesting in
the catchment, so the system represents a nearly pristine environment.
4.2.2 FIELD METHODS
Data collected over five seasons of sampling are presented here comprising various
periods of 1995, 1996, 1997, 2000, and 2001. Within each year various hydrolo-
gical or biological events were sampled including spring melt floods, active salmon
spawning, post-spawning die-off, and low flows when no visual evidence of adult fish
were evident, which in this chapter is called post-fish, were represented. Table 4.1
identifies the events, the conditions, and the variables that were collected each year.
The conditions of sampling are characterized as either “ambient” or “resuspended”
with ambient conditions representing the undisturbed, natural suspended sediment
concentration conditions. In order to characterize the gravel stored fine sediment, a
resuspension technique that was an attempt torework the surface gravels using approx-
imately the same energy expended by spawning salmon, was used. Several minutes
after the collection of the ambient sample, a second sample of suspended sediment
was taken, following the disturbance, or mixing, of the top layer (0.04 to 0.06 m) of
gravels by afield assistant, positioned 3 to5 m upstreamof the collection site. This dis-
tance provided sufficient travel time for the resettling of heavier sand particles thereby
allowing the collected material to comprise the aggregated fine sediment stored within
the surface gravel matrix. In this chapter, that material is termed “resuspended gravel
stored fines.”
Stream velocities and depths at the time of sampling were determined using a
Swoffer current meter and are presented in Table 4.1.
4.2.3 SUSPENDED SEDIMENT MEASUREMENTS
Stream water with suspended sediment was collected approximately 10 cm below
the surface of the water in several large mouthed 1 l Nalgene bottles for the
determination of
(i) suspended particulate matter (SPM) concentration
(ii) the disaggregated or absolute particle size distribution (APSD)
(iii) the aggregated or effective particle size distribution (EPSD)
(iv) morphometric characteristics of the aggregated suspended sediment
population
(v) the fractal dimensions of the filtered particle population
Copyright 2005 by CRC Press
“L1615_C004” — 2004/11/19 — 02:47 — page 75 — #5
Composite Nature of Suspended and Gravel Stored Fine Sediment 75
TABLE 4.1
O’Ne-eil Creek Sampling Schedule, Conditions and Variables for Five Sample
Years
Year Date Event type
Conditions
sampled
Cumulative fish
return
SPM
(mg l
−1
)
Water depth (m)
and velocity
(m s
−1
)
SPM filter
fractals
Settling
chamber
sizing
Settling chamber
visual
characterization
1995 Aug. 2 Active spawn Ambient
26,456 11.70 0.20/0.26 N
a
Y
b
N
1996 Aug. 26 Die-off
Ambient
10,772 0.93 0.22/0.23 Y
N
N
Resupended gravel
stored fines
10,772 7.22 0.22/0.23 Y
Y
Y
1997 May 28 Spring meltrising limb Ambient
0 8.38 0.70/1.04 Y
Y
N
May 30 Spring melt risinglimb Ambient
0 6.79 0.77/1.59 Y
Y
N
Jun. 1 Spring meltrising limb Ambient
0 8.70 1.40/1.28 Y
Y
N
2000 Aug. 10 Active spawn Ambient
10,601 2.47 0.22/0.31 N
Y
Y
Resupended gravel
stored fines
10,601 15.73 0.22/0.31 N
Y
Y
2000 Aug. 12 Active spawn Ambient
10,709 3.76 0.21/0.28 Y
N
N
Resupended gravel
stored fines
10,709 7.12 0.21/0.28 Y
N
N
2000 Sep. 21 Post-fish
Ambient
10,890 0.69 0.26/0.35 Y
N
N
Resupended gravel
stored fines
10,890 15.48 0.26/0.35 Y
N
N
2000 Oct. 5 Post-fish
Ambient
10,890 1.00 0.20/0.29 Y
Y
Y
Resupended gravel
stored fines
10,890 20.89 0.20/0.29 Y
Y
Y
2001 Jul. 17 Pre-fish arrival Gravel stored
fines
0
Y Y
N
2001 Jul. 28 Early spawn
Gravel stored fines 8,211
Y Y
N
2001 Aug. 3 Mid-spawn
Gravel stored fines 10,931
Y Y
N
2001 Aug. 12 Die-off
Gravel stored fines 13,757
Y Y
N
2001 Aug. 16 Die-off
Gravel stored fines 13,892
Y Y
N
2001 Sep. 22 Post-fish
Gravel stored fines 13,893
Y Y
N
a
N = no samples analyzed.
b
Y = yes, samples analyzed.
Copyright 2005 by CRC Press
“L1615_C004” — 2004/11/19 — 02:47 — page 76 — #6
76 Flocculation in Natural and Engineered Environmental Systems
The water samples were returned to the laboratory and processed in a variety
of ways. SPM was determined gravimetrically by filtering a known volume of
water (commonly 1000 to 4000 ml, depending on concentration) onto preweighed
and preashed 47 mm diameter glass fiber filters. A second, smaller volume (100 to
1000 ml) was filtered through preweighed 0.8 µm Millipore cellulose-acetate filters.
These were used for determining the disaggregated inorganic grain size distribution
also known as the ASPD. The weighed, dried filters were ashed in a low-temperature
asher (<60
◦
C) and wet digested with an excess of 35% H
2
O
2
before analysis on
a Coulter counter.
20
A Coulter Multisizer IIE was used to determine the ASPD.
Results are expressed as a volume/volume concentration in ppm and are plotted
as smoothed histograms of log concentration versus log diameter.
20
The Multis-
izer was set to a lower detection limit of 0.63 µm and an upper detection limit of
1200 µm.
The EPSD was determined by filtering smaller volumes of water (10 to 100 ml,
depending on the sediment concentration) through 0.45µm Millipore filters at low
levels of suction (<80 kPa). Care in handing the collected water and in the filtering
process ensured minimal disturbance to the aggregate structures. EPSD was meas-
ured optically, using a method similar to that of de Boer
21
and reported in Biickert.
22
These filters were air dried, cut and mounted onto microscope slides to obtain particle
morphometrics using the BioQuant OS/2 image analysis system which was connected
to a microscope. The filtered particles were counted and characterized for perimeter,
area, long axis, equivalent spherical diameter (ESD) and circularity. The population
of particles counted per filter was in excess of 1000 and in most cases triplicate fil-
ters were analyzed to allow a determination of the variability. To obtain the ESPD,
the population’s equivalent spherical diameters were grouped into size classes which
correspond to the same intervals as the Coulter counter and plotted as volume/volume
concentration in parts per million against ESD. The lower limit of the image analysis
technique when linked to the microscope is an areal size of 5.4 µm
2
and presumably
the upper limit would be defined by the area of the filter visible at the given magnific-
ation setting which would be in the order of 100,000 µm
2
. However as the volume of
water filtered is often small, because this minimizes overlap of particles on the filter,
and because the probability of capturing the larger, rarer flocs is lower due to reduced
sample volume, this method tends to artificially restrict the upper limit of the size
spectra. For almost allfilters analyzed for this study, the maximum aggregate diameter
observed was of the order of 400 µm while larger aggregated particles (>700 µm)
were observed in the bigger sample volume of the same origin in the settling
chamber.
The morphometric parameters collected from the image analysis of the filtered
population of aggregates were used to determine the fractal dimension (D)ofthe
populations. D is a measure of the perimeter–area relationship for a set of objects.
Collections of natural objects tend to have a perimeter–area (P, A) relationship of
A ∝ P
2/D
.
23
Euclidean objects such as squares or circles have a D value of 1. Values
of D>1 indicate that as area increases, perimeter increases at a greater rate.
21,24
This means that these larger particles have more edge complexity and are less
Euclidean or evenly shaped. Fractal D values were determined from perimeter and
Copyright 2005 by CRC Press
“L1615_C004” — 2004/11/19 — 02:47 — page 77 — #7
Composite Nature of Suspended and Gravel Stored Fine Sediment 77
area relationships for populations of filtered aggregates as well as particle populations
sized and characterized in the settling chamber.
4.2.4 SETTLING CHAMBER MEASUREMENTS
The collection of a larger volume of suspended sediment to determine the fall
velocities and densities of suspended sediment structures employed a rectangular
plexiglass settling box (1.5 × 0.14 ×0.06 m) with two removable end caps that was
built to hold approximately 13 l of water. A scale was mounted on the outside back
wall of the settling chamber using white adhesive paper which aided in photograph-
ing and sizing particles. The settling chamber was aligned into the stream flow such
that water and suspended sediment passed through it. When a sample was required
the ends were capped and the box carried in a horizontal position to the side of the
creek, where it was placed vertically onto a stable platform 20 to 30 cm in front of a
35 mm single lens reflex (SLR) camera mounted on a tripod. After a period of sev-
eral minutes, during which fluid turbulence decayed, a series of timed photographs
were taken. Pairs of sequential images were then projected onto a large surface and
examined to identify individual flocs. The particle size, shape, and position in the
two images were determined using image analysis packages (Mocha and Bioquant)
allowing an estimate of the fall velocity.
In the spring of 1997, the same settling chamber was used to collect suspen-
ded sediment samples from the snowmelt flood events in O’Ne-eil Creek. Due
to the fast overbank flows at this time the box was lowered and returned to the
bridge platform using a winch system. The box was filled and capped by persons
standing in the stream. The photographic system employed in the field at this time
was a video capture system. A black and white digital camera (a charged-coupled
device — CCD), with a resolution of 512 × 512 pixels, was connected to a per-
sonal computer running Empix Imaging’s Northern Exposure software. This field
setup allowed an automated image grabbing system, which recorded the current time
(accurate to 10
−2
s) on each image. A run of 45 images could be grabbed in just over
a 90 sec. The resultant images had individual pixel resolution of 55 µm ±10 µm.
The images were then analyzed via a custom-developed
22
settling rate measurement
program.
Due to colder weather, and shorter day lengths that contributed to poor conditions
for outdoor photography, the samples from October 5, 2000 were collected in the
field but returned to the laboratory for analysis. In this case up to 12 l of ambient
and resuspended sediment-laden water was collected and introduced into the settling
chamber for analysis using the SLR camera.
Measurements of particle size and settling velocity for both the SLR and video
imaging method allowed for the derivation of particle Reynolds numbers as well as
particle density using theequationspresentedinNamer and Ganczarczyk.
25
The lower
resolution of particle diameters using these techniques was approximately 150 µm
while the upper limit would be defined by the field of view of the cameras, which
given the distance from the settling chamber allows a photographic image of a particle
with a long axis in excess of 10,000 µm.
Copyright 2005 by CRC Press
“L1615_C004” — 2004/11/19 — 02:47 — page 78 — #8
78 Flocculation in Natural and Engineered Environmental Systems
4.2.5 INFILTRATION GRAVEL BAGS
On July 13, 2001, twelve infiltration gravel bags were installed in two riffles near
the bridge site of O’Ne-eil Creek. A hole approximately 25 cm in depth was dug and
the gravels removed were cleaned through a 2 mm sieve. The bags are a modification
of the design presented by Lisle and Eads
26
and consist of watertight bags, with a
maximum volume of 10,000 cm
3
clamped onto a 20 cm diameter iron ring. The bag
is folded down on itself at the bottom of the hole, while straps attached to the ring are
placed along the sides of the hole and left at the gravel–water interface. The cleaned
gravel is then returned to the hole, being placed on top of the folded bag and left for
a known period of time to accumulate fine sediments in the intergravel spaces. The
bag traps were retrieved over a 71-day period following installation. The retrieval
dates (cf. Table 4.1) represent (i) the period before the fish return to the river to spawn
(July 17), (ii) the early spawn (July 28), (iii) mid-spawn (August 3), (iv) two dates
during the major fish die-off (August 12 and August 16), and (v) a sample when
there was no visual evidence of live or dead carcasses in the stream, termed post-fish
(September 22).
Upon retrieval a lid is placed over the surface gravels between the emergent
straps that are pulled up, moving the iron ring and the bag up through the gravels
ensuring a minimal loss of fine sediment. The gravels and water collected in the bags
were passed through a 2 mm sieve such that the finer sediment was collected in a
calibrated bucket. This material was mixed to resuspend all grain sizes, settled for
10 sec to allow the settling of large sands from the top water layer from which a
250 ml subsample was taken for use in the settling chamber. These gravel stored fine
sediments were introduced into the settling chamber which was filled with filtered
(0.45 µm) O’Ne-eil Creek water. The CCD digital video method of image collection
was used for these samples. Around 100–250 individual particles were tracked for
each set of bags, providing size and settling characteristics while larger populations
(n = 1000 to 2500) of particles photographed in the settling chamber were used
to determine morphometric characteristics of the total population of gravel stored
aggregated fine sediment.
4.2.6 VISUAL CHARACTERIZATION OF AGGREGATE PARTICLES
The images of particles captured in the settling chamber when the SLR camera is used
were very clear and distinct such that more detailed structure of individual particles
could be evaluated. It was obvious upon viewing the particles for the first time in
the year 1995 that some were opaque, appearing to exhibit no open pores while
others were a loose and open matrix of material attached together. In some cases the
aggregates were a combination of both of these forms. In 1996, we decided to label
each particle that we had tracked and for which we had estimated a settling velocity,
in order to determine if differences in settling behavior existed between these visual
subpopulations. The compact, opaque subset was termed compact particles while the
open, loose matrices were called flocs. The combination particles and those which we
were unable to define were classed in a group as mixed particles. A fourth subset was
added in the year 2000 as visual evaluation of the compact subpopulation indicated
Copyright 2005 by CRC Press
“L1615_C004” — 2004/11/19 — 02:47 — page 79 — #9
Composite Nature of Suspended and Gravel Stored Fine Sediment 79
that some dense, dark particles had visual indicators that they were organics or parts
of organisms. For further clarity these were separated and labeled compact-organic
particles.
4.3 RESULTS
The settling chamber was used for the first time in August 1995, sampling ambient
water during the active spawn of a very large return of salmon (26,456) to O’Ne-eil
Creek. On this first use, 23 individual particles were identified and tracked for 46
settling velocity determinations, but the data set was not characterized visually for
particle type (Table 4.2). The visual identification of floc and compact particles was
first undertaken and reported
9
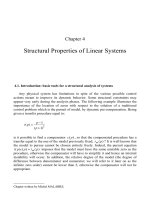
for the 1996 settling population. When the two sub-
populations (i.e., floc and compact particles) are plotted as diameter against density
(Figure 4.1) it is clear that while both floc and compact particle diameters range
between 300 to 1300 µm, the larger particles tend to be flocs and they exhibit lower
densities. In this data set flocs with the equivalent diameter as compact particles are
always of lower density. An exponential decrease of density with increasing size is
apparent for the compact particle population as it exhibits a wider range of densities.
Figure 4.2 shows the same general pattern for the August and October 2000 settling
data. The total population of settled particles exhibits the exponential decrease in
density with diameter more clearly than in the 1996 data in Figure 4.1. Note that a
third set of particles, visually identified as compact-organic, is also shown here. They
tend to fall into the central part of the size–density spectrum.
Table 4.2 provides a summary of particle numbers and types identified in
the ambient and resuspended settling chamber runs of 1996 and 2000. Visual
identification of particle types was not undertaken in 1995 or 1997. In each case
TABLE 4.2
Settling Chamber Image Analysis Characterization
Date Event Sample type
Number of
individual
particles
Percent
floc
Percent
compact
Percent
mixed
Aug. 2, 1995 Active spawn Ambient 23
a
N/A N/A N/A
Aug. 26+27, 1996 Die-off Resuspended 43
b
35 23 42
May 28+30, 1997 Spring melt rising
limb
Ambient 280 N/A N/A N/A
Aug. 10, 2000 Active spawn Ambient 117 7 75 18
Aug. 10, 2000 Active spawn Resuspended 113 13 77 10
Oct. 5, 2000 Post-fish Ambient 37 14 51 35
Oct. 5, 2000 Post-fish Resuspended 315 12 71 17
a
46 settling counts performed.
b
70 settling counts performed.
Copyright 2005 by CRC Press
“L1615_C004” — 2004/11/19 — 02:47 — page 80 — #10
80 Flocculation in Natural and Engineered Environmental Systems
Particle diameter (m)
0 500 1000 1500 2000
Particle density (g cm
–3
)
0.98
1.00
1.02
1.04
1.06
1.08
1.10
1.12
1.14
1.16
Floc particles
Compact particles
FIGURE 4.1 Size–density relationship for visually determined floc and compact particles
from resuspended gravel stored sediment during the salmon die-off of 1996.
Particle diameter (m)
0 200 400 600 800 1000 1200 1400 1600
Particle density (g cm
–3
)
0.9
1.0
1.1
1.2
1.3
1.4
1.5
Compact particles
Compact-organic particles
Floc particles
FIGURE 4.2 Size–density relationship for visually identified floc, compact and compact-
organic particles from both ambient and resuspended sediment in mid- and post-spawn of
2000. Note the separation of flocs and compact particles into the arms of the distribution.
when the particle subpopulations were differentiated the proportion of flocs never
comprise as much as half of the population, although the maximum value occurs in
the die-off period of 1996 when 35% were identified as flocs. Of note in Table 4.2
is the proportion of compact particles observed in the resuspended sediment in the
Copyright 2005 by CRC Press
“L1615_C004” — 2004/11/19 — 02:47 — page 81 — #11
Composite Nature of Suspended and Gravel Stored Fine Sediment 81
Particle diameter (m)
0 200 400 600 800 1000 1200 1400 1600
Settling velocity (mm s
–1
)
0
5
10
15
20
25
Oct 5 compact (resuspended)
Oct 5 compact (ambient)
Aug10 compact (resuspended)
Aug10 compact (ambient)
Oct 5 floc (resuspended)
Oct 5 floc (ambient)
Aug10 floc (resuspended)
Aug10 floc (ambient)
FIGURE 4.3 Settling velocities of aggregated particles observed in the ambient suspen-
ded and resuspended, gravel stored sediment in mid-spawn (August 10) and post-fish
(October 5) 2000.
active spawn and post-fish samples of 2000, calculated as 77% and 71%, respectively.
These values are similar to the 75% of compact particles observed in the ambient sus-
pended sediment during the active spawn of 2000. The ambient waters of the October
post-spawn period have only 51% compact particles in the suspended sediment.
When the data from August and October 2000 settling runs are plotted together
the different sizes and behaviors of the two populations are apparent (Figure 4.3). The
compact particles are generally smaller, all being <760 µm and tend to exhibit the
fastest settling rates with 6%actuallyexceedingthesettling rate of 100µm quartz sand
(8.7 mm s
−1
). The open matrix floc particles exhibit the largest sizes as indicated by
the fact that all particles in excess of 760 µm are identified as flocs that generally settle
at slower rates. Note that there are few large flocs in the ambient suspended sediments
of both August and October, but upon resuspension of the gravel stored sediment the
floc structures increase in number.
Table 4.3 summarizes the data from all available settling chamber runs and
provides statistics for the particle populations’ size (diameter), shape (sphericity),
and density by particle type where possible. The data for the relative abundance of
floc and compact particles indicates that in all but the die-off period compact particles
dominate both the suspended (ambient) and gravel stored (resuspended) samples. The
proportion offloc particlestracked for settling varied between 7% and 35% of the total
population. The percentage of flocs exceeded the compact particles only during the
fish die-off in August 1996. Once again it is clear that the compact particle sizes are
significantly smaller than floc sizes, as shown by viewing both the population means
and maximum diameters. The largest sizes occur in the resuspended gravel stored
sediments during the fish die-off of 1996. The compact particle population mean
during die-off is significantly larger (p = 0.05) than compact particles observed at
Copyright 2005 by CRC Press
“L1615_C004” — 2004/11/19 — 02:47 — page 82 — #12
82 Flocculation in Natural and Engineered Environmental Systems
TABLE 4.3
Size and Density Characterisation of Settling Chamber Particle Populations
Date Event
Sample
type
Particle
type
Percent of
total
population
Mean
diameter
and SE
a
(µm)
Maximum
diameter
(µm)
Smaller
diameter
%<500
(µm)
Larger
diameter
%>500
µm
Greater
density
%>1.10
gcm
−3
Lower
density
%<1.10
gcm
−3
Shape as
sphericity
and SE
Aug. 2, 1995 Active
spawn
Ambient Total
population
100 514 (58.2) 1162 52 48 42 58 N/A
Aug. 27, 1996 Die-off Resuspended Compact
23 704 (96.6) 1323 35 65 6 94 N/A
Floc 35 897 (107.8) 1828 6 94 0 100 N/A
May 28+30, 1997 Spring
melt rising
limb
Ambient Total
population
100 276 (6.5) 712 96 4 32 68 N/A
Aug. 10, 2000 Active Ambient Compact
75 342 (8.4) 685 96 4 10 90 0.62 (0.011)
spawn Floc 7 564 (31.8) 711 15 85 0 100 0.47 (0.025)
Aug. 10, 2000 Active
spawn
Resuspended Compact 77 365 (13.2) 723 86 14 30 70 0.63 (0.014)
Floc 13 685 (27.3) 954 0 100 0 100 0.56 (0.025)
Oct. 5, 2000 Post-fish Ambient Compact
51 384 (15.5) 515 95 5 11 89 0.67 (0.020)
Floc 14 791 (176) 1439 20 80 0 100 0.54 (0.058)
Oct. 5, 2000 Post-fish Resuspended Compact
71 400 (9.5) 752 79 21 22 78 0.67 (0.007)
Floc 12 816 (52.4) 1494 19 81 0 100 0.56 (0.020)
a
SE = standard error shown in brackets.
Copyright 2005 by CRC Press
“L1615_C004” — 2004/11/19 — 02:47 — page 83 — #13
Composite Nature of Suspended and Gravel Stored Fine Sediment 83
any other time. The spring melt rising limb population was not visually differentiated
into compact and floc particles but exhibits the lowest population particle diameter
mean and its maximum particle size is similar to that of resuspended gravel stored
compact particles of the active spawn of August 2000 and the post-spawn of October
2000. Note that the ambient active spawn particles (August 2000) exhibit the smallest
floc and compact sizes even though water velocities are similar to those observed in
September and October sampling periods (Table 4.1). In fact its maximum floc size is
slightly smaller than the maximum aggregate measured in the 1997 spring melt when
flows were four times as fast.
To differentiate size and density, each subpopulation was separated into size
categories based on a criterion diameter of 500 µm while low density and high
density particles were separated at 1.10 g cm
−3
. These values were selected as they
characterize the boundaries of the bulk of overlapping data points in Figure 4.2. In
Table 4.3 the floc subpopulations are classified as large (>80% of the particles always
exceed 500 µm) and low density (100% < 1.1 g cm
−3
). Compact particle subpopula-
tions tend to be comprised predominantly (>79%) of smaller (<500 µm) particles.
The exception is the 1996 die-off when larger compact particles comprised 65%
of the population with the other 35% being <500 µm. The compact particles also
predominate in the high density classification with 11 to 30% of their population
exhibiting densities >1.1 g cm
−3
, excluding the 1996 post-spawn die-off when only
6% were of higher density. Compact-organic particles were not included in this eval-
uation of compact particles but comprised a separate subpopulation not presented in
Table 4.3.
In the data sets that were also characterized for sphericity (all 2000 settling
runs) all floc populations are significantly less circular than the compact particles
(Table 4.3). While the floc shapes are not significantly different (p = 0.05) over time
or by source (suspended or gravel stored) the compact particles do exhibit differences
over time. The compact particles become significantly more rounded in the post-fish
ambient and resuspended samples.
Fractal (D) values and their 95% confidence limits for the population of particles
measured for settling velocities in 2000 are shown in Figure 4.4. A fractal value for
the total population is shown for each sample date as well as the fractal value for
the floc, compact and compact-organic particle subpopulations. The fractal values
for the total populations indicate that there is no significant difference by source
(ambient versus resuspended sediment) but there is by time, in that the suspended
(ambient) sediment has significantly smaller fractal values in October than in August
for the total population. Fractals for gravel stored (resuspended) sediment do not
vary significantly between these dates. An evaluation of the subpopulations indic-
ates that the floc and compact-organic particles exhibit a large amount of variation,
while the compact particles have smaller confidence limits, indicating less variability
in shape.
A similar fractal analysis of particles collected on filters is shown in Figure 4.5 for
the years 1996 through to 2000. The sampling dates are not graphed chronologically
by year, but rather grouped by date within the season so that the periods of spring
melt, active spawn, fish die-off, and post-spawn can be viewed consecutively. The
fractal values are lowest for the ambient suspended sediment of the spring melt period
Copyright 2005 by CRC Press
“L1615_C004” — 2004/11/19 — 02:47 — page 84 — #14
84 Flocculation in Natural and Engineered Environmental Systems
Fractal D
0.8
1.0
1.2
1.4
1.6
1.8
2.0
Total population
Floc
Compact
Compact organic
Aug 10 2000
Ambient
Aug 10 2000
Resuspended
Oct 5 2000
Resuspended
Oct 5 2000
Ambient
FIGURE 4.4 Fractal values for total particle populations and the visually identified subpop-
ulations for ambient and resuspended sediment in the mid-spawn (August 10) and post-fish
(October 5) periods of 2000. Error bars represent the 95% confidence intervals.
Fractal D
1.00
1.05
1.10
1.15
1.20
1.25
1.30
30/ 5/ 97–1/ 6/97 10/8/00 26/8/96 5/10/0021/9/00
Springmelt floods
Active spawn
Fish die-off
Post-fish presence
Sampling date
FIGURE 4.5 Fractal values for aggregates sampled and analyzed on filters over three years,
comprising four different bio-physical open water conditions. Dark bars represent ambient
suspended sediment conditions while lighter colored bars are resuspended, gravel stored fine
sediments. Error bars represent the 95% confidence intervals.
Copyright 2005 by CRC Press
“L1615_C004” — 2004/11/19 — 02:47 — page 85 — #15
Composite Nature of Suspended and Gravel Stored Fine Sediment 85
indicating that the particles are more rounded. In contrast to the results of the settling
particle fractal analysis (Figure 4.4) the D values for filtered suspended sediment
increase later in the season, becoming significantly less rounded during fish die-off
and in post-fish periods (Figure 4.5). In the active spawn sampled in August 2000, the
suspended and gravel stored fractals are not significantly different from each other.
These low D values represent more rounded particles and are similar statistically
to the suspended sediment of the spring melt flood and the gravel stored samples
throughout the full sampling season.
In 2001, gravel stored fine sediments collected from infiltration bags were intro-
duced into the settling chamber and analyzed for size, shape (fractal), and settling
characteristics (density). Table 4.4 shows these data along with the cumulative num-
ber of spawning fish returned to O’Ne-eil Creek by that date. Particle diameters were
largest pre-fish and post-fish with the smallest mean values occurring at mid-spawn.
Particle densities increased chronologically until die-off when they significantly
decreased. Density increases were significant again in the post-fish sediments. The
temporal pattern is that pre-spawn gravel stored aggregates are large and low density,
mid-spawn aggregates are small and high density while at seasons end (post-fish) the
gravel stored aggregates are again large but high density. While the fractal values
for all of the infiltration bag sediments are low, the smallest D values, representing
the roundest particles, were noted at mid-spawn and post-fish which is also when
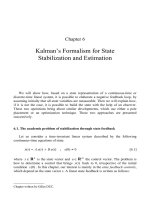
densities were highest. Figure 4.6 shows the changing pattern of fractal values over
time along with a temporal plot of the cumulative spawner numbers in 2001. This
indicates the number of individual fish having passed the counting fence by that
date. On August 3, when 10,931 have returned to the stream to rework the gravels
for redd construction the particles are more rounded than at all times except for
the period when no visual evidence of fish carcasses are apparent in the stream
(post-fish).
TABLE 4.4
Characteristics of Gravel Stored Fine Sediment Collected in Infiltration Bags
in 2001
Event type
Date in
2001
Cumulative
fish returns
Particle
diameter (µm)
Particle density
(gcm
−3
) Fractal D 95% CL D
Pre-fish arrival Jul. 17 0 332 (109) b 1.047 (0.033) a 1.060 0.009
Early spawn Jul. 28 8211 261 (112) a 1.092 (0.068) b 1.073 0.004
Mid-spawn Aug. 3 10931 244 (89) a 1.116 (0.079) c 1.052 0.007
Die-off Aug. 12 13757 262 (95)
a
a 1.032 (0.048)
a
a 1.063 0.004
Die-off Aug. 16 13892 1.061 0.004
Post-fish Sep. 21 13893 316 (157) b 1.121 (0.033) c 1.051 0.004
Note: Means (and standard deviations) of particle diameter and particle density are shown. In each column,
means followed by similar letters are not significantly different (p < 0.05).
a
Values in bold represent composite value for Aug. 12 and Aug. 16.
Copyright 2005 by CRC Press
“L1615_C004” — 2004/11/19 — 02:47 — page 86 — #16
86 Flocculation in Natural and Engineered Environmental Systems
Bag retrieval day number and date
0 20406080
Fractal D
1.00
1.02
1.04
1.06
1.08
1.10
Cumulative fish count in stream
0
2000
4000
6000
8000
10000
12000
14000
16000
Pre
spawn
Early
spawn
Major Die-off
Post
fish
July 17 July 28 Aug 3 Aug 12 Aug 16 Sept 22
Mid
spawn
FIGURE 4.6 Fractal values for fine sediment collected in infiltration gravel bags in the
summer of 2001 are shown as bars with the 95% confidence limits depicted. These sediment
populations (n > 1000) were characterized for size and shape from charge-coupled device
(CCD) images in the settling chamber. The 2001 cumulative fish count for O’Ne-eil Creek is
shown by sample date (dots).
4.4 DISCUSSION
The particle populations sampled in O’Ne-eil Creek have been shown to be highly
aggregated with floc factors (EPSD/APSD) exceeding ten.
3
All of the particles eval-
uated in this paper for size, morphology, and settling characteristics can be shown
to be aggregates as the maximum particle sizes of the disaggregated inorganic sed-
iment (APSD) of these samples do not exceed 130µm, while each of the particles
evaluated visually (EPS) was larger than 150 µm. The only particles which should
be considered separately in this context are the compact-organics as they in fact may
not be composite particles, but could be parts of organisms or aggregates of organism
parts. The organics are removed from the sediment sample before characterizing the
ASPD and so their constituent size is not determined.
Visual differentiation of aggregate particles in freshwater allowed an investigation
of the size, shape, and behavior of particle subpopulations identified as flocs and
compact particles. The loosely packed, open matrix floc particles are observed to be
larger, less dense, lessrounded, andslowersettlingthan the opaque, compactparticles.
They were noted to be less abundant than compact particles in all periods sampled
except for the fish die-off. While the smaller, rounder, denser compact particles are
carried in ambient low flow conditions (0.23 to 0.35 m s
−1
) their proportions are
smaller in the post-fish quiescent flows (79%) than in low flows with active spawning
Copyright 2005 by CRC Press
“L1615_C004” — 2004/11/19 — 02:47 — page 87 — #17
Composite Nature of Suspended and Gravel Stored Fine Sediment 87
occurring (93%). In the resuspended gravel stored sediment of active spawn and
post-fish they comprise 85% and 83%, respectively (Table 4.3). It is unfortunate
that the spring melt population could not be visually differentiated as the energy
environment of that period was high and both the proportion of floc and compact
particles would be of interest as well as their respective sizes and shapes.
In any case, the characteristics of the total population can still be useful as it
is clear that the particle size of the populations change over the open water sea-
son with the smallest mean sizes observed during spring melt when local flows are
deepest and fastest and the concentration of suspended sediment is higher (mean
of 7.96mg l
−1
) for this system. The shear stress measured in spring melt flows of
this scale in O’Ne-eil Creek has been reported as being approximately 70 N m
−127
which would act to break apart weakly bound aggregate structures resulting in smaller
mean and maximum population sizes as observed. Interestingly, aggregate particles
are small during the active spawn of 1995 and 2000, while the largest sizes were
observed during the die-off of fish in 1996. This variability in size occurs despite the
fact that measured water velocities, which reflect local shear stresses of approxim-
ately 6 N m
−1
at this site in O’Ne-eil Creek
27
were not very different during these
sample periods (Table 4.1). This implies that the activity of spawning fish resus-
pending sediment could be having a similar shearing effect. Evidence to support this
can be seen in the concentrations of suspended sediment during ambient flow con-
ditions. In 2000, the background concentrations were between 2.47 and 3.76 mg l
−1
after approximately 10,700 fish had entered the stream to spawn, while in 1995 the
ambient concentration was 11.70 mg l
−1
with 26,985 spawners in the stream. Undis-
turbed ambient suspended sediment concentrations are measured in O’Ne-eil Creek
as <1mgl
−1
. The physical activity of these fish in digging their redds results in the
reworking of the gravel bed, resuspension of the gravel stored fine sediments, and the
downstream transport and deposition of these fines. The energy imparted in moving
the gravels to release fine sediment, along with the action of being transported in the
turbulent water column before settling again, would act to break apart weakly held
structures, generating smaller and stronger and potentially more compact aggregates.
In the ambient flow of active spawn in August 2000 only 7% of the total popula-
tion of aggregate particles is loose floc structures. Alternately the largest aggregate
sizes as well as the largest abundance of floc structures (35%) are observed in the
salmon die-off period which exhibits low flow velocities with resuspended sediment
concentrations of 7.22 mg l
−1
. While these same low shear conditions and higher
resuspended particle concentrations are sampled in post-fish periods (September and
October 2000) the particle aggregates do not reach the same large sizes as during
die-off. Clearly some other environmental factor aside from shear velocities and sus-
pended sediment concentrations is controlling the size of these aggregate structures.
The changing size and density of the infiltration gravel bag particle populations also
supports the influence of the physical role of spawning salmon on the aggregate
size. Smallest mean population sizes at mid-spawn, which are also associated with
high densities, suggest that the smaller compact particles that predominate have been
collected in the infiltration bags during spawn. The larger less dense aggregates col-
lected in the bags earlier in the season have presumably been modified by the fish
spawning activity. While the particles stored in the gravel bed during salmon die-off
Copyright 2005 by CRC Press
“L1615_C004” — 2004/11/19 — 02:47 — page 88 — #18
88 Flocculation in Natural and Engineered Environmental Systems
are not statistically larger than at mid-spawn they are significantly less dense, which
corresponds to the higher proportionof low density flocsobserved in the water column
(Tables 4.3 and 4.4). This could reflect the fact that the larger floc particles are less
stable, breaking up when they enter the gravel matrix, or potentially being broken
into smaller particles by the physical action of sieving through 2 mm mesh when the
gravels are separated from the fines in the field.
The change in the particle composition and structure noted during fish die-off
is associated with a temporal change in the organic composition of the aggregates.
Petticrew and Arocena
17
reported on these same gravel stored samples and stated that
over the open water season the biofilms that cover gravel stored aggregates changed
from weak, web-like structures at mid-spawn to a less porous, film-like covering in
post-spawn. Thestronger more extensive biofilm was associated withlarge aggregates
while the weaker web structure existed when the aggregates were being exposed to
repetitive reworking of the gravel bed (e.g., resuspension) during mid-spawn.
The sediment moving in the spring melt has the lowest mean particle size as
well as the lowest fractal values, as determined from filtered samples (Figure 4.5).
The sediment moving in the melt is small, dense, and rounded. In an evaluation of
the filter fractals there is a significant decrease in D over the three day high flow
sampling period in 1997. The suspended sediment becomes more rounded with time,
indicating either a change of source
21
or a modification of the particle shape with
changing energy conditions. In Figure 4.5 there does not appear to be any signific-
ant differences between sediments resuspended from the gravel artificially over the
season and the ambient suspended sediment from the active spawn of 2000. This
would indicate that the sediments are from the same source, which we know to be
the case, and experiencing similar energy conditions. This then would support the
assumption that the energy imparted to the surface gravels to resuspend the stored fine
sediments is similar to the work perpetrated by the fish. To corroborate this effect of
physical resuspension note the timing of significant differences observed in the fractal
dimensions and structure of the infiltration gravel bag sediments over the 2001 sea-
son (Figure 4.6, Table 4.4). Particles are growing more amorphous from pre-spawn
through early spawn but then decrease in D values becoming rounder at the same
time as becoming smaller and denser at mid-spawn when the majority of the phys-
ical reworking of the bed has been completed. As this reworking abates and die-off
occurs, delivering carcass breakdown products to the stream the particle roundness
decreases, density decreases, and particle size starts to increase again.
The ambient suspended sediments analyzed from the filtered populations show
a significant increase in D following active spawn (Figure 4.5). This indicates that
these particles are more amorphous than those of active spawn but also less rounded
than the gravel stored sediment resuspended on the same dates. Intuitively this would
make sense as there is less energy in the low flow water velocities which could break
up the larger more amorphous particles.
In the post-spawn period the artificially resuspended (gravel stored) sediment has
similar fractal values as the material comprising the ambient suspended sediment
during the active spawn (August 2000) (Figure 4.5). This indicates that the material
resuspended by spawning fish which remains in the water column is similar in shape
to the gravel stored sediment later in the season. This is corroborated by looking at the
Copyright 2005 by CRC Press
“L1615_C004” — 2004/11/19 — 02:47 — page 89 — #19
Composite Nature of Suspended and Gravel Stored Fine Sediment 89
fractal results of the infiltration gravel bags (Table 4.4, Figure 4.6). The mid-spawn
and post-fish fractals indicate they are the roundest populations of particles over
the season, but as well they are the densest populations. Petticrew and Arocena
17
presented scanning electron microscope evidence indicating that these mid-spawn
aggregates were held together with a weak-looking web of biofilm while pre- and
post-spawn periods exhibited a more extensive coating of biofilm. The strength of
these biofilms may relate to the physical action these particles are exposed to (low
flows, active spawning) and could also play a role in regulating their size.
4.4.1 FRACTAL CONCERNS
Note that the fractal results for the filtered populations (Figure 4.5) are not the same as
is found in the fractal analysis of the settling chamber populations shown in Figure4.4.
In this latter data set there are no significant differences within the subpopulations by
either source (ambient versus resuspended) or date but there is a statistically smaller
D value for the total population of the ambient post-fish (October 2000) suspended
sediment as compared to the ambient active spawn samples. This indication that
the ambient suspended sediment is becoming more rounded with time is opposite
to the results of the filtered samples. A comparison of fractal values for samples
from the same date and source material indicates that the filtered particle populations
are always lower than the settling chamber populations. This would be a result of
both the larger number of particles that are counted by filters as well as the lack
of inclusion of the larger particles (>400 µm) which have the higher proportion of
amorphous, less rounded flocs. Inclusion of these bigger particles, which also exhibit
larger variability, increases the fractal value of the settling chamber populations as
seen in Figure 4.4. Another inconsistency is that the fractal values of the gravel
stored sediment (Figure 4.6) are consistently much lower than that of the resuspended
sediment shown in Figure 4.4, which is meant to represent the gravel stored sediment.
This could be a function of the artificially disturbed samples being mixed with low
concentrations of ambient sediment or the fact that the structure of the aggregates
changes with depth in the gravels. The infiltration gravel bags collect material stored
to a depth of approximately 25 cm while the artificial resuspension mobilizes only
the top 5 or 6 cm. In Figure 4.3 it is clear that the majority of large floc particles
are associated with the artificially resuspended gravel stored samples from August
and October 2000, as opposed to being abundant in the ambient suspended sediment.
Aside from periods of high flow, or just following scouring events, a layer of fine
grained loosely aggregated sediment is often observed to be coating the surface of
the channel.
28
These fine grained aggregates are more floc like than compact and are
easily resuspended and moved downstreamwith increases in entrainmentflows. These
aggregates would be collected in both the artificially resuspended and the infiltration
bag sediment sampling but would represent a larger portion of the population in
the artificially resuspended sample as it disturbs a larger surface area and smaller
depth of gravels. These surface fines would be less abundant in the gravel infiltration
bag samples as they are deeper (25 cm) and have a specific surface area sampled
(314 cm
2
). This bias of surface sampling would then result in higher fractal D values
Copyright 2005 by CRC Press
“L1615_C004” — 2004/11/19 — 02:47 — page 90 — #20
90 Flocculation in Natural and Engineered Environmental Systems
for the former (i.e., more amorphous) and lower D values, or more rounded particles
in the gravel bags as observed in this comparison.
As the fractal values presented here reflect the measurement of potentially dif-
ferent populations (e.g., sediment populations with different upper and lower size
limits as well as populations from different depths of gravel storage) care should be
taken to compare results of fractal analyses between methods. Changing the upper
and lower limits of the population analyzed in a fractal analysis has been found to
have a significant effect on the results. For the settling chamber samples the lower
limit was defined by the resolution of the image analysis technique (diameter approx.
150 µm) and the upper limit was not restricted. The regressions were always strong
(r
2
> 0.90) and significant, but the subpopulation sizes were not always very large
(n = 5 to 182). A test was done on the largest settling chamber data set (total popula-
tion, Oct 2000 resuspended, n = 315), where the sample was altered to include only
the aggregate population <600, <500, <400, and <300 µm in order to determine
the effect of the size limits on the fractal D values. While the D’s are not significantly
different as the upper size limit is reduced and the sample size becomes smaller, the
95% confidence limits increase resulting in reduced ability to distinguish statistical
differences. This observation is important if one plans to use fractals for identifying
source sediments or for implying processes affecting sediment structure. The results
of the filter population fractals presented in Figure 4.5 were analyzed using the same
method as de Boer and Stone
29
who identified source differences in suspended sedi-
ment during a spring melt period. The lower limits and presumably the upper limits
(as they are defined by the sampling technique) are similar to de Boer’s which are
detailed in his 1997 paper.
21
Using this method between 1,500 and 15,000 particles
can easily be counted ensuring a representative population size. In viewing this lower
end of the aggregate population (7 to 400 µm) we see significant differences over
a 3-day period in spring melt and a difference in the ambient suspended sediment
over the season. As the data for Figure 4.4 are comprised of subpopulations of quite
variable, and in some cases small sizes, these data would be considered problematic.
A better method of evaluating the fractal dimensions of these samples would be to
measure a large number of particles from the general population photographed in the
settling chamber as opposed to using just particles that have been tracked for settling
velocities. This approach was used to determine fractal values for the infiltration bag
fine sediments from 2001. An excess of 1,000 particles were sized to determine the
D values of the gravel stored sediment over the season. The fractal D values indicate
that on all dates the particles are very rounded with the only significant differences
being that the mid-spawn is rounder than the sample before it from early spawn and
that the final post-fish sample is roughly the same roundness as mid-spawn with a
significantly smaller D than in the period of fish die-off preceding it.
4.5 CONCLUSIONS
Visual differentiation of aggregated sediment particles both moving in the stream and
stored in the gravel bed indicates the presence of variable subpopulations of particle
types. The settling behavior of the particles is modified by their size, density, and
Copyright 2005 by CRC Press
“L1615_C004” — 2004/11/19 — 02:47 — page 91 — #21
Composite Nature of Suspended and Gravel Stored Fine Sediment 91
shape which appear to be modified by the hydrological, physical, and biological
conditions within the stream. Both the energy of turbulent streamflow and the energy
imparted by fish reworking the gravel bed are associated with a predominance of
small, denser compact particles. In periods when internal stream energy is lower and
when there is abundant organic matter delivery to the stream the composite structures
are largest and are comprised predominantly of loosely bound flocs.
While structural and behavioral differencesareassociatedwiththe differentevents
occurring in the system, a more complete investigation of the open water season,
incorporating storm events and summer base flows would be valuable. As well an
evaluation of thetypes of organic matter comprisingthe composite structures through-
out the season could potentially elucidate the processes which regulate the structure
and morphology of these particles.
ACKNOWLEDGMENTS
I would like to acknowledgethefield assistance of Simon Biickert, ChrisSpicer, Leslie
Chamberlist, Jenia Yanick, Dirk deBoer, Jen McConnachie, Beka McConnachie, and
Matt Riley. Various types of sample analysis and laboratory assistance were also
provided by Lito Arocena, Tim Milligan, Tauqeer Waqar, Leslie Chamberlist, and Jen
McConnachie. I would also like to thank Ian Droppo for many beneficial discussions
about flocs. Funding for this work was provided by National Science and Engineering
Research Council and Fisheries Renewal British Columbia.
REFERENCES
1. Kranck, K., et al., In situ particle size distributions resulting from flocculation
of suspended sediment, in Nearshore and Estuarine Cohesive Sediment Transport.
A. J. Metha, Ed., A.G.U. Washington, D.C., 1993, 60.
2. Droppo, I.G. and Ongley, E.D., Flocculation of suspended sediment in rivers of
southeastern Canada, Water Res., 28, 1799, 1994.
3. Petticrew, E.L., Sediment aggregation and transport in northern interior British
Columbian streams, in Erosion and Sediment Yield: Global and Regional Perspectives,
Walling, D.E. and Webb, B.W., Eds., Publ. 236, IAHS Press, Wallingford, 1996, 313.
4. Phillips, J.M. and Walling, D.E., The particle size characteristics of fine-grained
channel deposits in the River Exe Basin, Devon, UK, Hydrol. Process., 13, 1, 1999.
5. Droppo, I.G., Rethinking what constitutes suspended sediment, Hydrol. Process., 15,
1551, 2001.
6. Burban, P. et al., Settling speeds of flocs in freshwater and seawater, J. Geophys. Res.,
95, 213, 1990.
7. Ongley, E.D. et al., Cohesive sediment transport: Emerging issues for toxic chemical
management, Hydrobiologia, 235/236, 177, 1992.
8. Woodward, J.C. and Walling, D.E., A field sampling method for obtaining represent-
ative samples of composite fluvial suspended sediment particles for SEM analysis,
J. Sediment. Petrol., 62, 742, 1992.
9. Petticrew, E.L. and Droppo, I.G., The morphology and settling characteristics of
fine-grained sediment from a selection of Canadian rivers, in Contributions to the
Copyright 2005 by CRC Press
“L1615_C004” — 2004/11/19 — 02:47 — page 92 — #22
92 Flocculation in Natural and Engineered Environmental Systems
International Hydrological Programme V by Canadian Experts. IHP-V Technical
Documents in Hydrology. No 33, UNESCO, Paris, 2000, 111.
10. Woodward, J.C. et al., Composite suspended sediment particles and flocculation in
glacial meltwaters: Preliminary evidence from alpine and Himalayan basins, Hydrol.
Process., 16, 1735, 2002.
11. Droppo, I.G., Walling, D.E., and Ongley, E.D., Suspended sediment structure:
Implications for sediment and contaminant transport modeling, in Modelling Soil
Erosion, Sediment Transport andCloselyRelated HydrologicalProcesses,Summer W.,
Klaghofer E., and Zhang, W., Eds., IAHS Publ. 249, Wallingford, 1998, 437.
12. Petticrew, E.L., The influence of aggregation on storage of fine grained sediments
in salmon bearing streams, in Forest-fish Conference: Land Management Practices
Affecting Aquatic Ecosystems, Brewin, M.K. and Monita, D.M.A., Eds., Canadian
Forest Service Information Report NOR-X-356, Edmonton, 1998, 241.
13. Poirier, R., The effects of floods and sockeye salmon on stream bed morphology, M.Sc.
thesis, University of Northern British Columbia, Prince George, 2003.
14. Kondolf, G.M., Sale, M.J., and Wolman, M.G., Modification of fluvial gravel size by
spawning salmonids, Water Resour. Res., 29, 2265, 1993.
15. Ritchie, J.E., Perkins, M.A., and Goldman, C.R., Effects of kokannee salmon (Onco-
rhynchus nerka) decomposition on the ecology of a subalpine stream, J. Fish. Res.
Board Can., 32, 817, 1975.
16. Wold, A.K.F. and Hershey, A.E., Effects of salmon carcass decomposition on biofilm
growth and wood decomposition, Can. J. Fish. Aquat. Sci., 56, 767, 1999.
17. Petticrew, E.L. and Arocena, J.M., Organic matter composition of gravel-stored
sediments from salmon bearing streams, Hydrobiologia, 494, 17, 2003.
18. Macdonald, J.S., Scrivner, J.C., and Smith, G., The Stuart-Takla Fisheries/Forestry
Interaction Project, Can. Tech. Rep. Fish. Aquat. Sci. Publ. No. 1899, 1992.
19. Ryder, J.M., Stuart-Takla Watersheds: Terrain and Sediment Sources, Work Pap.
03/1995. British Columbia Ministry of Forests, Victoria, 1995.
20. Milligan, T.G. and Kranck, K., Electroresistance particle size analysers, in Principles,
Methods and Applications of Particle Size Analysis, Syvitski, J.P.M., Ed., Cambridge
University Press, 1991, 109.
21. de Boer, D.H., An evaluation of fractal dimensions to quantify changes in the mor-
phology of fluvial suspended sediment particles during baseflow conditions, Hydrol.
Process., 11, 415, 1997.
22. Biickert, S., The effect of pulp mill effluent on fine-grained sediment morphology and
storage in the Fraser River at Prince George, British Columbia, M.Sc. thesis, University
of Northern British Columbia, Prince George, 1999.
23. Mandelbrot, B.B., Passoja, D.E., and Paullay, A.J., Fractal character of fracture
surfaces of metals, Nature, 308, 721, 1984.
24. Krein, A., Petticrew, E.L., and Udelhoven, T., The use of fine sediment fractal dimen-
sions and colour to determine sediment sources in a small watershed, Catena, 53, 165,
2003.
25. Namer, J. and Ganczarczyk, J.J., Settling properties of digested sludge particle
aggregates, Water Res., 27, 1285, 1993.
26. Lisle, T.E. and Eads, R.E., Methods to Measure Sedimentation of Spawning Gravels.
USDA Forest Service, Research Note PSW 411, 1991.
27. McConnachie, J.L., Seasonal variability of fine-grained sediment morphology in a
salmon-bearing stream, M.Sc. thesis, University of Northern British Columbia, Prince
George, 2003.
Copyright 2005 by CRC Press
“L1615_C004” — 2004/11/19 — 02:47 — page 93 — #23
Composite Nature of Suspended and Gravel Stored Fine Sediment 93
28. Droppo, I.G.andStone, M., In-channel surficial fine-grained laminae (Part 1): Physical
characteristics and formational processes, Hydrol. Process., 8, 101, 1994.
29. de Boer, D.H. and Stone, M., Spatial and temporal variability in fractal dimensions of
suspended solids in two southern Ontario rivers, in Modelling Soil Erosion, Sediment
Transport and Closely Related Hydrological Processes, Summer, W., Klaghofer, E.,
and Zhang W., Eds., IAHS Publ. 249, Wallingford, 1998, 445.
Copyright 2005 by CRC Press
“L1615_C004” — 2004/11/19 — 02:47 — page 94 — #24
Copyright 2005 by CRC Press