Natural Wastewater Treatment Systems - Chapter 10 doc
Bạn đang xem bản rút gọn của tài liệu. Xem và tải ngay bản đầy đủ của tài liệu tại đây (1.16 MB, 41 trang )
493
10
On-Site Wastewater
Systems
Effluent disposal options for on-site systems range from soil absorption in con-
ventional gravity leachfields to water reuse after high-tech membrane treatment.
Individual on-site systems are the most prevalent wastewater management sys-
tems in the country. This chapter describes the various types of on-site wastewater
systems, wastewater disposal options, site evaluation and assessment procedures,
cumulative areal nitrogen loadings, nutrient removal alternatives, disposal of
variously treated effluents in soils, design criteria for on-site disposal alternatives,
design criteria for on-site reuse alternatives, correction of failed systems, and role
of on-site management systems.
10.1 TYPES OF ON-SITE SYSTEMS
While many types of on-site systems exist, most involve some variation of
subsurface disposal of septic tank effluent. The four major categories of on-site
systems are:
• Conventional on-site systems
•Modified conventional on-site systems
• Alternative on-site systems
• On-site systems with additional treatment
The most common on-site system is the conventional on-site system that consists
of a septic tank and a soil absorption system (see Figure 10.1). The septic tank
is the wastewater pretreatment unit used prior to on-site treatment and disposal.
Modified conventional on-site systems include shallow trenches and pressure-
dosed systems. Alternative on-site disposal systems include mounds, evapotrans-
piration systems, and constructed wetlands. Additional treatment of septic tank
effluent is sometimes needed, and intermittent and recirculating granular-medium
filters are often the economical choice. Where further nitrogen removal is
required, one or more of the alternatives for nitrogen removal (see Section 10.4)
may be considered. The types of disposal and reuse systems used for individual
on-site systems are presented in Table 10.1.
DK804X_C010.fm Page 493 Friday, July 1, 2005 4:52 PM
© 2006 by Taylor & Francis Group, LLC
494
Natural Wastewater Treatment Systems
10.2 EFFLUENT DISPOSAL AND REUSE OPTIONS
Alternative infiltration systems (presented in Table 10.2) have been developed to
overcome restrictive conditions such as:
•Very rapidly permeable soils
•Very slowly permeable soils
• Shallow soil over bedrock
• Shallow groundwater
• Steep slopes
• Groundwater quality restrictions
• Limited space
The alternatives for reuse of on-site system effluent include drip irrigation, spray
irrigation, groundwater recharge, and toilet flushing. Drip irrigation is becoming
more popular for water reuse and is described in this chapter. Spray irrigation is
more suited to larger flows (commercial, industrial, and small community flows)
and is described in detail in Chapter 8. Groundwater recharge, which is used in
areas of deep permeable soils, is also described in Chapter 8.
10.3 SITE EVALUATION AND ASSESSMENT
The process of selecting a suitable on-site location for on-site disposal involves
multiple steps of identification, reconnaissance, and assessment. The process
begins with a thorough examination of the soil characteristics, which include
permeability, depth, texture, structure, and pore sizes. The nature of the soil profile
and the soil permeability are of critical concern in the evaluation and assessment
of the site. Other important aspects of the site are the depth to groundwater, site
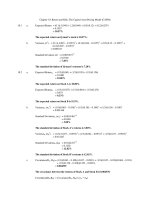
FIGURE 10.1
Typical cross-section through conventional soil absorption system.
Native soil backfill
Fabric or
building paper
6 in. minimum
12 in. minimum
4-in. distribution pipe
Side wall
absorption area
(both sides)
18–24 in. min
36-in. max
2-in. minimum
rock over pipe
6-in. minimum
rock under pipe
.75- to 2.5-in diameter
washed drainrock
DK804X_C010.fm Page 494 Friday, July 1, 2005 4:52 PM
© 2006 by Taylor & Francis Group, LLC
On-Site Wastewater Systems
495
slope, existing landscape and vegetation, and surface drainage features. After a
potential site has been located, the site evaluation and assessment proceeds,
generally in two phases: preliminary site evaluation and detailed site assessment.
TABLE 10.1
Types of On-Site Wastewater Disposal/Reuse Systems
Disposal/Reuse System Remarks
Conventional Systems
Gravity leachfields/conventional trench
Gravity absorption beds
Most common system
—
Modified Conventional Systems
Gravity leachfields:
Deep trench To get below restrictive layers
Shallow trench Enhanced soil treatment
Pressure-dosed:
Conventional trench To reach uphill fields
Shallow trench Uphill and shallow sites
Drip application Following additional treatment of septic tank
effluent; to optimize use of available land area
Alternative Systems
Sand-filled trenches Added treatment
At-grade systems Less expensive than mounds
Fill systems Import soil
Mound Systems
Evapotranspiration systems Zero discharge
Evaporation ponds See Chapter 4
Constructed wetlands Requires a discharge or subsequent infiltration (see
Chapter 7)
Reuse Systems
Drip irrigation Usually follows added treatment
Spray irrigation Requires disinfection
Graywater reuse —
Other Systems
Holding tanks Seasonal use alternative
Surface water discharge Allowed in some states following added treatment
DK804X_C010.fm Page 495 Friday, July 1, 2005 4:52 PM
© 2006 by Taylor & Francis Group, LLC
TABLE 10.2
Appropriate On-Site Disposal Methods To Overcome Site Constraints
Method
Soil Permeability
Bedrock
Groundwater
Slope
Small
Lot SizeVery Rapid
Moderately
Rapid Very Slow Shallow Deep Shallow Deep 0–5% >5%
Trenches • • • ••••
Beds ••••••
Pits • • ••••
Mounds • • • •••••••
Fill systems • • • •••••••
Sand-lined trenches
and beds
••• • ••••
Drained systems • • • • •
Evaporation ponds • • • •••••
ET beds • • • •••••
ETA beds • • • ••••
Spray irrigation • • • ••••••
Drip irrigation • • • ••••••
Note:
The symbol • indicates appropriate system; ET, evapotranspiration; ETA, evapotranspiration–absorption.
DK804X_C010.fm Page 496 Friday, July 1, 2005 4:52 PM
© 2006 by Taylor & Francis Group, LLC
On-Site Wastewater Systems
497
10.3.1 P
RELIMINARY
S
ITE
E
VALUATION
The initial step in conducting a preliminary site evaluation is to determine the
current and proposed land use, the expected flow and characteristics of the
wastewater, and to observe the site characteristics. The next step is to gather
information on the following characteristics:
• Soil depth
• Soil permeability (general or qualitative)
• Site slope
• Site drainage
• Existence of streams, drainage courses, or wetlands
• Existing and proposed structures
•Water wells
• Zoning
•Vegetation and landscape
10.3.2 A
PPLICABLE
R
EGULATIONS
When the pertinent data have been collected, the local regulatory agency should
be contacted to determine the regulatory requirements. The tests required for the
phase 2 investigation, which can include identifying depth to groundwater during
the wettest period of the year and permeability tests to determine water absorption
rates, can also be determined at this time. A list of typical regulatory factors for
on-site disposal is presented in Table 10.3.
TABLE 10.3
Typical Regulatory Factors in On-Site Systems
Factor Unit Typical Value
Setback distances (horizontal, separation from wells,
springs, surface waters, escarpments, site boundaries,
buildings)
ft (See Table 10.12)
Maximum slope for on-site disposal field % 25-30
Soil characteristics:
Depth ft 2
Percolation rate min/in. >1 to <120
Minimum depth to groundwater ft 3
Septic tank (minimum size) gal 750
Maximum hydraulic loading rates for leachfields gal/ft
2
·d 1.5
Maximum loading rates for sand filters gal/ft
2
·d 1.2
DK804X_C010.fm Page 497 Friday, July 1, 2005 4:52 PM
© 2006 by Taylor & Francis Group, LLC
498
Natural Wastewater Treatment Systems
10.3.3 D
ETAILED
S
ITE
A
SSESSMENT
The important parameters that require field investigation are soil type, structure,
permeability, and depth, as well as depth to groundwater. The use of backhoe pits,
soil augers, piezometers, and percolation tests may be required to characterize the
soil. Backhoe pits are useful to allow a detailed examination of the soil profile for
soil texture, color, degree of saturation, horizons, discontinuities, and restrictions
to water movement. Soil augers are useful in determining the soil depth, soil type,
and soil moisture, and many hand borings can be made across a site prior to the
siting of a backhoe pit location. Piezometers are occasionally required by regula-
tory agencies to determine the level and fluctuation of groundwater.
In most parts of the country, the results of percolation tests are used to
determine the required size of the soil absorption area. The allowable hydraulic
loading rate for the soil absorption system is determined from a curve or table
that relates allowable loading rates to the measured percolation rate. A typical
curve relating percolation rate to hydraulic loading rate for subsurface soil absorp-
tion systems is shown in Figure 10.2.
In the percolation test, test holes that vary in diameter from 4 to 12 in. (100
to 300 mm) are bored in the location of the proposed soil absorption area. The
bottom of the test hole is placed at the same depth as the proposed bottom of the
absorption area. Prior to measuring the percolation rate, the hole should be soaked
for a period of 24 hr. Tests and acceptable procedures used by local regulatory
agencies should be checked prior to site investigations.
FIGURE 10.2
Percolation rate vs. hydraulic loading rate for soil absorption systems.
(From Winneberger, J.H.T.,
Septic-Tank Systems: A Consultant’s Toolkit
. Vol. 1.
Subsurface
Disposal of Septic-Tank
Effluents
, Butterworth, Boston, MA, 1984. With permission.)
Ryonʼs line used
Ryonʼs line including all points
USPHS Study, troublefree system
USPHS Study, troubled system
Time for water surface to fall 1 inch (minutes)
Hydraulic loading rate (gal/ft
2
-d)
0 10 20 30 40 50 60 70 80 90 100
6
5
4
3
2
1
0
DK804X_C010.fm Page 498 Friday, July 1, 2005 4:52 PM
© 2006 by Taylor & Francis Group, LLC
On-Site Wastewater Systems
499
Although used commonly, the percolation test results, because of the nature
of the test, are not related to the performance of the actual leachfields. Many
agencies and states are abandoning the test in favor of detailed soil profile
evaluations. The percolation test is only useful in identifying soil permeabilities
that are very rapid or very slow. Percolation tests should not be used as the sole
basis for design of soil absorption systems because of the inherent inaccuracies.
10.3.4 H
YDRAULIC
A
SSIMILATIVE
C
APACITY
For facilities that are designed for larger flows than those generated by individual
households or for sites where the hydraulic capacity is borderline within the local
regulations, a shallow trench pump-in test or a basin infiltration test can be used.
The absorption test has been developed for wastewater disposal (Wert, 1997).
This procedure allows an experienced person to determine the site absorption
capacity. In the shallow trench pump-in test, a trench 6 to 10 ft (2 to 3 m) long
is excavated to the depth of the proposed disposal trenches. Gravel is placed in
a wooden box in the trench to simulate a leachfield condition. A constant head
is maintained using a pump, water meter, and float. The soil acceptance rate is
then calculated by measuring the amount of water that is pumped into the soil
over a period of 2 to 8 d.
10.4 CUMULATIVE AREAL NITROGEN LOADINGS
As described in Chapter 3, nitrogen forms can be transformed when released to
the environment. Because the oxidized form of nitrogen, nitrate nitrogen, is a public
health concern in drinking water supplies, the areal loading of nitrogen is important.
10.4.1 N
ITROGEN
L
OADING
FROM
C
ONVENTIONAL
E
FFLUENT
L
EACHFIELDS
The nitrogen loading from conventional leachfields depends on the density of
housing and the nitrogen in the applied effluent. The impact of the nitrate nitrogen
on groundwater quality depends on the nitrogen loading, the water balance, and
the background concentration of nitrate nitrogen. To determine the nitrogen
loading, the following procedure is suggested:
1. Determine the wastewater loading rate. The unit generation factor is
multiplied by the density of the units per acre; for example, 150-
gal/household
×
4 houses per acre yields 600 gal/d·ac.
2. Determine the nitrogen concentration in the applied effluent (use 60
mg/L).
3. Calculate the nitrogen loading. Multiply the nitrogen concentration by
the wastewater loading:
Nitrogen loading (lb/ac·d) =
L
×
N
c
×
C
×
10
–6
(10.1)
DK804X_C010.fm Page 499 Friday, July 1, 2005 4:52 PM
© 2006 by Taylor & Francis Group, LLC
500
Natural Wastewater Treatment Systems
where
L
=Wastewater loading (gal/ac·d).
N
c
= Nitrogen concentration (mg/L).
C=8.34 lb/gal.
10
–6
=Parts per million = mg/L.
4. In this example,
Nitrogen loading = (600 gal/ac·d)(60 mg/L)(8.34)(10
–6
)
= 0.30 lb/ac·d (135 gal/ac·d)
10.4.2 C
UMULATIVE
N
ITROGEN
L
OADINGS
The loadings of nitrate nitrogen to the groundwater are reduced by denitrification
in the soil column. As indicated in Chapter 8, denitrification depends on the
carbon available in the soil or the percolating wastewater and on the soil perco-
lation rate. For sandy, well-drained soils, the denitrification fraction is 15%. For
heavier soils or where high groundwater or slowly permeable subsoils reduce the
rate of percolation, the denitrification fraction can be estimated at 25%. The
percolate nitrate concentration can be calculated from Equation 10.2:
N
p
= N
c
(1 –
f
) (10.2)
where
N
p
= Nitrate nitrogen in the leachfield percolate (mg/L).
N
c
= Nitrogen concentration in the applied effluent (mg/L).
f
= Denitrification decimal fraction (0.15 to 0.25).
Example 10.1. Nitrogen Loading Rate in On-Site Systems
A local environmental health ordinance limits the application of septic tank
effluent on an areal basis to 45 g/ac·d. Determine the housing density with
conventional septic tank effluent–soil absorption systems that will comply with
the ordinance. Assume a total nitrogen content in the septic tank effluent of 60
mg/L and a household wastewater generation of 175 gal/d.
Solution
1. Determine the acceptable loading rate in lb/ac·d:
N
L
= 45 g/ac·d
×
1/454 g/lb = 0.099 lb/ac·d
2. Calculate the corresponding wastewater application rate using Equation
10.1:
L
= Nitrogen loading/(nitrogen concentration
×
8.34)(10
–6
)
L
= 0.099 lb/ac·d/(60 mg/L
×
8.34 lb/gal)(10
–6
)
L
= 197.8 gal/ac·d
DK804X_C010.fm Page 500 Friday, July 1, 2005 4:52 PM
© 2006 by Taylor & Francis Group, LLC
On-Site Wastewater Systems
501
3. Determine the number of households per acre:
Households per acre =
L
/175 gal/d = 1.13
4. Calculate the minimum lot size for compliance:
Lot size = 1/1.13 = 0.88 ac
Comment
This would be a very conservative ordinance. If a 25% denitrification fraction
were recognized in the ordinance, the nitrogen loading rate would be increased
to 60 g/ac·d.
10.5 ALTERNATIVE NUTRIENT
REMOVAL PROCESSES
Alternative nutrient removal processes have been and continue to be developed
for the cost-effective control of nutrients from on-site systems. Nitrogen removal
is the most critical of the nutrients because nitrogen can have public health effects
as well as eutrophication and toxicological impacts. A large group of attached
growth and suspended growth biological systems are available for pretreatment
(Tchobanoglous et al., 2003). A listing of attached growth bioreactors used with
on-site systems is presented in Table 10.4.
10.5.1 N
ITROGEN
R
EMOVAL
Removal of nitrogen is a critical issue in most on-site disposal systems. On-site
nitrogen removal processes include intermittent sand filters and recirculating
granular medium filters, as well as septic tanks with attached growth reactors
(internal trickling filters in septic tanks).
10.5.1.1 Intermittent Sand Filters
As described in Chapter 5, intermittent sand filters are shallow beds (2 ft thick)
of fine to medium sand with a surface distribution system and an underdrain
system. In the late 1880s, many Massachusetts communities used the intermittent
sand filter (ISF) to treat septic tanks effluent (Mancl and Peeples, 1991). The
ISFs were the forerunners of rapid infiltration and vertical flow wetlands, with
hydraulic loading rates of 0.48 to 2.77 gal/d·ft
2
(19 to 113 mm/d).
A typical ISF is shown in Figure 10.3. Septic tank effluent is applied inter-
mittently to the surface of the sand bed. The treated water is collected an under-
drain system that is located at the bottom of the filter. Intermittent filters are either
open or buried, but the majority of on-site ISFs have buried distribution systems.
The treatment performance of ISF systems is presented in Table 10.5. Suspended
solids and bacteria are removed by filtration and sedimentation. BOD and ammo-
nia are removed by bacterial oxidation. Intermittent application and venting of
DK804X_C010.fm Page 501 Friday, July 1, 2005 4:52 PM
© 2006 by Taylor & Francis Group, LLC
502
Natural Wastewater Treatment Systems
the underdrains help to maintain aerobic conditions within the filter. Denitrifica-
tion can be enhanced by flooding the underdrains.
The key design factors for ISFs are sand size, sand depth, hydraulic loading
rate, and dosing frequency. The smaller sand sizes (0.25 mm) generally cause
eventual failure due to clogging and therefore require periodic raking to remove
solids. With buried systems the medium sands (0.35 to 0.5 mm) can result in
long-term operation without raking or solids removal, providing the hydraulic
loading rate is kept around 1.2 gal/d·ft
2
or less (<50 mm/d). The sand must be
washed and free of fines (Crites and Tchobanoglous, 1998). Typical design criteria
for ISFs are presented in Table 10.6.
10.5.1.2 Recirculating Gravel Filters
The recirculating sand filter was developed by Michael Hines (Hines and Favreau,
1974). The modern recirculating filter uses fine gravel, as shown in Figure 10.4.
TABLE 10.4
Types of Trickling Biofilter Media for Pretreatment of On-Site
System Wastewater
Granular Media Biofilters
Organic Media
Biofilters
Synthetic Media
Biofilters
Activated carbon
AIRR (alternating intermittent recirculating
reactor)
Ashco-A RSF III™
Crushed brick
Envirofilter™ modular recirculating media
filter
Eparco
Expanded aggregate
Glass (crushed)
Glass (sintered)
Gravel (recirculating gravel filter [RGF])
Phosphex™ system
RIGHT
®
Sand
Stratified sand
Slag
Zeolite
Ecoflow
®
ECO-PURE Peat
Peat moss
Puraflo
®
peat
Woodchip trickling
Advantex
Aerocell
Bioclere
Rubber (shredded tires)
SCAT™
Septi Tech
Waterloo
Source:
Leverenz, H. et al.,
Review of Technologies for the Onsite Treatment of Wastewater in
California
, Report No. 02-2, prepared for the California State Water Resources Control Board,
Sacramento, CA, Department of Civil and Environmental Engineering, University of California,
Davis, 2002.
DK804X_C010.fm Page 502 Friday, July 1, 2005 4:52 PM
© 2006 by Taylor & Francis Group, LLC
On-Site Wastewater Systems
503
A recirculation tank is used to allow multiple passes of wastewater over the bed.
A valve in the recirculation tank allows filtered effluent to be discharged. Recir-
culating fine gravel filters (RFGFs) use coarser media and higher hydraulic
loading rates than ISFs. The performance of RFGFs is presented in Table 10.7.
Recirculating gravel filters can nitrify effectively (over 90%). One consideration
in nitrification, particularly with ammonia levels that can exceed 60 mg/L, is
adequate alkalinity in the applied wastewater. As ammonia is nitrified, 7 mg of
alkalinity is destroyed for every 1 mg of ammonia oxidized to nitrate. Denitrifi-
cation will recover a portion of the alkalinity, but lack of alkalinity in a soft, low-
alkalinity wastewater may cause the pH to drop, which will impact the ability to
FIGURE 10.3
Schematic of an intermittent sand filter: (a) plan view, and (b) profile of
a 2-ft-deep sand filter. (Courtesy of Orenco Systems, Inc., Sutherlin, OR.)
12 in.
1.25-in. PVC manifold
4-in. slotted
PVC pipe
From septic tank
Distribution valve
(a) Plan view
(b) Typical cross-section
Filter fabric
PVC lateral with
orifice shields
Air coil system
Flushing valve
Valve box
Air coil (if used)
To drainfield or
pump vault
30-mil
PVC liner
4-in. slotted PVC
underdrain pipe
0.5- to 0.75-in. rock
0.375-in. pea gravel
Filter sand
0.5- to 0.75-in. rock
0.75-in. PVC lateral with 0.125-in.
orifices facing upward
Air coil (optional)
Flushing valve
housing
18 ft
To drainfield
or pump basin
30-mil PVC liner
24 in.
12 in.
Orifice
20 ft
24 in.
DK804X_C010.fm Page 503 Friday, July 1, 2005 4:52 PM
© 2006 by Taylor & Francis Group, LLC
TABLE 10.5
Performance of Intermittent Sand Filters
Location (Ref.)
Effective
Sand Size
(mm)
Loading Rate
(gal/ft
2
·d)
BOD
5
Total Nitrogen
Influent
(mg/L)
Effluent
(mg/L)
Percent
Removal
(%)
Influent
(mg/L)
Effluent
(mg/L)
Percent
Removal
(%)
Florida (Grantham et al., 1949) 0.25–0.46 1.7–4.0 148 14 90 37 32 14
Florida (Furman et al., 1955) 0.25–1.04 2.0–13.0 57 4.8 92 30 16 47
Oregon (Ronayne et al., 1984) 0.14–0.3 0.33–0.88 217 3.2 98 58 30 48
Stinson Beach, California (Nolte Associates, 1992a) 0.25–0.3 1.23 203 11 94 57 41 28
University of California, Davis (Nor, 1991) 0.29–0.93 1.0–4.0 82 0.5 99 14 7.2 47
Paradise, California (Nolte Associates, 1992a) 0.3–0.5 0.5 148 6 96 38 19 50
Placer County, California (Cagle and Johnson, 1994)
0.25–0.65 1.23 — 2 98 — 37 40
Gloucester, Maine (Jantrania et al., 1998) 0.8 86 — 15 — — 61.3 —
DK804X_C010.fm Page 504 Friday, July 1, 2005 4:52 PM
© 2006 by Taylor & Francis Group, LLC
On-Site Wastewater Systems 505
completely nitrify the wastewater. The design criteria for recirculating gravel
filters are presented Table 10.8.
10.5.1.3 Septic Tank with Attached Growth Reactor
This system involves a small trickling filter unit placed above the septic tank.
Septic tank effluent, which is pumped over the filter, is nitrified as it passes
TABLE 10.6
Design Criteria for Intermittent Sand Filters Treating Septic
Tank Effluent
Design Factor Unit Range Typical
Filter Medium
Material Medium sand
Effective size mm 0.25–0.75 0.35
Uniformity coefficient U.C. <4 3.5
Depth in. 18–36 24
Underdrain Bedding
Type Gravel or stone Gravel
Size in. 0.375–0.75 0.5
Underdrain Piping
Type Slotted Perforated
Size in. 3–4 4
Slope % 0–1 0
Pressure Distribution
Pipe size in. 1–2 1.5
Orifice size in. 0.125–0.25 0.125
Head on orifice ft 3–6 5
Lateral spacing ft 1.5–4 2
Orifice spacing ft 1.5–4 2
Design Parameters
Hydraulic loading
a
gal/ft
2
·d 0.6–1.5 1.25
BOD loading lb/ft
2
·d 0.0005–0.002 <0.001
Dosing frequency times/d 4–24 16
Dosing tank volume days flow 0.5–1.5 1.0
Filter medium temperature °F — <41
a
Based on peak flow.
DK804X_C010.fm Page 505 Friday, July 1, 2005 4:52 PM
© 2006 by Taylor & Francis Group, LLC
506 Natural Wastewater Treatment Systems
through and over the plastic medium. The system is shown schematically in
Figure 10.5. A number of experimental units have been installed in septic tanks.
The best performance with a plastic trickling filter medium has been achieved
with a hydraulic loading rate of 2.5 gal/min (9.5 L/min) over a unit 3 ft (0.9 m)
deep containing hexagonally corrugated plastic with a surface area of 67 ft
2
/ft
3
(226 m
2
/m
3
). A total nitrogen removal of 78% has been reported with an effluent
nitrogen concentration of less than 15 mg/L (Ball, 1995). The performance of
these systems is summarized in Table 10.9. Recent studies have shown the
variability of performance (Loomis et al., 2004). Alternative filter media that have
FIGURE 10.4 Recirculating gravel filter.
SEPTIC
TANK
RECIRCULATING
FINE GRAVEL
FILTER
FUTURE
REPLACEMENT
AREA
PEA GRAVEL
FINE GRAVEL
RECIRCULATING/
MIXING TANK
DRAINFIELD
System Schematic
Typical Cross-Section
Plan View
DISTRIBUTION PIPE
CONCRETE
OR 30-MIL
PVC LINER
4-IN. UNDERDRAIN LEADING TO A
RECIRCULATING/MIXING TANK
DRAINROCK
10ʼʼ
24”
12”
DK804X_C010.fm Page 506 Friday, July 1, 2005 4:52 PM
© 2006 by Taylor & Francis Group, LLC
On-Site Wastewater Systems 507
been tested include the foam medium used in the Waterloo filter and the textile
chips used in the textile bioreactor.
10.5.1.4 RSF2 Systems
In the RSF2 system, a recirculating sand filter is used for nitrification and is
combined with an anaerobic filter for denitrification (Sandy et al., 1988). A flow
diagram for the RSF2 system is presented in Figure 10.6. Septic tank effluent is
discharged to one end of a rock storage filter, which is directly below and in the
same compartment as the RSF. Septic tank effluent flows horizontally through the
TABLE 10.7
Analysis of Volume per Dose for Various Hydraulic Loading Rates
and Dosing Frequencies for Intermittent Sand Filters
a
Hydraulic
Loading Rate
(gal/ft
2
·d)
Dosing
Frequency
(times/d)
Hydraulic Application Rate
Field Capacity
Filled
(%)
b
(mm/dose) (gal/ft
2
·dose)
11401 217
220 0.5 107
410 0.25 53
85 0.12 26
12 3.3 0.083 18
24 1.67 0.042 9.0
21812 427
240 1 217
420 0.5 107
810 0.25 53
12 6.75 0.12 26
24 3.38 0.083 18
41163 4 855
282 2 427
441 1 217
820 0.5 107
12 14 0.33 71
24 6.79 0.17 36
a
For 1 ft
2
of surface area and depth of 1.25 ft.
b
Five% as volumetric water content (water volume/total volume) (Bouwer, 1978).
Source: Crites, R.W. and Tchobanoglous, G., Small and Decentralized Wastewater Manage-
ment Systems, McGraw-Hill, New York, 1998. With permission.
DK804X_C010.fm Page 507 Friday, July 1, 2005 4:52 PM
© 2006 by Taylor & Francis Group, LLC
TABLE 10.8
Performance of Recirculating Gravel Filters
Location (Ref.)
Effective
Medium Size
(mm)
Loading
Rate
(gal/ft
2
·d)
BOD
5
Total Nitrogen
Influent
(mg/L)
Effluent
(mg/L)
Percent
Removal
(%)
Influent
(mg/L)
Effluent
(mg/L)
Percent
Removal
(%)
Michigan (Loudon et al., 1984) 0.3 3.0 240 25 90 92 34 60
Oregon (Ronayne et al., 1984) 1.2 1.45 217 2.7 99 58 32 45
Paradise, California (Nolte Associates, 1992) 3.0 4.4 134 12 91 63 35 44
Paradise, California (Nolte Associates, 1992) 3.0 2.5 60 8 87 57 26 54
Martinez, California (Crites et al., 1997) 3.0 3.0 — <5 96 — 12.6 80
Minnesota (Christopherson et al., 2001) — 5.0 — 18 93 — 43 47
Gloucester, Massachusetts (Jantrania et al., 1998) — 3.0 — 7 96 — 60.8 36
Source: Adapted from Reed et al. (1995) and Leverenz et al. (2002).
DK804X_C010.fm Page 508 Friday, July 1, 2005 4:52 PM
© 2006 by Taylor & Francis Group, LLC
On-Site Wastewater Systems 509
rock and enters a pump chamber at the other end. The septic tank effluent is pumped
over the RSF, where it is nitrified. Filtrate is collected from near the top of the
rock storage filter, directed into a second pump chamber, and returned to the
anaerobic environment of the septic tank, where raw wastewater can serve as a
carbon source for denitrification. A portion of effluent from the second pump
chamber is discharged for disposal. Experiments with the RSF2 system produced
nitrogen removals of 80 to 90%. Total nitrogen concentrations in the effluent ranged
from 7.2 to 9.6 mg/L (Sandy et al., 1988). The rock storage zone, filled with 1.5-
in. (38-mm) rock, was effective in promoting denitrification. An alternative mod-
ification is to add the fixed medium (plastic, textile sheets) for biomass growth into
the recirculation tank. Nitrified effluent from the recirculating sand filter is mixed
with the incoming septic tank effluent and flows past the attached biomass, where
any residual dissolved oxygen is consumed rapidly and the nitrate is denitrified
using the organic matter in the septic tank effluent as the carbon source.
10.5.1.5 Other Nitrogen Removal Methods
Other types of media have been used in bioreactors, including crushed glass,
sintered glass, expanded aggregate, and crushed brick (Leverenz et al., 2002).
The performance of three of these media filters is presented in Table 10.10. Other
nitrogen methods that have been conceptualized include ammonia removal by
ion exchange and nitrogen removal by denitrification in soil trenches. Attempts
have been made to remove ammonia by ion exchange using zeolite at Los Osos,
California, and other locations (Nolte Associates, 1994). The attempts have been
generally unsuccessful to date because of inadequate volumes of zeolite used and
the high cost of frequent regeneration or replacement of the ion exchange medium.
FIGURE 10.5 Septic tank with attached-growth reactor for the removal of nitrogen.
(Courtesy of Orenco Systems, Inc., Sutherlin, OR.)
Spray nozzle
Trickling filter
medium
Effluent
Dosing pump for
trickling filter
Effluent pump
Influent
DK804X_C010.fm Page 509 Friday, July 1, 2005 4:52 PM
© 2006 by Taylor & Francis Group, LLC
510 Natural Wastewater Treatment Systems
TABLE 10.9
Design Criteria for Recirculating Gravel Filters
Design Factor Unit Range Typical
Filter Medium
Effective size in. 1–5 2.5
Depth in. 18–36 24
Uniformity coefficient U.C. <2.5 2.0
Underdrains
Size in. 3-4 4
Slope % 0–0.1 0
Pressure Distribution
Pipe size in. 1–2 1.5
Orifice size in. 1/8–1/4 1/8
Head on orifice ft 3–6 5
Lateral spacing ft 1.5–4 2
Orifice spacing ft 1.5–4 2
Design Parameters
Hydraulic loading
a
gal/ft
2
·d 3–5 4
BOD loading lb/ft
2
·d 0.002–0.008 <0.005
Recirculation ratio Unitless 3:1–5:1 4:1
Dosing Times
Time on min <2–3 <2–2
Time off min 15–25 20
Dosing
Frequency times/d 48–120 —
Dosing tank volume flow/d 0.5–1.5 1
a
Based on peak flow.
FIGURE 10.6 Flow diagram for RSF2 system for the removal of nitrogen.
Wastewater
from
residence
Septic
tank
Rock
storage
filter
Pump
basin no.1
Pump
basin no. 2
Sand
filter
To
disposal
DK804X_C010.fm Page 510 Friday, July 1, 2005 4:52 PM
© 2006 by Taylor & Francis Group, LLC
On-Site Wastewater Systems 511
10.5.2 PHOSPHORUS REMOVAL
Phosphorus removal is seldom required for on-site systems; however, when it is
required, the soil mantle is the most cost-effective place to remove and retain
phosphorus (see Chapter 8). Attempts to remove phosphorus in peat beds have
usually been unsuccessful unless iron or limestone is present or added to the bed.
In Maryland, the use of iron filings plowed into the peat bed was successful in
removing phosphorus.
10.6 DISPOSAL OF VARIOUSLY
TREATED EFFLUENTS IN SOILS
The disposal of partially treated wastewater into soils involves two major con-
siderations: (1) treatment of the effluent so it does not contaminate surface or
groundwater, and (2) hydraulic flow of the effluent through the soil and away
from the site. Pretreatment of the raw wastewater affects the degree of treatment
that the soil–aquifer must achieve after the pretreated effluent is applied to the
soil absorption system. Treatment of wastewater in soil has long been recognized
(Crites et al., 2000). The soil is a combined biological, chemical, and physical
filter. Wastewater flowing through soil is purified of organic and biological
constituents, as described in Chapter 8. Septic tank effluent has sufficient solids
and organic matter to form a biological mat (“biomat”) in the subsurface,
TABLE 10.10
Performance Studies of Alternative Media
Parameter
Expanded
Shale
a
Advantex
b
Crushed
Glass
c
Hydraulic loading rate
d
1.35 — 1.8
Effluent BOD
e
1 (99) 5 (98) 10.7 (94)
Effluent total suspended solids
e
5 (95) 3 (90) 2.5 (95)
Effluent nitrogen
e
29 (39) 7 (78) 19.7 (55)
Effluent phosphorus
e
0.5 (94) — —
a
24 in. of LECA
®
(light expanded clay aggregate) (Anderson et al., 1998).
b
Roseburg, Oregon (Bounds et al., 2000).
c
Oswego, New York (Elliott, 2001).
d
In gal/ft
2
·d.
e
In mg/L (% removal).
Source: Leverenz, H. et al., Review of Technologies for the Onsite Treatment of Wastewater
in California, Report No. 02-2, prepared for the California State Water Resources Control
Board, Sacramento, CA, Department of Civil and Environmental Engineering, University
of California, Davis, 2002.
DK804X_C010.fm Page 511 Friday, July 1, 2005 4:52 PM
© 2006 by Taylor & Francis Group, LLC
512 Natural Wastewater Treatment Systems
particularly if gravity flow application is used. More highly treated effluent and
pressure-dosed application results in little, if any, biomat formation, and the
flow through the soil is only inhibited by the hydraulic conductivity of the soil.
Allowable hydraulic loading rates for variously treated effluents are presented
in Table 10.11.
10.7 DESIGN CRITERIA FOR ON-SITE
DISPOSAL ALTERNATIVES
Gravity-flow leachfields are the most common type of on-site wastewater dis-
posal. This type of on-site disposal functions well for sites with deep, relatively
permeable soils, where groundwater is deep and the site is relatively level.
10.7.1 GRAVITY LEACHFIELDS
Septic tank effluent flows by gravity into a series of trenches or beds for subsurface
disposal. Trenches are usually shallow, level excavations that range in depth from
1 to 5 ft (0.3 to 1.5 m) and in width from 1 to 3 ft (0.3 to 0.9 m). The bottom
of the trench is filled with 6 in. (150 mm) of washed drain rock. The 4-in. (100-
mm) perforated distribution pipe is next placed in the center of the trench.
TABLE 10.11
Allowable Hydraulic Loading Rates for Variously Treated Effluent
Allowable Hydraulic
Loading Rates
Mass Loading Rate
(g/m
2
·d)
Type of Effluent (in./d) (gal/ft
2
·d) (mm/d) BOD
5
TSS TKN
Restaurant septic tank
a
0.12 0.07 3 2.4 0.9 0.24
Domestic septic tank 0.4 0.25 10 1.5 0.8 0.55
Graywater septic tank 0.6 0.37 15 1.8 0.6 0.22
Domestic aerobic unit 0.8 0.50 20 0.7 0.8 0.30
Domestic sand filter 3.0 1.87 76 0.3 0.75 0.75
a
Increased from Siegrist’s values for BOD (800 mg/L), TSS (300 mg/L), and TKN (80 mg/L)
and lowered hydraulic loading rate from 4 mm/d to 3 mm/d.
Note: BOD
5
, biochemical oxygen demand; TSS, total suspended solids; TKN, total Kjeldahl
nitrogen.
Source: Adapted from Siegrist, R.L., in Proceedings of the Fifth National Symposium on Indi-
vidual and Small Community Sewage Systems, American Society of Agricultural Engineers,
Chicago, IL, December 14–15, 1987.
DK804X_C010.fm Page 512 Friday, July 1, 2005 4:52 PM
© 2006 by Taylor & Francis Group, LLC
On-Site Wastewater Systems 513
Additional drain rock is placed over the top of the distribution pipe, followed by
a layer of barrier material, typically building paper or fabric. The purpose of the
barrier material is to prevent migration of fines from the backfill into the drain
rock and avoid clogging of the drain rock by the clay or silt particles. The
infiltrative surfaces in a leachfield trench are the bottom and the sidewalls;
however, as a clogging layer of biological solids or “biomat” develops, the
infiltration through the bottom of the trench decreases and the sidewalls become
effective and become the long-term route for water passage.
Bed systems consist of an excavated area or bed with perforated distribution
pipes that are 3 to 6 ft (0.9 to 1.8 m) apart. The route for water passage out of
the bed is through the bottom. Bed systems can also use infiltration chambers,
which create underground caverns over the soil’s infiltrative surface and therefore
do not need the gravel or barrier material.
Leaching chambers constructed out of concrete are open-bottomed shells that
replace perforated pipe and gravel for distribution and storage of the wastewater.
The chambers interlock to form an underground cavern over the soil. Wastewater
is discharged into the cavern through a central weir, trough, or splash plate and
allowed to flow over the infiltrative surface in any direction. Access holes in the
top of the chambers allow the surface to be inspected and maintained as necessary.
Many leaching chamber systems have been installed in the northeastern United
States.
Typical criteria for siting of leachfield systems are presented in Table 10.12.
Loading rates for trench and bed systems can be based on percolation test results
and regulatory tables, on soil characteristics, or a combination of both. Disposal
field loading rates recommended by the USEPA for design, based on bottom
area, for various types of soils and observed percolation rates are shown in Table
10.13.
The loading rate based on the most conservative criterion is to assume that
the percolation rate through the soil will eventually be reduced to coincide with
the percolation rate through the biomat. On this basis, the hydraulic loading rate
is 0.125 gal/ft
2
·d (5 L/m
2
·d) based on trench sidewall area only (Winneberger,
1984).
Where the site soils contain significant amounts of clay, it is suggested that
the disposal field be divided into two fields and that the two fields be used
alternately every 6 months. When two fields are used, the actual hydraulic loading
rate for the field in operation is 0.25 gal/ft
2
·d (10 L/m
2
·d).
10.7.2 SHALLOW GRAVITY DISTRIBUTION
Shallow leachfields offer the benefits of lower cost and higher biological treatment
potential because the upper soil layers have the most bacteria and fungi for
wastewater renovation (Reed and Crites, 1984). The State of Oregon recently
allowed the use of leachfield trenches without gravel that are 10 in. (250 mm)
deep and 12 in. (300 mm) wide (Ball, 1994).
DK804X_C010.fm Page 513 Friday, July 1, 2005 4:52 PM
© 2006 by Taylor & Francis Group, LLC
514 Natural Wastewater Treatment Systems
TABLE 10.12
Design Considerations in Siting Leachfields
Item Criteria
Landscape Form
a
Level, well-drained areas; crests of slopes; convex slopes are
most desirable. Avoid depressions, bases of slopes, and concave
slopes unless suitable surface drainage is provided.
Slope
a
0–25%; slopes in excess of 25% can be used, but construction
equipment selection is limited.
Typical Horizontal Setbacks
b
Water supply sells 50–100 ft
Surface waters, springs 50–100 ft
Escarpments, man-made cuts 10–20 ft
Boundary of property 5–10 ft
Building foundations 10–20 ft
Soil
Unsaturated depth 2–4 ft (0.6–1.2 m) of unsaturated soil should exist between the
bottom of the disposal field and the seasonally high water table
or bedrock.
Texture Soils with sandy or loamy textures are best suited; gravelly and
cobbley soils with open pores and slowly permeable clay soils
are less desirable.
Structure Strong granular, blocky, or prismatic structures are desirable;
platey or unstructured massive soils should be avoided.
Color Bright, uniform colors indicate well-drained, well-aerated soils;
dull, gray, or mottled soils indicate continuous or seasonal
saturation and are unsuitable.
Layering Soils exhibiting layers with distinct textural or structural
changes should be evaluated carefully to ensure that water
movement will not be severely restricted.
Swelling clays Presence of swelling clays requires special consideration in
construction; location may be unsuitable if extensive.
a
Landscape position and slope are more restrictive for seepage beds because of the depth of cut
on the upslope side.
b
Intended only as a guide. Safe distance varies from site to site, based on local codes, topography,
soil permeability, groundwater gradients, geology, etc.
Source: Adapted from USEPA, Design Manual: Onsite Wastewater Treatment and Disposal
Systems, Municipal Environmental Research Laboratory, U.S. Environmental Protection Agency,
Cincinnati, OH, 1980.
DK804X_C010.fm Page 514 Friday, July 1, 2005 4:52 PM
© 2006 by Taylor & Francis Group, LLC
On-Site Wastewater Systems 515
10.7.3 PRESSURE-DOSED DISTRIBUTION
Pressure dosing can be achieved using either a dosing siphon or a pump. A
pressure distribution system has the advantages over gravity distribution of pro-
viding a uniform dose to the entire absorption area, promoting unsaturated flow,
and providing a consistent drying and reaeration period between doses. Pressure-
dosed distribution can allow the absorption site to be at a higher elevation from
the septic tank and will also allow a shallow (6- to 12-in.) distribution network.
With screened septic tank effluent or sand filter effluent, the distribution system
can use 0.125-in. (3-mm) orifices, typically spaced 2 to 4 ft (0.6 to 1.2 m) apart.
For septic tank effluent, the orifice size is typically 0.25 in. (6 mm). The spacing
and sizing of orifices should be uniform because the objective of pressure dosing
is to provide uniform distribution with unsaturated flow beneath the pipe. In
heavier soils, the spacing can be increased to 4 to 6 ft (1.2 to 1.8 m).
TABLE 10.13
Recommended Rates of Wastewater Application for
Trench and Bed Bottom Areas
Soil Texture
Percolation Rate
(min/in.)
Application Rate
(gal/ft
2
·d)
a,b
Gravel, coarse sand <1 Not suitable
c
Coarse to medium sand 1–5 1.2
Fine sand, loamy sand 6–15 0.8
Sand loam, loam 16–30 0.6
Loam, porous silt loam 31–60 0.45
Silty clay loam, clay loam
d,e
61–120 0.2
Clays, colloidal clays >120 Not suitable
f
a
Rates based on septic tank effluent from a domestic waste source. A safety
factor may be desirable for wastewaters of significantly different strength
or character.
b
May be suitable for sidewall infiltration rates.
c
Soils with percolation rates <1 min/in. may be suitable for septic tank
effluent if a 2-ft layer of loamy sand or other suitable soil is placed above
or in place of the native topsoil.
d
These soils are suitable if they are without significant amounts of
expandable clays.
e
Soil is easily damaged during construction.
f
Alternative pretreatment may be required, as well as alternative disposal
(wetlands or evapotranspiration systems).
Source: Adapted from USEPA, Design Manual: Onsite Wastewater Treat-
ment and Disposal Systems, Municipal Environmental Research Labora-
tory, U.S. Environmental Protection Agency, Cincinnati, OH, 1980.
DK804X_C010.fm Page 515 Friday, July 1, 2005 4:52 PM
© 2006 by Taylor & Francis Group, LLC
516 Natural Wastewater Treatment Systems
10.7.4 IMPORTED FILL SYSTEMS
Fill systems involve importing suitable off-site soils and placing them over the
soil absorption area to overcome limited depth of soil or limited depth to ground-
water. Care must be taken when selecting suitable soil to use in a fill system and
in the timing and conditions of importing the soil. Several conditions must be
satisfied to construct a successful fill system:
• Native soil should be scarified prior to import of fill.
• The fill should be placed when the soil is dry.
• The fill material should also be dry to prevent compaction.
• The first 6 in. (150 mm) of fill should be mixed thoroughly with the
native soil.
10.7.5 AT-GRADE SYSTEMS
The concept of the at-grade system was developed in Wisconsin as an intermediate
system between conventional in-ground distribution and the mound system. The
aggregate or drain rock is placed on the soil surface (at-grade) and a soil cap is
added over the top. Typically, the area for the at-grade system is tilled, the drain
rock is placed on the tilled area, the distribution pipe is positioned within the
drain rock, synthetic fabric is spread over the drain rock, and final soil cover (12
in. or 300 mm) is placed over the system. At-grade systems do not require the
24 in. (600 mm) of sand that mounds have and, therefore, are less expensive.
10.7.6 MOUND SYSTEMS
Mound systems are, in effect, bottomless intermittent sand filters. Components
of a typical mound, as shown in Figure 10.7, include a 24-in. (600-mm) layer of
sand, clean drain rock, distribution laterals, barrier material, and the soil cap.
Mounds are pressure dosed, usually 4 to 6 times per day. Mounds were first
developed by the North Dakota Agricultural College in the late 1940s. They were
known as NODAK systems and were designed to overcome problems with slowly
FIGURE 10.7 Schematic of a typical mound system.
Barrier material
Soil cap
Distribution laterals
Clean drain rock
Sand fill
material
Tilled top soil
Permeable soil
Water table or fractured bedrock
Absorption bed
Top soil
DK804X_C010.fm Page 516 Friday, July 1, 2005 4:52 PM
© 2006 by Taylor & Francis Group, LLC
On-Site Wastewater Systems 517
permeable soils and areas that had high groundwater tables (Ingham, 1980;
WPCF, 1990). Mounds may be used on sites that have slopes up to 12%, provided
the soils are permeable. If the native soils are slowly permeable, the use of mounds
should be restricted to slopes of less than 6%. The design of mound systems is
a two-step process. Percolation tests are conducted on the native soils on the site
at the depth at which the mound base will exist. The values of the measured
percolation rate are correlated to the design infiltration rate in Table 10.14, and
the infiltration rate is then used to calculate the base area of the mound. The
second step is to design the mound section. On the basis of the type of material
used to construct the mound, the area of the application bed in the mound is
determined. Mound fill materials are listed in Table 10.15 along with the corre-
sponding design infiltration rate for determining the bed area (Otis, 1982).
10.7.7 ARTIFICIALLY DRAINED SYSTEMS
Sometimes a high-groundwater condition can be overcome by draining the
groundwater away from the site. High groundwater tables in the area of the soil
absorption fields may be artificially lowered by vertical drains or underdrains.
Underdrains can be perimeter drains, used for level sites and sites up to 12% in
slope, or curtain drains (upslope side only), for sites with slopes greater than 12%
(Nolte Associates, 1992b).
10.7.8 CONSTRUCTED WETLANDS
Constructed wetlands can be used for on-site treatment as well as on-site disposal
and reuse. As described in Chapter 6, constructed wetlands can be either the
free water surface type or the subsurface flow type. For on-site systems in close
proximity to children, the subsurface flow wetlands are most appropriate. A large
number of subsurface wetlands have been constructed and placed in operation
in Louisiana, Arkansas, Kentucky, Mississippi, Tennessee, Colorado, and New
TABLE 10.14
Infiltration Rates for Determining Base Area of Mound
Native On-Site Soil
Percolation Rate
(min/in.)
Infiltration Rate
(gal/ft
2
·d)
Sand, sandy loam 0–30 1.2
Loam, silt loams 31–45 0.75
Silt loams, silty clay loams 46–60 0.50
Clay loams, clay 61–120 0.25
Source: Adapted from USEPA, Design Manual: Onsite Wastewater Treat-
ment and Disposal Systems, Municipal Environmental Research Labora-
tory, U.S. Environmental Protection Agency, Cincinnati, OH, 1980.
DK804X_C010.fm Page 517 Friday, July 1, 2005 4:52 PM
© 2006 by Taylor & Francis Group, LLC