BARRIER SYSTEMS for ENVIRONMENTAL CONTAMINANT CONTAINMENT and TREATMENT - PART 2 ppsx
Bạn đang xem bản rút gọn của tài liệu. Xem và tải ngay bản đầy đủ của tài liệu tại đây (1.47 MB, 71 trang )
71
2
Modeling of Fluid
Transport through
Barriers
Prepared by*
Brent E. Sleep
University of Toronto, Toronto, Canada
Charles D. Shackelford
Colorado State University, Fort Collins, Colorado
Jack C. Parker
Oak Ridge National Laboratory, Oak Ridge,
Tennessee
2.1 OVERVIEW
As understanding of the mechanisms of contaminant transport through barrier
tive approach to a performance design approach. It is expected that reliance on
models for predictive-based design will increase in the future, as the need for
predicting long-term barrier system performance increases. This chapter details
the mechanisms and models for predicting the performance of components of
passive barriers such as caps, permeable reactive barriers (PRBs), and walls and
floors. The relevant regulatory drivers and current state of practice are summa-
modeling while this chapter focuses on the performance of components that
constitute containment systems.
* With contributions by Calvin C. Chien, DuPont, Wilmington, Delaware; Thomas O. Early, Oak
Ridge National Laboratory, Oak Ridge, Tennessee; Clifford K. Ho, Sandia National Laboratories,
Albuquerque, New Mexico; Richard C. Landis, DuPont, Wilmington, Delaware; Alyssa Lanier,
University of Wisconsin, Madison, Wisconsin; Michael A. Malusis, GeoTrans, Inc., Westminster,
Colorado; Mario Manassero, Politecnico I, Torino, Italy; Greg P. Newman, Geo-Slope International
Ltd., Calgary, Canada; Robert W. Puls, U.S. Environmental Protection Agency, Ada, Oklahoma;
Terrence M. Sullivan, Brookhaven National Laboratory, Upton, New York
4040_book.fm Page 71 Wednesday, September 14, 2005 12:43 PM
© 2006 by Taylor & Francis Group, LLC
rized, and research needs are identified. Chapter 1 dealt with system performance
systems improves, the design of containment systems is moving from a prescrip-
72
Barrier Systems for Environmental Contaminant Containment & Treatment
2.2 CAPS
2.2.1 F
EATURES
, E
VENTS
,
AND
P
ROCESSES
A
FFECTING
P
ERFORMANCE
OF
C
APS
Covers and caps are engineered structures that must perform within a larger
dynamic natural system and, as such, must be designed with consideration of
natural system influences. Understanding these physical processes and applying
appropriate numerical analyses to these processes can help the engineer to build
an appropriate overall system that will perform with the desired objective. The
primary processes acting on a cap are described in the subsections below.
2.2.1.1 Hydrologic Cycle
The purpose of a cap is usually to minimize water infiltration into underlying
waste, and sometimes to minimize gas transport to the atmosphere. As shown in
the cap slope, cap soil properties, cap moisture conditions, and the duration and
magnitude of precipitation, ponding and water run off can occur. Water that does
not run off of the cap is either stored in depressions in the cap surface, or infiltrated
into the surface layer of the cap. Water infiltrating into the surface layer of the
cap is subject to evapo-transpiration. Rates of evapo-transpiration depend on
surface vegetation, soil properties, surface temperatures, soil and air relative
humidities, and net solar radiation. The remainder of the precipitation not trans-
formed to run off or evapo-transpiration remains as storage in the cap, or, if the
storage capacity of the cap is exceeded, the water percolates through the cap.
Contaminant vapors can migrate through caps by advection or diffusion.
Advection rates depend on gas-phase permeabilities and pressure gradients across
the cap. Variations in barometric pressures can increase contaminant vapor advec-
tion to the atmosphere. Vapor diffusion is driven by the gas-phase concentration
gradient existing across the cap. Diffusion coefficients depend on soil porosity
and water content, as well as contaminant molecular weight. It is often assumed
that diffusion at the ground surface occurs across a stagnant surface boundary
conditions (Thibodeaux, 1981).
Water percolation and contaminant transport through the cap can also be
the migration of water or contaminant vapors through the system. Natural events
such as earthquakes, tornadoes, floods, and melting snow can also be disruptive
can be significant and should therefore be considered.
4040_book.fm Page 72 Wednesday, September 14, 2005 12:43 PM
© 2006 by Taylor & Francis Group, LLC
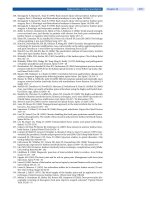
Figure 2.1, water originates as precipitation that falls on the cap. Depending on
Figure 2.2. Animal burrows or other passageways through the cap can accelerate
altered by human or biointrusion into the cap and other natural events, leading
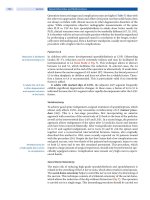
to disparities between probable current and future percolation rates as shown in
and processes as discussed in Chapter 1, their potential impact and consequence
to the cap. Although a great deal of uncertainty is associated with these events
layer the depth of which depends on surface topography, vegetation, and wind
Modeling of Fluid Transport through Barriers
73
FIGURE 2.1
Features, events, and processes associated with a long-term cap.
FIGURE 2.2
Cumulative probability distribution of water percolation reaching the mill
tailings for present and future conditions. (From Ho, C.K. et al., 2001. Sandia National
Laboratory Report SAND2001-3032; October.)
Climate
Transpiration
Precipitation
Run-on
Run-off
Gas release
Evaporation
Storage
Lateral drainage
Waste
Percolation/leaching
Human intrusion/
bio-intrusion
10
−13
10
−12
10
−11
10
−10
10
−9
10
−8
10
−7
10
−6
0
20
40
60
80
100
Present
Future
Percolation Flux through Cover (cm/s)
Cumulative Probability
40 CFR Part 264.301
4040_book.fm Page 73 Wednesday, September 14, 2005 12:43 PM
© 2006 by Taylor & Francis Group, LLC
74
Barrier Systems for Environmental Contaminant Containment & Treatment
2.2.1.2 Layers and Features
In very rare cases, a cap comprises a single soil layer over waste material.
Typically however, a cap is the unique combination of soils placed in layers on
top of each other and in certain order that create the desired effect. This section
briefly outlines the general performance objective of each potential cap layer.
•
Ground surface layer
— The top few inches of any surface soil may
need to be treated as a unique soil region since, due to desiccation and
drying effects, this zone generally has a much higher hydraulic con-
ductivity than the soil a few inches below surface. This zone is espe-
cially important to include when simulating infiltration through cover
systems using numerical models.
•
Vegetation layers
— It is common to include a vegetation growth
layer that may or may not be part of another cover layer. In many
cases, the vegetation can be a key to cap performance, but based on
According to energy balance accounting, the sum of actual evaporation
and transpiration are always less than the potential evaporation. This
means that for near-surface processes, the availability of water limits
evapo-transpiration, and water that is not transpired through vegetation
is removed through evaporation. In other words, if vegetation were not
present, actual evaporation would remove a similar amount of water.
The transpiration process becomes important when it is necessary to
draw water from deeper beneath the surface, particularly when actual
evaporation has significantly diminished at the surface due to drying
of soils. Vegetation is also critical for stability purposes on sloped
covers, as well as erosion control.
•
Capillary break layers
— These layers are generally created with
coarse materials next to fine materials because, at a common negative
water pressure, two different soils have different water contents. Cap-
illary breaks can be used in caps for various purposes. When placed
beneath a compacted layer, the capillary break limits percolation
through the compacted material. When placed above a compacted layer,
the capillary break limits the evaporative drying of the compacted layer,
because water cannot readily be drawn up in its liquid phase through
the coarser capillary break layer when it is dry. For this type of cover
design, a model that includes coupled vapor flow should be used to
assess the impact of vapor flux on barrier layer drying in the event that
upward liquid phase flow has shut down.
•
Barrier layers
— Barrier layers are generally made of well-com-
pacted, low-permeability fine-grained soils. A barrier layer should not
be placed directly at the surface, or it will be subjected to effects such
as extreme drying, desiccation, and freeze-thaw. It is common to place
4040_book.fm Page 74 Wednesday, September 14, 2005 12:43 PM
© 2006 by Taylor & Francis Group, LLC
the analysis presented in Section 1.4.1, this should not be assumed.
Modeling of Fluid Transport through Barriers
75
a barrier layer over a coarser layer to create a capillary break effect,
and then place it beneath a vegetation growth layer. It is not desired
to have the root zone of the plant species extend into the barrier layer
where damage can occur. While long-term barrier layer performance
is unknown and cannot be predicted with precision, the use of dense,
well-graded materials for these layers has shown the best resistance to
long-term performance deterioration (Wilson, 2002).
•
Storage layers
— These layers are generally made of loose well graded
materials such that the hydraulic conductivity is sufficient to allow
water to infiltrate and subsequently be drawn back out by evaporation
and/or roots. The thickness of a storage layer becomes a critical ques-
tion in its functionality. The cover must be thick enough to keep near-
surface wetting and drying processes from interacting with the waste,
and to withstand long-term erosion. If the cover is to limit gas fluxes
as well, there must be a zone of continual near-saturation within this
layer over time and over prolonged dry periods; either that, or the
storage layer must protect a deeper near-saturation barrier layer. Long-
term storage layer performance can be affected by coarse material
breakdown, which can result in permeability loss.
2.2.2 C
URRENT
S
TATE
OF
P
RACTICE
FOR
M
ODELING
P
ERFORMANCE
OF
C
APS
Water movement through soils can be thought of as a three-component system
consisting of the soil-atmosphere interface, the near-surface unsaturated zone,
and the deeper saturated zone. In the past, groundwater modeling has primarily
focused on the saturated zone, which creates a discontinuity in the natural system
because the unsaturated zone and the soil-atmosphere interface are not repre-
sented. Advances in unsaturated soil technology during the past decade have led
to the development of routine modeling techniques for saturated and unsaturated
soil systems. However, modeling techniques for the third component, involving
the detailed evaluation of the flux boundary condition imposed by the atmosphere,
are not routinely available. This section discusses some of the available codes
that can be used for the predictive modeling of processes associated with cap
performance. A summary of the codes considered, and some of the key features
different available software tools and their main solution processes, as well as
feature overviews and source availability. Table 2.2 lists the individual program’s
solution options and features that are built into the various codes.
2.2.2.1 Water Balance Method
The estimation of the amount of water infiltrating through a cap is essentially the
estimation of the water balance for the cap. The net percolation through the cap is
the remainder from precipitation after run off, surface storage, evapo-transpiration,
4040_book.fm Page 75 Wednesday, September 14, 2005 12:43 PM
© 2006 by Taylor & Francis Group, LLC
and solution techniques are provided in Tables 2.1 and 2.2. Table 2.1 lists several
76
Barrier Systems for Environmental Contaminant Containment & Treatment
TABLE 2.1
Available Software Overview
Software
Name
Process Solved Parameters Technique
Features/Limitations User Interface A
vailability
SoilCover 1D, Transient
FEM
Pressure, temperature,
vapor pressure with
pseudo gas
Coupled,
Simultaneous,
nonlinear
Pre- and post-processor
included; code unavailable.
Freeware
Text in Excel with
dialogues;
requires Excel
97 or 2000
www.vadose-
science.com
Oxygen flux
Subsequent
VADOSE/W 2D, transient
and steady-
state FEM
Pressure, temperature,
vapor pressure; can be
linked with slope
stability software and
contaminant transfer
software
Coupled,
simultaneous,
nonlinear
Enhanced pre and post-
processor included; climate
and soils database included;
user support included;
commercially developed for
cover/cap design
Full CAD data
input and mesh
generation;
Microsoft
certified for XP
and lower OS
www.geo-slope.com
Oxygen or radon
diffusion, dissolution,
decay
Subsequent linear
Earthquake seismic
analysis using
V
ADOSE/W generated
pore pressure data
Supplemental Integrated with program
QU
AKE/W
Slope stability analysis
using VADOSE/W
generated pore
pressure data
Supplemental Integrated with program
SLOPE/W
4040_book.fm Page 76 Wednesday, September 14, 2005 12:43 PM
© 2006 by Taylor & Francis Group, LLC
Modeling of Fluid Transport through Barriers
77
Contaminant transfer,
advection/dispersion,
decay, particle tracking
Subsequent
nonlinear
Integrated with program
CTRAN/W
HELP 1D, quasi 2D,
Analytical
Water balance Analytical Climate and soil database
included; not physically
based; limited design
application; assumes unit
gradient
Text in editor or
Windows
dialogues
www.wes.army.mil/el/
elmodels/helpinfo.html
UNSAT-H 1D, transient
FEM
Pressure with vapor Nonlinear Pre- and post-processor
available but excluded. Code
available
Text in editor or
Windows
dialogues
www.hydrology.pnl.gov/
unsath.asp
Temperature (optional) Subsequent linear
HYDRUS-2D 2D, Transient
and steady-
state FDM
Pressure, with vapor
flow
Nonlinear Pre- and post-processor
included; CAD mesh
generation add-on
CAD and
Windows
dialogues
www.ussl.ars.usda.gov/
models/hydrus2d.HTM
Temperature Subsequent linear
Contaminant transfer Subsequent
nonlinear
TOUGH 2 1D, 2D, 3D,
transient and
steady-state
IFDM
Pressure, temperature,
vapor, gas in porous or
fractured media
Coupled,
Simultaneous,
nonlinear
Limited pre- and post-
processor available from
independent suppliers. Code
available; users can
customize
Limited CAD and
text in editor
www-esd.lbl.gov/
TOUGH2
4040_book.fm Page 77 Wednesday, September 14, 2005 12:43 PM
© 2006 by Taylor & Francis Group, LLC
78
Barrier Systems for Environmental Contaminant Containment & Treatment
TABLE 2.1 (continued)
Available Software Overview
Software
Name Process Solved Parameters Technique Features/Limitations User Interface Availability
FEHM 1D, 2D, 3D,
transient
FEM/FVM
Multi-phase, multi-
component heat, mass,
gas, air including
double porosity flow;
can solve contaminant
flow as advection/
dispersion or particle
tracking
Coupled,
simultaneous,
nonlinear
Limited pre- and post-
processor with 3D grid
generator available from
independent sources. Unix or
PC based; code included;
user can customize; USA
only
Limited CAD
with text input
www-lanl.gov/EES5/
fehm.html
RAECOM 1D steady-
state radon-
gas diffusion
Radon-gas
concentration and flux
through a multi-layer
system
Linear Can automatically optimize
layer thickness
Text entry RAECOM-cloned
calculator available on
the web:
wise/uranium/ctc.html
Coupled, physical coupling between equations; simultaneous, more than one equation solv
ed at
same
time (must be coupled); subsequent, more than one equation
solved one after the other at each time step; supplemental, data from completed analysis used in separate analysis; linear, mat
erial properties not a function of variable
4040_book.fm Page 78 Wednesday, September 14, 2005 12:43 PM
/>being solved; nonlinear, material properties change with variable being solved, so iterations required; analytical, no partial differential equation, one pass solution.
© 2006 by Taylor & Francis Group, LLC
Modeling of Fluid Transport through Barriers
79
TABLE 2.2
Available Software: Detailed Options
Software
Name Solved Parameters
Solution
Complexity
Evapor
-ation
Transpir-
ation
Freez-
ing
Run
Off
Pond-
ing
Soil
Properties
SoilCover Pressure, temperature, vapor pressure with
pseudo gas
RP RP RE SE RE — FF, CF
Oxygen flux A
VADOSE/W Pressure, temperature, vapor pressure; can
be linked with slope stability software and
contaminant transfer software
RP RP RE RE RE RE FF, CF
Oxygen or radon diffusion, dissolution,
decay
RP Internally
calculated
Earthquake seismic analysis using
VADOSE/W generated pore pressure data
RP FF
Slope stability analysis using VADOSE/W
generated pore pressure data
RP FF
Contaminant transfer,
advection/dispersion, decay, particle
tracking
RP FF
HELP Water balance
A SE SE E E — CF
UNSAT-H Pressure with vapor RE SE RE — SE — CF
Temperature (optional) RE
4040_book.fm Page 79 Wednesday, September 14, 2005 12:43 PM
© 2006 by Taylor & Francis Group, LLC
80
Barrier Systems for Environmental Contaminant Containment & Treatment
TABLE 2.2 (continued)
Available Software: Detailed Options
Software
Name Solved Parameters
Solution
Complexity
Evapor
-ation
Transpir-
ation
Freez-
ing
Run
Off
Pond-
ing
Soil
Properties
HYDRUS-2D Pressure, with vapor flow RE SE RE — SE — CF
Temperature RE
Contaminant transfer RE
TOUGH2 Pressure, temperature, vapor, gas in porous
or fractured media
RP — — — — — CF
FEHM Multi-phase, multi-component heat, mass,
gas, air including double porosity flow;
can solve contaminant flow as
advection/dispersion or particle tracking
RP SE — — SE SE CF
RAECOM Radon-gas concentration and flux through
a multi-layer system
A—————CF
RP, rigorous physically based with assumptions limited to current understanding of real ph
ysical processes; RE, rigorous physically based but
with empirical components or built-in limiting assumptions; SE, semi-empirical, equation based but user sets limits or there ar
e limited built-in
assumptions; E, empirically based, extreme limiting assumptions and little ph
ysical bases for generated data; A, analytically based — no partial
differential equations; FF, free-form functions, user can customize; CF
, closed-form functions, curve-fit parameters.
4040_book.fm Page 80 Wednesday, September 14, 2005 12:43 PM
© 2006 by Taylor & Francis Group, LLC
Modeling of Fluid Transport through Barriers
81
and soil storage are considered. The first method used for water balance calcu-
lations was developed by Thornthwaite and Mather (1957). This method was used
by Fenn et al. (1975) to analyze leachate generation at municipal solid waste
landfills.
Typically, the water balance method is based on monthly climatic variables.
The monthly infiltration,
I
(cm), into a cover is given by:
I = P – R
(2.1)
where
P
is precipitation (cm) and
R
is surface run off (cm). Surface storage was
not considered by Fenn et al. (1975). Run off is calculated from precipitation
using a run off coefficient,
C
:
R = C P
(2.2)
Fenn et al. (1975) provided values of
C
for different soil types and slopes, with
values ranging from 0.05 for sand with less than a 2% slope, to 0.35 for a steeply
sloped (>7%) clay layer.
Thornthwaite and Mather (1957) also provided tables for determining poten-
tial evapo-transpiration (PET) as a function of mean temperature, heat index, and
hours of sunlight. When PET exceeds infiltration, moisture storage in the cap is
expected to decrease unless the cap was already dry. PET cannot exceed the water
stored in the cap plus the infiltration for the month. When infiltration exceeds
PET, evapo-transpiration is equal to PET, and excess infiltration increases the
moisture storage in the cap to field capacity. Excess infiltration above the field
capacity of the cap percolates through the cap.
2.2.2.2 HELP
The hydrologic evaluation of landfill performance (HELP) model was developed
by the United States Army Engineer Waterways Experimentation Station for the
United States Environmental Protection Agency (USEPA) in 1984. The current
version of the model, Version 3, was released in 1993.
The HELP model is essentially a water balance model that includes subsur-
face water routing. It simulates both model cap and liner behavior in a landfill
system. The model is referred to as a quasi-two-dimensional model, as it simulates
vertical flow in barrier and waste layers (assuming unit hydraulic gradient), and
horizontal flow in drainage layers (using an analytical solution of the Boussinesq
equation). Calculations are performed on a daily basis, and changes in soil
moisture and surface storage are tracked (Peyton and Schroeder, 1993). The HELP
model considers both rain and snow infiltration and accounts for interception by
vegetation, surface evaporation, and surface storage.
Evapo-transpiration is modeled based on a square root of time calculation
and the energy available for evaporation. The type and stage of vegetative growth
is also considered in evapo-transpiration calculation.
4040_book.fm Page 81 Wednesday, September 14, 2005 12:43 PM
© 2006 by Taylor & Francis Group, LLC
82
Barrier Systems for Environmental Contaminant Containment & Treatment
2.2.2.3 UNSAT-H
UNSAT-H (WinUNSAT-H) is a model for calculating water and heat flow in
unsaturated media. The model was developed at Pacific Northwest National
Laboratory in Richland, Washington, to assess the water dynamics of near-
surface, waste disposal sites. The code is primarily used to predict deep drainage
as a function of environmental conditions such as climate, soil type, and vegeta-
tion. UNSAT-H is a one-dimensional model that simulates the dynamics processes
of infiltration, drainage, redistribution, surface evaporation, and uptake of water
from soil by plants. It uses a finite-difference approximation to solve the one-
dimensional vertical form of Richards’ equation, which governs unsaturated
moisture movement. UNSAT-H was designed for use in water balance studies
and has capabilities to estimate evaporation resulting from meteorological surface
conditions and plant transpiration.
The parameters required for each material type are saturated hydraulic con-
ductivity, volumetric moisture content at saturation, irreducible moisture content,
air entry head, and inverse pore size distribution index.
2.2.2.4 SoilCover
SoilCover is a soil-atmosphere flux model that links the subsurface saturated/
unsaturated groundwater system and the atmosphere above the soil in an attempt
to represent the soil-atmosphere continuum. It is a one-dimensional finite element
package that models transient conditions. The model uses a physically-based
method for predicting the exchange of water and energy between the atmosphere
and a soil surface. The theory is based on the well-known principles of Darcy’s
and Fick’s Laws that describe the transport of liquid water and water vapor and
Fourier’s Law that describes conductive heat flow in the soil profile below the
soil-atmosphere boundary. SoilCover predicts the evaporative flux from a saturated
or an unsaturated soil surface on the basis of atmospheric conditions, vegetation
cover, and soil properties and conditions. The Penman–Wilson formulation is
used to compute the actual rate of evaporation from the soil-atmosphere boundary,
which is critical to modeling of evapo-transpirative caps (Wilson, 1990; Wilson
et al., 1994).
The primary features and modeling capabilities of SoilCover are as follows:
• Specification of detailed climate data, including minimum and maxi-
mum air temperature, net radiation, minimum and maximum relative
humidity, and wind speed
• Specification of reduced climate data, including air temperature, rela-
tive humidity, and potential evaporation (wind speed is optional)
• Multi-layered soil profiles
• Optional specification of an internal liquid source/sink node
• Optional specification of oxygen diffusion coefficients for monitoring
oxygen flux and the concentration between soil surface and second
user-specified node
4040_book.fm Page 82 Wednesday, September 14, 2005 12:43 PM
© 2006 by Taylor & Francis Group, LLC
Modeling of Fluid Transport through Barriers
83
• User-defined or SoilCover-predicted thermal and hydraulic soil prop-
erty functions
• Internal adaptive time stepping scheme for daily simulations
• Relative convergence criteria for suction and temperature applied at
every node
• Output data files providing daily profiles of volumetric and gravimetric
water content, degree of saturation, matrix suction, total head, temper-
ature, ice content, hydraulic conductivity, oxygen concentration, and
vapor pressure
• Daily reporting of potential evaporation, surface flux, base flux, total
evaporation, total run off, root flux, user-selected internal node flux
and user selectable on-screen graphics during program execution show-
ing continuous daily or cumulative fluxes in chart and table format
plus daily updates of temperature and degree of saturation profiles
The program user interface occurs in Microsoft Excel
using dialogue boxes
and custom menus, and the solver is a 32-bit Fortran executable file.
2.2.2.5 HYDRUS-2D
HYDRUS-2D can be used to simulate two-dimensional water flow, heat transport,
and the movement of solutes involved in consecutive first-order decay reactions
in variably saturated soils. HYDRUS-2D uses the Richards’ equation for simu-
lating variably saturated flow and Fickian-based convection-dispersion equations
for heat and solute transport. The water flow equation incorporates a sink term
to account for water uptake by plant roots. The heat transport equations consider
transport due to conduction and convection with flowing water. The solute trans-
port equations consider convective-dispersive transport in the liquid phase, as
well as diffusion in the gaseous phase. The transport equations also include
provisions for nonlinear nonequilibrium reactions between the solid and liquid
phases, linear equilibrium reactions between the liquid and gaseous phases, zero-
order production, and two first-order degradation reactions: one independent of
other solutes and one that provides coupling between solutes involved in the
sequential first-order decay reactions.
The user interface includes data pre-processing and graphical presentation of
the output results in the Microsoft Windows 95, 98, and NT environments. Data
pre-processing involves specification of a flow region of arbitrary continuous
shape by means of lines, arcs and splines, discretization of domain boundaries,
and subsequent automatic generation of an unstructured finite element mesh. An
alternative structured mesh for relatively simple transport domains defined by
four boundary lines can also be considered. Graphical presentation of the output
results consists of simple two-dimensional x–y graphs, contour and spectral maps,
velocity vectors, as well as animation of both contour and spectral maps. Graphs
along any cross sections or boundaries can be readily obtained. A small catalog
of soil hydraulic properties is also part of the interface.
4040_book.fm Page 83 Wednesday, September 14, 2005 12:43 PM
© 2006 by Taylor & Francis Group, LLC
84
Barrier Systems for Environmental Contaminant Containment & Treatment
2.2.2.6 VADOSE/W
VADOSE/W is a commercially developed two-dimensional finite element code
that accounts for precipitation; evaporation; snow accumulation/melt/run off;
groundwater seepage; freeze-thaw; ground vapor flow; actual transpiration from
plants; and gas diffusion, dissociation, and decay. It solves the same primary heat
and mass differential equations as the SoilCover model except in two dimensions.
The gas diffusion equation is solved at the completion of each time step once
water contents and temperatures are known throughout the domain.
VADOSE/W uses the Penman–Wilson method (Wilson, 1990; Wilson et al.,
1994) method for computing actual evaporation at the soil surface such that actual
evaporation is computed as a varying function of potential evaporation dependent
on soil pore water pressure and temperature conditions and independent of soil
type and drying history. The fully coupled heat and mass equations with vapor
flow in VADOSE/W permit the necessary parameters at the soil surface to be
available for use in the Penman–Wilson method. VADOSE/W is currently the
only numerical two-dimensional cap design model capable of calculating actual
evaporation based on first-principle physical relationships, not empirical formu-
lations that are developed for unique soil types, soil moisture conditions, or
climate parameters.
VADOSE/W can be used wherever accurate surface boundary conditions are
required. Typical applications include designing single or multi-layered soil cov-
ers over mine waste and municipal landfill disposal sites; obtaining climate-
controlled soil pore pressures on natural slopes or man-made covered slopes for
use in stability analysis; and determining infiltration and evaporation as well as
plant transpiration from agricultural irrigation projects.
VADOSE/W comes with a built-in soil property database as well as full-year
detailed climate data for over 40 sites worldwide. Climate data can be easily
scaled to suite specific conditions or the user can input specific climate data.
2.2.2.7 TOUGH2
Transport of unsaturated groundwater and heat (TOUGH2) is a multi-dimensional
numerical simulator that simulates the transport of air, water, and heat in porous
and fractured media (Pruess, 1991). Mass and energy balances for air, water, and
heat are solved simultaneously in TOUGH2 using the integrated finite difference
method. The integrated finite difference formulation of TOUGH2 allows for the
construction of nonuniform elements that can be used to represent irregular
domains. The development of this code was originally motivated by problems
involving heat-driven flow, although this code is now used in a wide range of
problems involving unsaturated flow. For example, Ho and Webb (1998) used
TOUGH2 to simulate the effects of heterogeneities on capillary barrier perfor-
mance in landfill caps. A multi-phase approach was used to describe the move-
ment of gaseous and liquid phases, their transport of latent and sensible heat, and
phase transitions between liquid and vapor. Water vapor and air, which generally
4040_book.fm Page 84 Wednesday, September 14, 2005 12:43 PM
© 2006 by Taylor & Francis Group, LLC
Modeling of Fluid Transport through Barriers
85
constitute the gas phase, are tracked and simulated separately. Liquid- and gas-
eous-phase flow can occur under pressure, viscous, and gravity forces according
to Darcy’s Law, and interference between the phases is represented through
relative permeability functions.
A number of variations of the TOUGH2 code have been developed to include
additional capabilities of modeling additional species, modeling fluctuating atmo-
spheric boundary conditions, and inverse modeling. The model parameters, initial
conditions, and boundary conditions are typically entered into the code through
text entry into a file that is read by the code. Post-processing within TOUGH2 is
limited and is typically performed by third-party software. The source code for
TOUGH2, written in standard FORTRAN77, is available from the United States
Department of Energy (USDOE) Office of Scientific and Technical Information
Energy Science and Technology Software Center in Oak Ridge, Tennessee.
2.2.2.8 FEHM
Finite element heat and mass (FEHM) is a numerical simulation code for sub-
surface transport processes (Zyvoloski et al., 1997). It models three-dimensional
(3-D), time-dependent, multi-phase, multi-component, nonisothermal, reactive
flow through porous and fractured media. It can represent complex 3-D geologic
media and structures and their effects on subsurface flow and transport. FEHM
uses a finite-element formulation to solve the governing equations of heat and
mass transport. Simulation of additional species (e.g., organics, radionuclides)
can be performed simultaneously with the solution of heat, air, and water trans-
port. In addition, a particle-tracking module is also included that provides a more
computationally efficient procedure to the solution of contaminant transport.
Millions of particles can be simulated that represent the effects of advection,
diffusion, dispersion, and fracture-matrix interactions on transport.
The entry of model parameters, boundary conditions, and initial conditions
into FEHM is performed through the creation of text files that are read by the
code. FEHM does not perform any direct post-processing of the data for visual-
ization, but the user has the option to output the data in formats that can be read
by third-party software. FEHM can be obtained free of charge in the United States
2.2.2.9 RAECOM
Radiation attenuation effectiveness and cover optimization with moisture effects
through a multi-layer cover (Rogers et al., 1984). Material properties, dimensions,
and diffusion coefficients can vary among the different layers, and activity and
emanation coefficients can be specified. An online calculator that provides the
4040_book.fm Page 85 Wednesday, September 14, 2005 12:43 PM
© 2006 by Taylor & Francis Group, LLC
for most applications via the web site /> />(RAECOM) is a code that simulates steady, one-dimensional radon gas diffusion
same functional calculations as RAECOM is provided at the following web site:
86
Barrier Systems for Environmental Contaminant Containment & Treatment
2.2.3 M
ODELING
L
IMITATIONS
AND
R
ESEARCH
N
EEDS
FOR
C
APS
There are many limitations to modeling the performance of caps, including data
needs; lack of quality assurance and control of models and model usage; and lack
of verification, validation, and calibration. This section discusses these limitations
and the associated research needs, as well as the role of modeling in designing
caps.
2.2.3.1 Role of Modeling
There is often a misperception of what a model can and cannot do. It is critical
to get all stakeholders to understand and agree on the objectives of using the
model. Many believe that if the predictions arise from a sophisticated computer
code that incorporates the fundamental physics as it is currently understood, the
answer must be correct. In fact, at best, the model output is a scientifically
defensible, although not necessarily accurate, prediction of system behavior. This
belief in modeling leads to the development and use of more sophisticated models
that advance the state of the science, but do not necessarily provide more defen-
sible predictions.
In modeling cover system performance, the objective is to provide a measure
of the ability of the cover to prevent water infiltration to the waste zone over long
periods of time (i.e., tens of years to hundreds of years). It is not possible to
precisely predict infiltration over long time periods due to the large number of
uncontrolled variables (e.g., weather conditions, burrowing animals, root growth),
heterogeneities in the physical properties of the system, and lack of precise
understanding of the flow physics (e.g., hysteresis effects and soil characteristic
curves are empirical relationships based on data). Therefore, the modeling
approach should aim to demonstrate that the cover system limits infiltration to
an acceptable level over a range of potential conditions. This lends itself naturally,
although not exclusively, to probabilistic modeling.
2.2.3.2 Data Needs
The data required for modeling cap behavior depends on the model being used.
The simplest models such as the water balance method of Thornthwaite and
Mather (1957) and Fenn et al. (1975) require monthly climatic data such as
precipitation, mean temperature, heat index, and hours of sunlight. Soil types and
cap slopes are also required to allow estimation of run off.
More comprehensive water balance models such as the HELP model allow
for more complex cap configurations and, thus, require specification of the dif-
ferent cap layers. The HELP model also simulates the surface processes in greater
detail and therefore requires additional climatic data and soil properties. The
climate data input to the HELP model include daily precipitation, daily mean
temperature, daily solar evaporation, maximum leaf area index, growing season,
and evaporative zone depth (Peyton and Schroeder, 1993). The soil properties
4040_book.fm Page 86 Wednesday, September 14, 2005 12:43 PM
© 2006 by Taylor & Francis Group, LLC
Modeling of Fluid Transport through Barriers
87
required include porosity, field capacity, wilting point, hydraulic conductivity,
and the United States Soil Conservation Society curve number for the surface
layer. The HELP model contains a list of default soil properties, and a database
of climate data for a large number of North American cities (Peyton and
Schroeder, 1993).
Other more rigorous models such as UNSAT-H, HYDRUS-2D, and
VADOSE/W simulate unsaturated water flow by solving Richards’ equation.
Simulation of unsaturated water flow with Richards’ equation requires parameter
specification of the soil characteristic curves for hydraulic conductivity and mois-
ture content as a function of suction pressure, typically represented by empirical
relationships such as those developed by van Genuchten (1980) or Fredlund and
Xing (1994). These parameters are required for each unique soil layer in the cover
system. Saturated hydraulic conductivity and porosity are also required for each
material. Other parameters, such as the air entry pressure head, residual saturation
value, vertical and horizontal saturated conductivity, and anisotropy parameters
may be required depending on the model.
Some of the models (i.e., TOUGH2, FEHM, VADOSE/W, HYDRUS-2D) also
solve the heat transport equation to track evaporation and water vapor transport.
Therefore, these models require additional information regarding soil properties
related to heat transport for the gas and liquid phase. Parameters that are typically
needed include thermal conductivity, specific heat capacity, latent heat of vapor-
ization, surface tension, and parameters that describe the interactions between
gas and liquids under flowing conditions (e.g., relative permeability).
2.2.3.3 Code Quality Assurance and Quality Control
Numerical models are nothing more than tools that solve mathematical equations
that cannot be solved with conventional techniques. Typical geotechnical com-
puter models have thousands of lines of code; it is easy to inadvertently introduce
mistakes that can cause unpredictable behavior. When source code is made avail-
able to end users to change and compile, unique versions of the code that only
solve specific problems commonly result, and the original verification of the
original model may not apply to the slightly changed version. For this reason,
regulatory authorities should consider developing a standard set of benchmark
tests that model developers can use to verify and validate their codes. If small
changes to the code are made, all benchmark tests must be resolved to ensure
that no undesirable errors have been introduced. Benchmark testing would include
solving some simple steady-state and transient seepage examples using fixed
material properties where known solutions for the equation exist to validate the
numerical solution of the code under the most basic conditions. More advanced
benchmark tests should be available where individual theoretical components of
the models could be tested in isolation from other factors (e.g., actual evaporation
can be computed and compared against rigorously controlled laboratory experi-
ments). All input data, including material properties, would be listed in the
4040_book.fm Page 87 Wednesday, September 14, 2005 12:43 PM
© 2006 by Taylor & Francis Group, LLC
88
Barrier Systems for Environmental Contaminant Containment & Treatment
benchmark test documentation as would the required results. If the new model
cannot perform the basic benchmark tests, it is not acceptable for use in field
design.
A final point to consider is the establishment of a group of individuals who
can assemble the benchmark tests and can review and update the tests as new
and more advanced physics are introduced.
2.2.3.4 Verification, Validation, and Calibration
The verification, validation, and calibration of numerical models are key compo-
nents in the modeling process and are often the most poorly implemented and
misunderstood.
The key questions to ask when looking at models are what equations are
being solved, what assumptions have been applied to the equations, and how are
the equations being solved? For example, just because a model computes evap-
oration does not mean that it does so based on sound physical relationships or
that, if it is based on sound physics, the equations are solved properly. After a
model user has an understanding of the theory and physics incorporated into a
numerical code, they should satisfy themselves that the numerical solution for
that set of equations is correct. This is the verification stage of the modeling
process and is usually carried out by the model developer. Verification has nothing
to do with site data and everything to do with correct solution of the mathematics.
Verification and validation go together; where verification addresses solution
techniques and validation is the process of obtaining confidence that the model
applies to real situations represented by the theoretical formulations applied in
the model. Validation tests if the model theories actually apply to specific real
observations — whether they are laboratory experiments or field studies.
It is absolutely critical to validate a model based on known closed-form
solutions, known physical observations, and laboratory tests where all parameters
can be controlled and adjusted individually. Models cannot be validated using
field data alone because there is no direct control over or monitoring of all major
model parameters. For example, if a model is validated using site data where
precipitation, run off, change in water storage, and bottom drain fluxes are mea-
sured but actual surface evaporation and transpiration are not measured, then the
source of discrepancies between measured and computed results cannot be deter-
mined. There could be error in the model estimate of evaporation, or there could
be error in the field measurement of particular parameters. The most appropriate
use for field data in modeling is calibration of a previously validated model.
Calibration of a model involves making small adjustments to measured or
predicted model input parameters to obtain better matches between measured and
computed results data
at more than one instance in time
. In the ideal case, once
a model is calibrated for a site, it will give reliable results for the same site if
external parameters at that site change. For example, if precipitation is doubled
or halved, the change in soil responses can be predicted using a calibrated model
for that site only. The problem with calibration is that it only works if the model
4040_book.fm Page 88 Wednesday, September 14, 2005 12:43 PM
© 2006 by Taylor & Francis Group, LLC
Modeling of Fluid Transport through Barriers
89
physics truly represent the real physical processes in the ground. If the model is
rigorous enough and calibrated properly, then all physical processes measured in
the ground and predicted by the model should match. Calibration of nonrigorous
models such as HELP must be interpreted with caution because, in many cases,
the calibration can be achieved by adjusting only a single model parameter. When
this is done, the predicted and measured data only match for a single instance in
time. There is no guarantee that the adjustments made to the model to fit measured
data represent the true physical properties in the field. It may be possible to
calibrate HELP to match measured percolation data, but it is very unlikely that
parameters such as the temperature, water pressure, water stored in the soil, and
the root depth match field conditions at the same instance or at some other instance
in time.
2.2.4 U
NRESOLVED
M
ODELING
C
HALLENGES
There are many challenges facing model developer users. These challenges
include the difficulties in modeling systems with time-varying properties and
processes, the problems encountered in modeling infiltration at arid sites, and the
role of heterogeneities in modeling.
2.2.4.1 Time-Varying Material Properties and Processes
A major challenge facing modelers of cap performance is the time-varying nature
of climate, vegetation, and soil properties. All models of cap performance require
extensive climatic data, including precipitation, temperature, and solar radiation
to determine infiltration and evapo-transpiration. Although historic data are avail-
able for many locations, methods for estimating extreme values of these variables
are not well developed.
Physical deterioration of caps is commonplace, as they are easily impacted
by surface and climate processes. Changes in vegetation have an effect on run
off generation and evapo-transpiration. Establishment of shrubs and trees on caps
can lead to cap penetration by roots, creating high conductivity pathways for water
infiltration. Similarly, burrowing animals can create high conductivity conduits
through a cap. Erosion and subsidence can seriously impact cap performance.
The cracking of clay layers in caps due to freeze-thaw cycles or desiccation
(e.g., Albrecht and Benson, 2001) can significantly increase the effective hydrau-
lic conductivity of caps, leading to greatly increased water infiltration or vapor
escape. Albrecht and Benson (2001) found that clay hydraulic conductivities
increased by factors as high as 500 upon desiccation. Subsequent resaturation
did not lead to complete healing of dessication-induced cracks. Although cap
modeling can predict soil moisture levels in the cap, reliable models for changes
in cap hydraulic properties due to dessication or freeze-thaw have not been
developed.
Many caps are expected to provide environmental protection for decades or
centuries. Studies of cap stability and soil and geomembrane property stability
4040_book.fm Page 89 Wednesday, September 14, 2005 12:43 PM
© 2006 by Taylor & Francis Group, LLC
90
Barrier Systems for Environmental Contaminant Containment & Treatment
over these long periods of time have not been conducted. In addition, accurate
predictions of long-term climate changes and the occurrence and impact of
extreme events (e.g., earthquakes, floods, hurricanes, tornadoes) are not possible.
2.2.4.2 Infiltration at Arid Sites
Arid sites are characterized by levels of precipitation that are almost balanced by
loss mechanisms such as evaporation, transpiration, and run off. For water balance
models, the recharge is estimated by subtracting the losses from the predicted
production. Thus, small errors in either estimate can lead to large errors in
recharge estimates.
A second issue at arid sites is that evapo-transpiration models used in the
water balance models for disposal cells that are sparsely vegetated are not accurate
and tend to overpredict evapo-transpiration and underpredict recharge. The use
of physically based evapo-transpiration models (e.g., SoilCover, VADOSE/W)
that are formulated to shut down actual evaporation as ground surfaces dry greatly
improves infiltration estimates at arid sites.
2.2.4.3 Role of Heterogeneities
The most commonly used models for estimating flow through cover systems
assume uniform hydraulic and thermal properties for each layer of the cover
system. In practice, local heterogeneities are likely to be responsible for a large
portion of the flow through cover systems. The heterogeneities can arise naturally
and their impact on flow does not exist. For example, desiccation cracking is
known to occur in clay barriers and leads to increased flow. However, the capa-
bility to predict crack formation; the density of cracks; the changes in hydraulic
conductivity that occur due to cracking and subsequently rewetting; and, more
importantly, the change in flow through the layer does not exist.
For field performance, localized failure will often control infiltration through
the cover system. This leads to the need to develop procedures to adequately
represent these local failures using gross average properties for the layers.
2.3 PRBS
In recent years, PRBs have evolved from the realm of an experimental method-
ology to standard practice for containment and treatment of a variety of contam-
inants in groundwater. Like any remedial technology, the decision to use PRBs
is conditioned by the characteristics of the natural system, target contaminants,
and treatment objectives. More than 60 sites have implemented this technology
in the last few years to treat chlorinated solvents, fuel hydrocarbons, and various
inorganic contaminants in groundwater. As with any technology used to treat or
4040_book.fm Page 90 Wednesday, September 14, 2005 12:43 PM
© 2006 by Taylor & Francis Group, LLC
Currently, the capability to predict the occurrence of local heterogeneities
evolve in time (Section 2.3.5.1).
due to improper construction (e.g., leaks at seams, improper compaction) or
Modeling of Fluid Transport through Barriers
91
extract contaminants in the subsurface, successful implementation is contingent
on effective site characterization, design, and construction. Recent studies on
long-term PRB performance at a number of sites emphasize the following key
issues for successful use of PRBs:
•
Performing adequate site characterization on the scale of the
PRB
— Site characterization approaches, typical of Resource Conser-
vation and Recovery Act (RCRA) facility investigations (RFIs), are not
adequate. Performing additional localized characterization of the
plume distribution in three spatial dimensions and with time, under-
standing the local hydrogeology, and knowing the site geochemistry is
required.
•
Understanding site hydrology to achieve successful implementation
— PRBs must be located correctly to intercept the plume because once
located in the subsurface, they cannot be moved. It is therefore imper-
ative that the PRB captures the plume at the present time and in the
future allowing for variations in flow direction, velocity, and concen-
trations of contaminants over time.
•
Developing contingency plans for failure to meet design objectives
—
It is surprising that site owners and regulators often fail to explicitly
develop contingency plans. Contingency plan development requires
specification of design criteria and performance objectives and deter-
mination of what constitutes a failure in order to clearly trigger con-
tingency plan activation.
2.3.1 F
EATURES
, E
VENTS
,
AND
P
ROCESSES
A
FFECTING
P
ERFORMANCE OF PRBS
Design of PRBs requires consideration of groundwater hydraulics, geochemical
processes, and reaction kinetics and the interaction between these processes.
2.3.1.1 Groundwater Hydraulics
As with any groundwater remediation technology, an understanding of the direc-
tion and rate of groundwater flow spatially and temporally is critically important
for successful design. Groundwater hydraulics are particularly crucial for PRBs
because the treatment system is immovable and passive yet must intercept the
contaminant plume for effective treatment.
Groundwater flow is well understood, and groundwater modeling is a mature
technology (e.g., Bear and Verruijt, 1987; Anderson and Woessner, 1992). Many
computer models are available in the public and commercial domains that can
be utilized to perform quantitative predictions of transient 3-D groundwater flow
given appropriate input. The key difficulty in modeling groundwater hydraulics
is that critical variables that control groundwater flow typically exhibit a high
degree of variability spatially and temporally. These variables are difficult to
4040_book.fm Page 91 Wednesday, September 14, 2005 12:43 PM
© 2006 by Taylor & Francis Group, LLC
92 Barrier Systems for Environmental Contaminant Containment & Treatment
characterize with precision and sufficient resolution given physical and budgetary
constraints.
To assess PRB system performance, information is needed on groundwater
velocities through and near the planned PRB. On the simplest level, these values
can be estimated from observed hydraulic gradients and measured or estimated
hydraulic conductivities. Alternatively, groundwater velocities can be determined
with a numerical groundwater flow model based on estimated hydraulic property
distributions and hydrologic boundary conditions (i.e., water levels and/or fluxes
on model boundaries and recharge and extraction rates), which can vary tempo-
rally. In many cases, it is important to consider the effects of temporal changes
in flow direction and velocity due to variations in recharge, pumping of adjacent
wells, or other disturbances. It is not uncommon to observe changes in flow
direction on the order of 30˚ or more over time due to transient boundary
conditions. Furthermore, the PRB permeability itself can change markedly over
time in some situations (e.g., due to biological fouling or chemical precipitation
in or near the PRB), which can substantially impact the hydraulic regime.
Understanding site stratigraphy and lithology is crucial to understanding and
predicting groundwater hydraulics. If a low permeability layer exists at the site,
the PRB can be keyed into this layer. If one does not exist, then a hanging wall
design can be employed, but uncertainty regarding plume capture may increase.
If the site has low permeability layers through which the PRB must be constructed,
care must be taken during construction to avoid smearing of such layers, which
could impact hydraulic contact between the formation and reactive media. A
thorough understanding of site stratigraphy is important when choosing a partic-
ular construction method. For example, the use of sheet piling to construct a
reactive gate may not be a good choice where low permeability layers exist
because of smearing potential.
2.3.1.2 Geochemical Processes
The nature and extent of geochemical processes occurring within a PRB to a
large degree determine the long-term treatment performance of the barrier. The
details of these processes are site specific and associated with chemical, physical,
and biological factors such as the following:
• Reactive media type (e.g., zero-valent iron (ZVI), other metals, zeolite,
organic materials)
• Influent groundwater chemistry (e.g., pH; amounts of cations, anions,
and target contaminants)
• Microbiological environment within and around the PRB
•Physical conditions (e.g., temperature)
• The 3-D characteristics of groundwater flow within and near the PRB
There are several good sources that provide information about pilot and full-
scale PRB installations worldwide. Although new PRBs continue to be deployed,
4040_book.fm Page 92 Wednesday, September 14, 2005 12:43 PM
© 2006 by Taylor & Francis Group, LLC
Modeling of Fluid Transport through Barriers 93
summaries provided by the Air Force Research Laboratory (AFRL, 2000) and
on the Remediation Technologies Development Forum (RTDF) web site
that have been installed. Of these, the vast majority (approximately 85%) use
ZVI as the reactive medium. Other types of reactive media that have been inves-
tigated include other metallic materials (Gillham and O’Hannesin, 1992; Korte
et al., 1995; Muftikian et al., 1995; Orth and McKenzie, 1995; Bostick et al.,
1996; Hayes and Marcus, 1997), zeolite (Bowman et al., 2001; Rabideau and
Van Benschoten, 2002), various organic materials (Benner et al., 1997), apatite
(Conca et al., 2000; Fuller et al., 2002), and sodium dithionite injected as a
solution (Fruchter et al., 1997). The AFRL (2000) summarizes different PRB
media that have been investigated. The AFRL (2000) and the RTDF web site also
document the range of contaminants that are being treated by PRBs. Chlorinated
solvents such as trichloroethylene (TCE) and perchloroethylene (PCE) are the
dominant target contaminants, but others include metals and radionuclides
[e.g., Cr(VI), U(VI), Tc(VII)], other inorganics (e.g., NO
3
–
, SO
4
2–
), and other
organics (e.g., pesticides, toluene).
Because of the dominance of ZVI as a reactive medium in PRBs, the following
discussion focuses exclusively on geochemical processes occurring within it. ZVI
functions as a redox medium and treats contaminants by chemical reduction. At
the same time, the iron is sacrificially oxidized progressively from Fe(0) to Fe
2+
and, finally, Fe
3+
. The oxidized species of iron potentially can react with other
components in the groundwater to precipitate a variety of amorphous and crys-
have been formed by reactions occurring in ZVI PRBs.
The reaction of groundwater with ZVI causes several major compositional
changes that drive the formation of these reaction products. ZVI begins to dissolve
according to the following reactions:
2Fe
0
+ 2H
2
O + O
2
(aq) = 2Fe
2+
+ 4OH
–
Fe
0
+ 2H
2
O = Fe
2+
+ H
2
(aq) + 2OH
–
The first reaction involves the scavenging of dissolved oxygen by ZVI and is
known to be a fast reaction because column and field studies show the complete
absence of dissolved oxygen within a few centimeters of the influent face of a
PRB. The second reaction prevails once the oxygen is gone and is slower. Both
reactions result in a significant decrease in redox potential and a dramatic rise in
pH, both of which are observed in typical ZVI PRBs. The magnitude of change
in pH depends on the detailed chemistry of the influent groundwater, its buffering
capacity, and the rate of groundwater flow through the barrier. For example, high
alkalinity groundwater is more resistant to a change in pH. However, the large
available mass of ZVI in PRBs tends to overwhelm any redox buffering capacity
of the groundwater.
4040_book.fm Page 93 Wednesday, September 14, 2005 12:43 PM
© 2006 by Taylor & Francis Group, LLC
talline phases as described below. Table 2.3 lists secondary phases that reportedly
( identify more than 50 PRBs
94 Barrier Systems for Environmental Contaminant Containment & Treatment
The oxidation of ZVI (and associated decrease in groundwater redox poten-
tial) and the dramatic pH rise are the two principal factors that result in the
formation of new solid phases, many of which are iron bearing (Table 2.3). Some
of these phases that contain either Fe
2+
(e.g., amorphous ferrous oxyhydroxides,
FeS, FeCO
3
) or mixed Fe
2+
and Fe
3+
(e.g., Fe
3
O
4
, green rust) also are effective
reducing agents for metals, radionuclides, and organics in groundwater. Conse-
quently, the formation of these reduced iron phases does not necessarily signifi-
cantly diminish the reactivity of the barrier media. However, not all phases formed
in a PRB are iron-bearing. For example, the increase in pH can also lead to
precipitation of various carbonate minerals (e.g., calcite, aragonite) if the influent
water has sufficient amounts of dissolved alkalinity and calcium. The mix of solid
phases formed and their order of precipitation depend on influent groundwater
chemistry, the complex interplay of changing redox potential and pH in the system
as ZVI dissolves, reaction rates, factors affecting the nucleation of phases, and
groundwater flow rate. The ability to predict these reactions and estimate their
One concern associated with secondary mineral formation in PRBs is that
these phases passivate the ZVI media, decreasing its reactivity and ability to treat
contaminated groundwater. Farrell et al. (2000) reported an example of ZVI
passivation with results of long-term column experiments in which they observed
an over six-fold decrease in the reactivity of ZVI to TCE in the two-year experiment.
TABLE 2.3
Examples of Precipitated Minerals Found in Fe(0) Field-
Installed PRBs and Column Studies
Mineral Precipitate Group Minerals
Iron oxides and oxyhydroxides Goethite (α-FeOOH)
Akaganeite (β-FeOOH)
Lepidocrocite (γ-FeOOH)
(Maghemite (Fe
2
O
3
))
Magnetite (Fe
3
O
4
)
Amorphous iron oxyhydroxides
Iron sulfides Mackinawite (Fe
9
S
8
)
Amorphous ferrous sulfide (FeS)
Carbonates Aragonite (CaCO
3
, orthorhombic)
Calcite (CaCO
3
, hexagonal)
Siderite (FeCO
3
)
Green Rusts GR-I (CO
3
2–
) (Fe
4
2+
Fe
2
3+
(OH)
12
)(CO
3
⋅2H
2
O)
GR-I (Cl
–
) (Fe
3
2+
Fe
3+
(OH)
8
Cl)
GR-II (SO
4
2–
) (Fe
4
2+
Fe
2
3+
(OH)
12
)(SO
4
⋅2H
2
O)
Source: Liang, L., Sullivan, A.B., West, O.R., Kamolpornwijit, W. and Moline,
G.R., 2003. Predicting the precipitation of mineral phases in permeable reactive
barriers. Environ. Eng. Sciences. Vol 20(6): p. 635.
4040_book.fm Page 94 Wednesday, September 14, 2005 12:43 PM
© 2006 by Taylor & Francis Group, LLC
impact on PRB performance is discussed in Section 2.4.4.
Modeling of Fluid Transport through Barriers 95
The authors found that the degree of passivation was related to the adhering
ability of secondary minerals and not the overall mass of these phases formed.
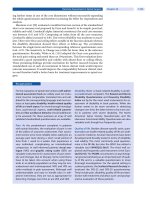
A number of PRBs have been cored and the media examined to understand
the formation of secondary minerals (e.g., Puls et al., 1999a; Vogan et al., 1999;
Phillips et al., 2000; Roh et al., 2000). Typically, cores are obtained by angle
drilling through the vertical influent face of the barrier to provide a cross section
extending into the PRB interior, capturing the precipitation that is expected to be
the most significant at the sediment–ZVI interface. Analytical methods such as
X-ray diffraction (XRD) and scanning electron microscopy (SEM) typically are
used to examine the solid phases that have formed. Table 2.4 illustrates differences
in groundwater chemistry and resultant secondary minerals observed in PRBs at
the Canadian Forces Base Borden in Ontario, Canada (O’Hannesin and Gillham,
1998) and the USDOE Y-12 plant in Oak Ridge, Tennessee (Phillips et al., 2000).
The low dissolved solids groundwater at the Borden site has resulted in little
formation of new solid phases over a period of four years, and most precipitation
TABLE 2.4
Groundwater Chemistry of Two Different PRB Sites and the Secondary
Phases Observed in Each
Chemical Constituent
Concentration (mg/L)
Canadian Forces Base Borden USDOE Y-12 Plant
Na 4 8.9
K 0.4 3.6
Ca 55 361
Mg 4 20.5
Total Fe <0.5 0.02
Cl 3 55
SO
4
5–10 47
SiO
2
Not available 3.8
NO
3
Not available 904
Alkalinity (as CaCO
3
) 158 220
pH (unitless) 7.9 6.8
Eh (mV) 300 Not available
Dissolved oxygen 2.5-5 Not available
Secondary minerals
observed:
Traces of iron oxides CaCO
3
(aragonite)
CaCO
3
Fe
2
(OH)
2
CO
3
FeCO
3
FeCO
3
(After four years of operation; no
cementation; mineralization
confined to within several
millimeters of influent face of
the PRB)
Goethite
Maghemite
Amorphous iron oxide
Green rust
Mackinawite (Iron media cemented
extensively at influent face)
4040_book.fm Page 95 Wednesday, September 14, 2005 12:43 PM
© 2006 by Taylor & Francis Group, LLC