Climate Change and Managed Ecosystems - Chapter 9 ppt
Bạn đang xem bản rút gọn của tài liệu. Xem và tải ngay bản đầy đủ của tài liệu tại đây (862.53 KB, 26 trang )
175
9
Forests in the Global
Carbon Cycle:
Implications of
Climate Change
M.J. Apps, P. Bernier, and J.S. Bhatti
CONTENTS
9.1 Introduction 175
9.2 Climate Change and the Global Carbon Cycle 176
9.3 Human Perturbations to the Global Carbon Cycle 178
9.4 Forest Sources and Sinks at the Stand and Landscape Scale 178
9.5 Land-Based Carbon Sink and Its Future 184
9.6 Mitigation Opportunities 185
9.6.1 Forest Management to Increase or Maintain Terrestrial
Ecosystem Carbon 186
9.6.2 Managing Products and Services Derived from Forests for
C Benefits 187
9.6.3 Forest Products as a Manageable Carbon Pool 190
9.6.4 Use of Forest Biomass for Bioenergy 192
9.7 Conclusions: The Global Forest Sector and the Global Carbon Cycle 193
Acknowledgments 195
References 196
9.1 INTRODUCTION
As a consequence of human activity, Earth’s climate has changed during the last
100 years and will change significantly for centuries to come.
1
The predicted changes
for the next 50 to 100 years and beyond are both larger and faster than previously
thought,
2,3
and also more certain.
4
Recent assessments indicate that, in the absence
of purposeful mitigation interventions, it is likely that changes in the global mean
temperature over the next 100 years will be at the high end of, or even exceed the
IPCC 2001 predictions of +1.4 to 5.8°C above 1990 temperatures
4
— itself a decade
of record-breaking temperature.
5
© 2006 by Taylor & Francis Group, LLC
176 Climate Change and Managed Ecosystems
The change is not expected to be a simple linear increase in temperature or other
climatic variable: abrupt and likely unpredictable changes similar to those seen in
the geological record must be anticipated in the future. The impacts that have already
been reported through the 20th century can be expected to intensify over the 21st,
disrupting natural ecosystems and the services society has come to depend on, at
all spatial scales from local to regional and global.
Moreover, the change has not been — and will not be in the future — distributed
evenly over the Earth; climate change is greatest at mid- to high latitudes and over
the continental landmasses found in North America, Europe, and Asia where large
carbon pools are currently found in forest ecosystems. In these regions, local bio-
geochemical processes will likely experience profound changes in prolonged grow-
ing season, intensified incidence of drought and fire, systematic changes in annual
snow accumulations, and an overall mobilization of large pools of ecosystem C,
from forested uplands to forested wetlands.
6
Climate change is arguably the most important environmental issue of the 21st
century. It will have significant implications for resource management strategies.
Are forests and forestry part of the problem or part of the solution?
6
This chapter
examines the contribution of northern forest ecosystems, especially the contribution
of their management to the global carbon cycle.
9.2 CLIMATE CHANGE AND THE GLOBAL
CARBON CYCLE
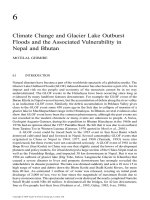
Throughout at least the last four glacial cycles, spanning nearly 1.5 million years
prior to the 20th century, the atmospheric concentration of CO
2
only varied between
~180 ppmv during glaciations, when the global temperature was 8 to 9°C colder
than today, and ~280 ppmv during the interglacial periods when the temperature
was similar to present values (Figure 9.1A). This narrow range of variation in
atmospheric CO
2
is remarkable given that its concentration is determined by a highly
dynamic biogeochemical cycle. Every year, approximately 16% of the CO
2
in the
atmosphere (approximately 760 Gt C) is taken up through photosynthesis by vege-
tation, and an almost identical amount is released by the respiration of vegetation
and heterotrophs feeding on that vegetation. A similar exchange of ~90 Gt C yr
-1
takes place at the ocean surface where phytoplankton provide the photosynthetic
engine driving the exchange.
7
This generally tight domain of stability between variations in CO
2
and global
temperature (Figure 9.1B) suggests that the global carbon cycle has been controlled
by powerful biological feedback processes that have maintained the climate in a
habitable range. The biosphere appears to play a central role in regulating Earth’s
climate, a suggestion strongly reinforced by the physics of the greenhouse gas
feedbacks. The biosphere–climate system coupling includes other factors, such as
surface reflectance properties (albedo), that have effects both regional and global in
extent (see, e.g., Reference 8), but here our focus is restricted to the global carbon
cycle.
© 2006 by Taylor & Francis Group, LLC
Forests in the Global Carbon Cycle: Implications of Climate Change 177
FIGURE 9.1 (A) Variation in atmospheric CO
2
from analysis of ice cores over four glacial
cycles during the last 420,000 years. Present levels (>360 ppmv) are indicated by the arrow.
(B) The stability domain of atmospheric CO
2
and global temperature over the last four glacial
cycles, showing recent departures and possible shift to a new domain of unknown stability.
(Adapted from Falkowski et al.
7
)
CO
2
CO
2
CO
2
Narrow range of CO
2
variation:
~180 ppm to ~280 ppm
Warm - deglaciation, 280 ppm
Cold - glaciation, 180 ppm
Thousands of years
atmospheric CO
2
(ppmV)
-450 -400 -350 -300 -250 -2000 -150 -100 -50 0 50
400
350
300
250
200
150
Present
Future
mode?
Mode for
past million
years or more
Temperature
-10 -5 0 5
CO
2
350
300
250
200
150
Deglaciations
Glaciations
B
A
© 2006 by Taylor & Francis Group, LLC
178 Climate Change and Managed Ecosystems
In contrast to the long-term record, the atmospheric CO
2
concentration today is
~370 ppmv — nearly 100 ppmv higher than at any time in at least the past 1.5
million years — as a result of human perturbations to the global carbon cycle. The
concentration is also rising at a rate that is at least 10, and perhaps as much as 100,
times faster than ever before observed.
7
Clearly, the biosphere’s ability to regulate
the global carbon cycle — and hence the climate system — has been exceeded by
human-induced carbon emissions.
9.3 HUMAN PERTURBATIONS TO THE GLOBAL
CARBON CYCLE
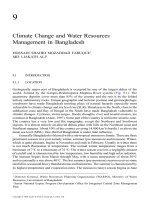
Human perturbations to the carbon cycle have been both direct and indirect (Figure
9.2). On land, human activities have modified vegetation patterns and functioning
in global proportions, while changes to freshwater inputs and pollutant eutrophica-
tion of the oceans have altered their ecology as well. In other words, humans have
changed the very nature of the biospheric systems that are responsible for biospheric
exchange of CO
2
. In addition, and more significantly, human use of fossil fuels has
introduced additional, new carbon into the active
*
global carbon cycle through the
combustion of fossil fuels. Deforestation — removal of forest vegetation and replace-
ment by other surface cover — has had a twofold impact on the carbon cycle: the
loss of photosynthetic capacity in forest vegetation, and the release of the large
carbon stocks that had accumulated in these forest ecosystems over long periods.
Indirect human impacts on the carbon cycle include changes in other major global
biogeochemical cycles (especially nitrogen),
9
alteration of the atmospheric compo-
sition through the additions of pollutants as well as CO
2
, and changes in the biodi-
versity of landscapes and species — all of which are believed to significantly
influence the functioning of the biosphere.
9.4 FOREST SOURCES AND SINKS AT THE STAND AND
LANDSCAPE SCALE
A forest ecosystem is a sink (source) when it effects a net removal (release) of
atmospheric CO
2
. The sink results when the uptake through photosynthesis results
in an increase in the sum of the carbon stocks retained in the forest vegetation itself
and in the stocks of organic carbon in other material derived from the forest. The
most important of these derived reservoirs are the detritus and soil organic matter
pools. The net carbon balance of the ecosystem may be calculated as the net change
over time in total ecosystem carbon stocks (dC
ecosys
/dt, where C
ecosys
is the sum of
carbon stocks in vegetation, forest floor and soil). Ignoring for the moment any
export of organic carbon from the ecosystem, the net carbon balance is identical to
the net ecosystem productivity (NEP):
*
“Active” is used here to distinguish the carbon pools and processes that dominate the exchange that
occurs on time scales of order of years to decades from those that are important on geological time
scales, such as the accumulation of organic carbon in fossil fuel deposits.
© 2006 by Taylor & Francis Group, LLC
Forests in the Global Carbon Cycle: Implications of Climate Change 179
Net Carbon Balance = dC
ecosys
/dt (9.1)
dC
ecosys
/dt = NEP = GPP– R (9.2)
where GPP (gross primary production) is the rate of CO
2
uptake by foliage through
photosynthesis and R = R
a
+ R
h
is the total ecosystem respiration flux comprising
autotrophic (plant) respiration R
a
and heterotrophic respiration R
h
(decomposition)
of the accumulated detritus and soil pools.
The term net biome production (NBP) is sometimes used to account for exported
carbon and its subsequent decomposition outside the ecosystem:
11
NBP = NEP – R
exp
(9.3)
where R
exp
is the flux of carbon transferred out of the ecosystem. Forest products
form an important part of the offsite carbon pools in that the timing and manner of
their decomposition is (in principle at least) under human control.
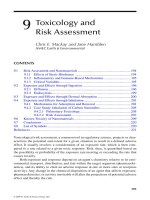
Figure 9.3 shows the conceptual pools and transfers of carbon involved in forest
ecosystems and the forest sector. To provide a comprehensive system, the ecosystem
compartments (vegetation and detritus and soil pools), the exported pools that are
located offsite (including forest products and the waste created during their manu-
facture and abandonment in landfills), and the influence of the forest sector on fossil
fuel use are all included.
The net accumulation of carbon in the ecosystem (or the larger system shown
in the figure) is thus a summation over time of the difference between a large ingoing
CO
2
flux (GPP) and a nearly equal outgoing flux (R). Different processes, whose
rates differ over time and space and vary both with environmental conditions and
the state of the ecosystem, control the two fluxes. The processes involved include
FIGURE 9.2 Human-induced perturbations (Gt C yr
–1
) to the global carbon cycle during the
1990s. The arrow widths are proportional to the fluxes. Land uptake is inferred as the residual
required to balance the other fluxes with the observed accumulation (airborne fraction) in the
atmosphere. (Data from Houghton.
10
)
3.2 ± 0.2 GtC/yr
Airborne Fraction
6.3 ± 0.4
F Fuel,
Cement
2.2 ± 0.8
Land-Use
Change
2.9 ± 1.1
Land uptake
2.4 ± 0.8
Oceans
Reduce SourcesMitigation: Increase Sinks
Surface biosphere
Atmosphere
© 2006 by Taylor & Francis Group, LLC
180 Climate Change and Managed Ecosystems
both those regulating the internal redistribution of organic carbon within the eco-
system, such as allocation of photosynthate within the plants and breakdown of fresh
litter into less decomposable forms of soil organic matter, and disturbances (such
as windthrow, insect predation, harvest, or fire).
Disturbances are discrete events that are particularly interesting because they
generate large pulses of internal transfers of carbon between pools within the eco-
system or out of it (e.g., harvest). They therefore bequeath a legacy of increased
decomposition emissions in the future. In addition, disturbances such as fire may
FIGURE 9.3 Carbon fluxes (arrows) and pools (boxes) involved in the forest sector budget.
Smoothly varying fluxes include GPP = gross primary production, R
a
= autotrophic respiration,
R
h
= heterotrophic respiration, R
off
= offsite respiration, L = litter fall (above- and belowground
AG and BG) and leaching from DOM (dead organic matter) on the forest floor and in soils.
Pulsed fluxes (dotted lines) are associated with disturbances. R
exp
, the carbon flux that is
exported to offsite carbon pools, has both a smooth component (leaching) and a pulsed
component (from disturbances). Fluxes from offsite carbon pools (products, landfills, POC =
particulate organic carbon, DOC = dissolved organic carbon in water or air) are lumped into
one flux R
off
. The influence of bioenergy and use of forest products on fossil fuel use is shown
as a control valve on fluxes from fossil fuel use (R
ff
) and cement production (R
cem
) production.
Vegetation
AG and BG
600 GtC
Dist Dist
GPP
R
a
R
dist
R
h
R
off
R
ff
+ R
eem
L
Rexp Rexp
DOM
Litter, CWD, Soils
2000 GtC
Export
Products, landfill, POC, DOC
Fossil
Reserves
Forest
Ecosystem
Offsite
Forest Sector
ΔC
atm
= Σ (flux) = Σ (ΔC
i
)
Atmosphere C
atm
= 760 GtC
© 2006 by Taylor & Francis Group, LLC
Forests in the Global Carbon Cycle: Implications of Climate Change 181
also generate large, immediate CO
2
releases to the atmosphere. The complex set of
processes — operating independently over a range of timescales — gives rise to
rich variation in NEP (and NBP) in both time and space.
The net carbon balance in a forest ecosystem (NEP) can be estimated by sum-
ming all the changes in ecosystem carbon stocks (the “stock inventory” method),
direct measurement of the net exchange of CO
2
with the atmosphere (using, for
example, eddy covariance techniques), or a combination of these methods. Provided
all stocks and fluxes are accounted for, the approaches must give identical answers
(a result of the principle of conservation of mass), as has been shown by careful
experiments at the Harvard forest and several other locations.
12
The net carbon balance of a stand of trees or patch of forest varies with the
prevailing conditions that affect both the rates of CO
2
uptake and release (Figure
9.4A). It also depends very strongly on the past history of the stand or site. For
example, the net carbon balance (NBP) of a clear-cut stand is initially highly negative
(when the harvest carbon is removed from the site — an export flux not directly
captured by net ecosystem exchange flux measurements) and remains so for several
years while the releases of CO
2
from decomposition of slash and soil carbon exceeds
the CO
2
uptake of regrowing vegetation. Eventually the uptake through regrowth
exceeds decomposition efflux, at which time above- and belowground detrital pro-
duction starts to rebuild the depleted stocks on the forest floor and in the soil. NEP
then rises steeply to a maximum rate that typically occurs around or shortly after
canopy closure. As the ecosystem continues to age and more organic carbon accu-
mulates in the vegetation, forest floor, and soils, the respiration efflux from these
reservoirs also increases. Rates of photosynthetic input tend to level off as the stand
approaches maturity, and net primary productivity may even decline when stand-
breakup occurs in overmature stands.
13,14
Thus in older stands, the net carbon balance
(NEP) tends toward zero (or even becomes negative) as decomposition of the soil
and detritus layer approaches that of the photosynthetic inputs. In some ecosystems,
such a decrease in NEP may take a very long time after the last carbon-removing
disturbance.
11
At the landscape (or biome) scale, a forest comprises many stands of trees
(individual ecosystems) in various stages of development (Figure 9.4A), and the net
carbon balance at this scale is the integration across all such ecosystems in the
landscape. Here, for illustrative purposes, only even-aged forests such as are found
in disturbance-dominated natural forests or in clear-cut plantations are considered:
the principles apply, however, to all forests. For forests dominated by even-aged
stands, the stand age-class distribution can be used to facilitate the summing across
ecosystems in different stages of development. For a forest comprising only one
ecosystem type, the total ecosystem carbon in the landscape is
(9.4)
and its change over time is
CCA
landscape i i
i
N
=
=
∑
1
© 2006 by Taylor & Francis Group, LLC
182 Climate Change and Managed Ecosystems
FIGURE 9.4 Carbon dynamics at the stand and landscape scale: (A) stand-level C dynamics
after disturbance at t
0
. The stand is a source until t
1
, but does not recover C lost at an
immediately after the disturbance until t
2
; (B) stable age-class distributions for “normal forest”
(rotation T
R
) and random disturbance-regulated forest (return interval t); (C) stand-level
accumulation rate. For landscape pools, sum product of a * b over all age classes; similarly
sum product of c * b for changes in pools in unchanging conditions.
A
C
i
(tC ha
-1
)
dC /dt
(t Ch a
-1
yr
-1
)
B
A
i
(ha)
C
Ecosystem total
Vegetation
Detrius and soil
disturbance
regulated forest
‘normal’
forest
stand age (yrs)
stand age (yrs)
Sum over age classes in landscape to get totals:
age class (yrs)
t
1
t
2
T
R
t
0
τ
C
landscape
= Σ C
i
x A
i
dC
landscape
/dt = Σ (A
i
dC
i
/dt + C
i
dA
i
/dt)
© 2006 by Taylor & Francis Group, LLC
Forests in the Global Carbon Cycle: Implications of Climate Change 183
(9.5)
where A
i
is the area (ha) of forest in age class i, and C
i
is the carbon concentration
(Kg C ha
–1
) of this age class. For a more general heterogeneous forest, the total
landscape carbon involves additional summations over all the distinguishable
ecosystem types (each characterized by a different carbon accumulation curve).
Moreover, the actual carbon accumulation curve (Figure 9.4A and C) changes
with disturbance type and intensity as each may leave different amounts of litter
and hence different legacies of decomposition pulses; the actual site history has
a direct effect. This generally involves additional summations over disturbance
types and inevitably requires historical information about past disturbance
regimes.
15
Changes in the net carbon accumulation at the landscape scale (Equation 9.5)
thus has two components:
1. Changes in productivity of the individual ecosystem growth and respira-
tion responses to environmental variations (functional response, alter-
ations to curves in Figure 9.4A and C)
2. Changes in the age-class distribution associated with landscape variation
in mortality and recruitment (structural response, alterations to curve in
Figure 9.4B)
Over long enough times, succession alteration to the distribution of vegetation types
will also take place, providing further structural and functional responses and
changes in NEP.
At any given time, the age-class distribution is a direct result of the cumulative
effects of mortality and recruitment to that point in time, and for the even-aged
forests discussed here, is a direct reflection of the history of past disturbances. Under
a steady disturbance rate (such as a constant fire return interval, or a fixed harvest
rotation), the balance between mortality and recruitment leads to a stable age-class
distribution that can maintain its shape over time. An example of such distributions
is the managed “normal forest”
*16
associated with sustainable harvesting and regen-
eration of stands in a plantation, in which each age-class occupies an equal area up
to the rotation age T
R
(Figure 9.4B). Another example is the (approximately) expo-
nential age-class distribution (also shown in Figure 9.4B) that is associated with
randomly occurring disturbances, applied with equal probability to all ages, and
having a constant mean return rate and variance. Such distributions are often found
(but not always) with naturally occurring disturbances such as wild fire, windstorms,
and some insect outbreaks.
17,18
Sources and sinks at the landscape scale are created when the disturbance rate
changes. If the disturbance rate increases, the age-class distribution shifts to the
*
The term “normal” is used here in a technical sense (see MacLaren
16
) and not as the common adjective
to imply “usual” or “average.”
dC dt A dC dt C dA dt
landscape i
i
N
iii
=+
=
∑
()
1
© 2006 by Taylor & Francis Group, LLC
184 Climate Change and Managed Ecosystems
left (younger), and the total carbon retained in the ecosystems in the landscape
decreases. The landscape becomes a net source of CO
2
to the atmosphere while
its age-class distribution adapts to the new disturbance regime. (If some of the
lost carbon is transported out of the ecosystem landscape to decompose in offsite
reservoirs, such as the case of forest products, the landscape source is reduced by
that amount — in essence this component of the source is exported.) Similarly, if
disturbances are suppressed, the ages shift to the right, the forest ages and carbon
stocks increase with a net removal of CO
2
from the atmosphere. Taking changes
in disturbance regimes into account is clearly important in predicting the future
carbon budgets of forested regions.
9.5 LAND-BASED CARBON SINK AND ITS FUTURE
Until recently, the net land-based carbon sink required to balance the perturbed
global carbon budget (Figure 9.2) was thought to be fully explained by changes in
ecosystem functioning. Enhanced forest uptake rates (increased GPP) associated
with elevated atmospheric CO
2
, increased nutrient inputs from pollution, and a
positive response to global temperature increases were used to close the global
budget. However, although physiological mechanisms and normal climate variations
may explain some of the short-term changes (seasonal to inter-annual) in forest
ecosystem uptake (GPP), their ability to cause longer-term net uptake and retention
(GPP-R) has been questioned by a number of authors (e.g., References 19 and 20).
It is now recognized that changes in the structure of ecosystems, especially the
age-class structure of forests, are at least as important as the functional changes. For
example, changes in land-use practices, such as abandonment of marginal agricul-
tural lands to forest and the rehabilitation of previously degraded or deforested lands
has been shown to be largely responsible for the putative North American sink,
21
and a much larger contributor than any of the proposed physiological mechanisms
such as CO
2
fertilization.
22
Change in the climate regime may also affect current carbon pools of forests,
although the direction and magnitude of these changes is still uncertain and difficult
to predict. Over periods of years to decades, the stimulation of GPP through longer
growing seasons should result in increased vegetation biomass, an effect that may
already be apparent in the global atmospheric CO
2
record.
23
However, although GPP
may increase with increased temperature, so may the heterotrophic decomposition
rate — approximately doubling for each 10°C increase in soil temperature. Given
the very large size of the C stocks in forest litter and soil pools, this gives rise to
concern that increased heterotrophic respiration may generate a positive feedback
mechanism to climate change by releasing additional quantities of CO
2
in the
atmosphere. Recent work, however, suggests that in some ecosystems, increased
heterotrophic respiration may be largely offset by increased detrital production by
trees, leaving detrital and soil carbon content relatively unchanged as long as the
forest composition remains unaltered.
24
At longer timescales (decades to centuries and longer), changes in the vegetation
itself take place through successional processes as the ecosystems adapt to changing
conditions. These longer-term changes may lead to either greater carbon stocks, as
© 2006 by Taylor & Francis Group, LLC
Forests in the Global Carbon Cycle: Implications of Climate Change 185
in more productive forest ecosystems, or smaller stocks, as in a transition to a
grassland ecosystem. Comparison of relative pool sizes for boreal, temperate, and
tropical forests suggests a general shift of dominance from belowground to above-
ground stocks as temperatures warm. Over the intermediate term, the expansion of
forests into existing nonforest regions, such as the northward expansion of the boreal
forest, may provide some additional uptake. This expansion, however, is a slow and
uncertain process (e.g., Reference 25) and over the short term will likely be more
than offset by possible dieback of forests at the other end of their range. Such dieback
and transition to grasslands in southern boreal forests in south central Canada have
been suggested by several authors,
26–28
and can happen extremely quickly if driven
by more frequent or more intense large-scale disturbances such as fire.
29
One of the
major causes of uncertainty is the unprecedented rate of current climatic changes
that are taking place over timescales that are out of synchrony with the dominant
processes of some ecosystems and beyond their adaptive capacity.
30
In addition, for each of the stimulation mechanisms there typically exists limiting
factors that eventually counteract it over time.
19
Elevated levels of ambient CO
2
increase the photosynthetic efficiency of foliage, but as the concentration increases,
this stimulation decreases and saturates at atmospheric concentrations that may be
reached in the next 50 to 100 years.
31
To date, in situ fumigation of stands with elevated
CO
2
for periods for 3 years has yielded consistently high GPP values, but the future
of this effect remains uncertain.
32
Although initial response to increased N inputs
associated with atmospheric pollution is growth enhancement, at higher loadings
(already reached in some areas), the effects of acidification may lead to net
decreases.
33,34
Moreover, there is good evidence that the response of forest ecosystems
to either CO
2
or N fertilization will be short-lived when other required resources, such
as water or other nutrients, become limited. Results from stand-level fumigation studies
also show that tropospheric ozone may counteract the growth enhancement offered by
increases in CO
2
.
35
Thus, while many ecosystems studied to date indicate an initial
positive response in NEP to these manipulations, they also show an acclimation over
time to these stimuli — usually interpreted as a combination of subtle changes in the
ecosystem structure and the onset of another limiting factor.
3
Finally, there are concerns that climate change will bring about changes in the
disturbance regimes (rate, intensity, and form). Although fire
36
is the best known of
these disturbances, changes in insect dynamics, drought stress, ozone and ultraviolet
damage, and damage from hurricane or severe storms may be more important in
some regions.
37–40
The impact of changes in disturbance regime over the last few
decades in Canada’s forests — suggestive of, but not definitively shown to be due
to climate change — appears responsible for a shift of these forests from a significant
sink to a small source of atmospheric CO
2
.
15
9.6 MITIGATION OPPORTUNITIES
There are two fundamental mitigation interventions:
1. Reduce emission sources, or
2. Increase sinks
© 2006 by Taylor & Francis Group, LLC
186 Climate Change and Managed Ecosystems
Land management, and especially forestry and forest management, can contribute
to both of these opportunities. Interventions that maintain healthy ecosystems can
also maintain, or even increase, land-based carbon stocks. Using forest goods and
services can simultaneously help to reduce anthropogenic emissions of CO
2
typi-
cally generated by alternative supplies of these goods and services. These two
opportunities are not mutually exclusive, and will be briefly described in very
broad terms.
9.6.1 FOREST MANAGEMENT TO INCREASE OR MAINTAIN
T
ERRESTRIAL ECOSYSTEM CARBON
The ultimate aim of mitigation strategies, such as put in place by the Kyoto
Protocol, is “the stabilization of greenhouse gas concentrations in the atmosphere
at a level that would prevent dangerous anthropogenic interference with the climate
system.”
41
Mitigation strategies that promote the preservation and maintenance of
healthy ecosystem functioning may therefore be as valuable as land-management
strategies that aim to enhance the net uptake, and decrease the releases of CO
2
in
terrestrial ecosystems, the so-called terrestrial sinks (and sources) of the Kyoto
Protocol.
It is beyond the scope of this chapter to attempt a detailed review of the different
schemes for ecosystem carbon management that have been proposed, or their eco-
nomic, ecological, and social impacts. The IPCC has provided in-depth analyses in
two major reports released in 2000
42
and 2001,
43
and good practice guidelines for
managing terrestrial forest ecosystems in the context of carbon sequestration.
44
The
various forest ecosystem management activities that have been proposed
43,45
can be
grouped into three broad approaches:
1. Strategies to maintain and preserve existing forests
2. Strategies to increase the area of land under forest
3. Strategies to increase the carbon stock density on the forested land (C ha
–1
)
Much of the focus on carbon sequestration in forests ecosystems has been on
enhancement of aboveground biomass as a natural extension of timber production
forestry. Recently, a shift to more comprehensive ecosystem management appears
to be taking place, together with renewed opportunities and interest in rehabilitating
degraded lands, mitigating the effects of deforestation, and managing for natural
values (such as wildlife or water quality), not merely for timber. The success of
different approaches in any given region depends on prevailing social, economic,
and historical conditions. In some regions such as in the central part of Canada,
slowing, halting, and mitigating deforestation associated with infrastructure may
provide the most efficient strategy, while in other regions, such as central British
Columbia, more traditional timber production approaches combined with protection
from disturbance may be more attractive.
Protection against disturbance is not, of itself, an efficient or long-term mitigation
measure. This is especially true of wildfire where large expenditures simply protect
carbon are analogous to paying high rent: the carbon is retained only as long as the
© 2006 by Taylor & Francis Group, LLC
Forests in the Global Carbon Cycle: Implications of Climate Change 187
protection continues and is lost when the next fire comes along. However, if the
protected area is subsequently harvested, transferring carbon to long-lived forest
products, and successfully regenerated, a potentially significant carbon gain can be
realized — both within the offsite and within the forest ecosystem pools (Figure
9.3). In the forest ecosystem, the combination of protection and harvesting can be
visualized as an increase in the effective rotation length (see Figure 9.4), and as
demonstrated by Kurz et al.
46
the transition from a natural disturbance regime to a
managed one (including protection) can have positive carbon benefits.
Increased carbon stocks can also be accomplished through techniques that
reduce the time for stand establishment (such as site preparation, planting, and
weed control), increasing resources (especially nutrients) required for growth, or
through the selection of species that are more productive for a particular area.
Decreasing the losses can be accomplished through modification of harvesting
practices such as low-impact harvesting (reduce damage to residual trees and soil
structure), increased efficiency (reduced logging residue), and managing residues
to leave carbon on site.
45
Despite the interest in all of these techniques, fundamental
scientific questions remain about how the ecosystems will respond to a rapidly
changing climate, including the allocation of photosynthate between above- and
belowground compartments, regeneration success, growth vs. respiration responses
— all of which have a direct influence on the carbon benefit a given technique
will achieve.
Nutrient fertilization has long been used to enhance stand productivity and can
result in increased C stocks in trees and soils,
47
but its success is dependent on the
site conditions, and is therefore potentially susceptible to rapid climate changes. For
example, on more fertile sites the effect of fertilization is reduced as other factors
begin to limit growth.
48
For planting, species selection and stocking are important
considerations and, depending on the management objective, planting fast-growing
species such as hybrid poplar can yield high carbon accumulation rates in early
years.
49
For long-term sequestration, however, planting species adapted to the local
climate may be more effective.
49
But what will be the local climate as the trees
approach maturity?
In all such interventions aimed at increasing forest ecosystem, or offsite, carbon
stocks, it is necessary to account for fossil fuel consumed in plantation establishment,
maintenance, and harvesting (see Figure 9.3). Thus while short rotation plantations
can provide an excellent opportunity to displace fossil fuel and, at the same time
provide (on average) a significant carbon stock in the plantation, significant direct
and indirect (fertilizer production) expenditures of fossil fuel are usually required
to realize these gains. An overview of forest-relevant, C sink-source interventions
is provided in Table 9.1.
9.6.2 MANAGING PRODUCTS AND SERVICES DERIVED FROM
F
ORESTS FOR C BENEFITS
Products extracted from managed forest ecosystems play multiple roles in the global
carbon cycle:
© 2006 by Taylor & Francis Group, LLC
188 Climate Change and Managed Ecosystems
TABLE 9.1
Classes of Management Activities, Cost and Benefits
Intervention Cost Comments
Short Term
(<25 yrs)
Longer
Term
Maintain and Preserve Existing Forests
Preserve primary forests
a
Future opportunity costs No new sink added
Sink already accounted for
+
Halt/slow deforestation Eliminate causes Big avoided emissions ++++ +++
–Va
Halt logging
a
Forgone economic activity Loss of forest services
+ – –Va
Increase Forest Area
Afforestation and reforestation
a,b
Loss of land for other purposes One-time C gain
++ –Va,c
Establish and manage reserves Future opportunity costs?
One-time C gain + –Va,c
Multiple use (e.g., agroforestry,
shleterbelts)
Cross sectoral benefits + +
Restoration of degraded lands Feasibility?
Reason for degradation ameliorated? ++ –Va
Urban forestry
Energy costs/benefits + –Vc
Increase Carbon Density (C ha
–1
)
Longer rotation length
Reduced short-term yield of products? ++ –Va,c
Enhance tree productivity Implementation cost
+Va, –Vc
Control stand density (thinning) Implementation cost
Timber benefit but total biomass and
DOM C?
–? –Vc
Enhance nutrient availability Implementation cost
Feasibility
Energy costs ++ Va
Control water table Implementation cost, Increased
CO
2
, reduced CH
4
Soil respiration, tree growth + –Vc
© 2006 by Taylor & Francis Group, LLC
Forests in the Global Carbon Cycle: Implications of Climate Change 189
Selected species and genotypes
Response to climate? Cost; diversity
impacts
+ – –Vc
Protect from natural disturbance,
reduce risk
Implementation cost
Feasibility
Requires ongoing maintenance +++ – –Va,c
Reduced impact logging Implementation cost Cost, extent ? +Va
Reduce regeneration delay Implementation cost
Small one-time gain +
Manage onsite logging residues Implementation cost
Forgone use in products? + +Va,c
Note: Number of +’s (–’ s) indicates expected magnitude of C benefit (decrement),
Vc indicates expected vulnerable to climate change, and Va
indicates potentially vulnerable to changes in human activity.
a
Kauppi et al.,
43
b
Includes savannah thickening as a special case.
© 2006 by Taylor & Francis Group, LLC
Fig. 4.8.
190 Climate Change and Managed Ecosystems
1. They act as an offsite, manageable carbon reservoir.
2. They can be burned to provide a renewable source of energy (direct
substitution).
3. They substitute for competing materials having a larger atmospheric CO
2
footprint (indirect substitution).
Both direct and indirect substitution can add significantly to the mitigation potential
of forest products.
9.6.3 FOREST PRODUCTS AS A MANAGEABLE CARBON POOL
From a global perspective, the export of organic carbon from the forest ecosystem
where the CO
2
is initially withdrawn from the atmosphere by photosynthesis to a
different location where it subsequently decomposes and releases the CO
2
back to
the atmosphere, results in a spatial displacement of the source component (at the
site of the decomposing product) relative to a comparable sink component (in the
forest ecosystem). The net effect on atmospheric concentration is negligible unless
the rate of decomposition in the geographically displaced product pools is different
from that in the forest ecosystem from which it was removed. This separation of
apparent source (forest product) and sink (forest ecosystem) has interesting political
implications that have, to date, led to an impasse in attempts to incorporate forest
product carbon management in the Kyoto Protocol (who gets the credit — the
exporting country in whose forest the uptake of CO
2
took place, or the receiving
country where the forest product reservoir management occurs?).
Despite these political difficulties, the carbon contained in forest products makes
a small, and manageable, contribution to the global carbon balance. The geographical
displacement of forest ecosystem uptake (sink) from the forest product decomposi-
tion (source) may also be required for reconciliation of observed geographical
distributions of atmospheric CO
2
concentrations with atmospheric transport of CO
2
from known emission sources and sinks.
50,51
As a carbon reservoir, the size of exported product pools is the cumulative
difference between harvest inputs and depletions through decomposition and com-
bustion that release CO
2
back to the atmosphere. Estimating the size of this pool
and its change over time is complicated by at least three factors: the difficulty of
tracking the flows of forest products through the multitude of uses society has found
for wood products; accounting for the changes over time in the reuse and recycling
of woody materials (including pulp and paper); and the wide geographical dispersal
of the products through trade (increasingly international). These factors make it
difficult to compile inventories of products with widely different half-lives, to esti-
mate the rates of product recycling between different half-lives, and to determine
the rates of decomposition and combustion (releasing CO
2
back to the atmosphere)
at each stage in the product life cycle, each of which depends on the nature of the
product, its use, level of protection, and the local environment in which it is used
and discarded.
Despite these inherent uncertainties, estimates of the forest product pools have
been made at the global scale, where the pool is thought to be relatively small —
© 2006 by Taylor & Francis Group, LLC
Forests in the Global Carbon Cycle: Implications of Climate Change 191
between 5 and 10 Gt C.
43
Despite its small size, the IPCC concluded that the potential
for an increased contribution to mitigating human perturbations to the global carbon
cycle are not insignificant: wood products “already contribute somewhat to climate
mitigation, but if infrastructures and incentives can be developed, wood and agri-
cultural products may become vital elements of a sustainable economy: they are
among the few renewable resources available on a large scale.”
43
An increasing products pool releases proportionally more CO
2
. For a steady rate
of harvest inputs, the forest products pool in any given region eventually tends to
reach a plateau, at which point the accumulated forest products’ releases of CO
2
become equal to the harvest inputs derived from the forest uptake of CO
2
. This may
be the reason analyses of forest product contributions to the national carbon balance
for countries with a long history of forestry, such as in Fennoscandia
52
and the U.S.,
53
tend to be relatively small. Where the forest product pools are young (and not yet
saturated), or where the harvest rate is increasing, the increases in the forest product
pool may still be significant. In Canada, for example, both of these factors may be
responsible for the increases of 23.5 Tg C yr
–1
during the late 1980s — of the same
magnitude and nearly offsetting the net decreases (due to increased natural distur-
bances) in the carbon stocks of Canada forests for the same period.
54
Although the decision has not yet been made on whether, or how, forest product
carbon pools will be accounted for under the Kyoto Protocol, there is little doubt
that their wise management can offer some degree of mitigation of the increases in
atmospheric CO
2
. Some general observations may help to guide management deci-
sions.
• Once harvest inputs cease, product pools can only act as a source of
atmospheric CO
2
as they decompose or are incinerated as waste. On the
other hand, the CO
2
sink generated in the regrowing forest was “created”
by the very act of harvesting and over time exactly balances the source
term, provided there was no degradation or improvement of site produc-
tivity. The source (decomposing or burned product) and the sink (regrow-
ing forest) are inherently linked; they are autocorrelated with a time delay.
• Forest products and the regrowing forest also constitute a spatially dis-
placed source–sink pair with the emission and uptake occurring at differ-
ent geographical locations. This spatial displacement presents political
challenges as the source and sink may therefore be accredited or debited
to different parties. It also arises in atmospheric inversion studies, which
must deal with the spatially separated CO
2
emissions–receptor pair.
50,51
• Retention of carbon in forest products is functionally similar to retention
in ecosystem detrital pools: if the half-life of carbon in the products is
greater than the natural half-life in the ecosystem, there is a net gain in
retained carbon in the forest managed for timber supply relative to the
natural ecosystem having the same age distribution.
55
• The rate of loss from product pools is, in principle, under the control of
society through decisions made on the duration of use of the products and
their recycling fate. This includes also their final use as a source of energy
(see below).
© 2006 by Taylor & Francis Group, LLC
192 Climate Change and Managed Ecosystems
• As a rule of thumb, using long-lived forest carbon stocks to generate
short-lived forest products has a disproportionately positive impact on
CO
2
emissions, relative to preserving the forest ecosystem stocks,
56
but
this conclusion does not hold if the end use in the product chain is
bioenergy that substitutes for fossil fuel.
9.6.4 USE OF FOREST BIOMASS FOR BIOENERGY
In addition to their modest role as a manageable carbon reservoir, forest-derived
organic materials can also serve to reduce anthropogenic emissions in two important
ways: by supplying essential products and services that otherwise entail greater fossil
fuel CO
2
emissions, and by directly supplying energy services (bioenergy). Figure
9.3 shows this emission reduction role as a control on the fossil fuel emissions.
Forest biomass is one of the oldest harnessed sources of energy for human
activities, providing both domestic heating and cooking functions, and as an indus-
trial source of energy (see Reference 57 and references therein). Globally, bioenergy
at present supplies about 14% of the primary energy needs.
42
Where sustainably
produced bioenergy replaces, or avoids, the combustion of fossil fuel, it has a lasting
influence on the global carbon cycle, as explained below. The extent to which
sustainably produced forest products supply essential services that otherwise would
result in higher emissions from fossil fuel use, in their manufacture, or their oper-
ation, or their maintenance, makes a similar contribution. Moreover, the avoidance
of emission sources (Figure 9.2) can be additional to the role of forest products as
a managed carbon reservoir discussed above. Both the manufacturing residues gen-
erated during their production, and the forest products themselves after their serv-
iceable life, can be used to feed bioenergy supply systems.
57–59
The trend of increasing replacement of traditional wood-based construction
products by cement, metals such as steel and aluminum, and plastics has an adverse
impact on the global carbon cycle by increasing the combustion of fossil fuel for
their production. For example, the CO
2
emissions associated with electrical trans-
mission line towers is estimated at ~10 t C km
–1
when manufactured from tubular
steel and ~4.3 t C km
–1
from concrete, in contrast to the ~1 t C km
–1
estimated for
roundwood poles.
60
Similar ratios are found for other materials such as aluminum
and plastic, which require expenditures of energy in their production,
60
but which
are increasingly becoming substitutes for traditional wood products.
Halting the increase in use of metal and plastic products in replacement of wood
products or increasing the substitution of these energy-intensive products by wood
benefits the carbon budget in multiple ways. The first is the energy expenditure
avoided, which is the net difference in CO
2
emissions required to generate the product
from the raw materials. The second is the accrual of carbon in the forest products
pool. The third, with a longer-lasting impact, is the use of discarded forest products
for the production of bioenergy.
The importance of the contributions of forest products to emission reductions
lies in the relative permanence of the CO
2
influence on the global carbon cycle. The
combustion of fossil fuels and forest biomass for energy both release comparable
amounts of CO
2
to the atmosphere for the similar amounts of energy,
57
and both
© 2006 by Taylor & Francis Group, LLC
Forests in the Global Carbon Cycle: Implications of Climate Change 193
fuel sources ultimately derive from the same source: the conversion of solar energy
to chemical bonds in organic carbon compounds through the process of photosyn-
thesis. Fossil reserves, however, were accumulated over millennia, with natural
inputs to and emissions from these deeply buried reservoirs occurring only slowly
on geological timescales. Until recently, the fossil reserves have played a negligible
part in the active global carbon cycle. Human withdrawal of fossil fuel from these
relatively inert reservoirs has effectively added new carbon to the active global carbon
cycle at a rate that has increased dramatically over the last 100 years. In contrast,
the burning of (modern) biomass simply returns to the atmosphere the CO
2
that was
accumulated from the atmosphere in recent times, adding no new carbon to the
active global carbon cycle. Provided the forest ecosystems providing the feedstock
are managed sustainably,
*
there is no direct global change in the atmospheric CO
2
concentration from the combusting modern biomass for energy, although there may
be additional emissions associated with the infrastructure for bioenergy systems.
Bioenergy derived from forest ecosystems takes many forms, ranging from
dedicated bioenergy plantations to co-generation of heat and electricity as a by-
product of product manufacture, and the capture and combustion of methane from
landfills. The net impact on the global carbon cycle varies with the efficiency of
these production systems and the extent to which the expenditure of fossil fuel is
required in their production, distribution, and use.
57
In addition, the economic fea-
sibility depends strongly on the availability of land for bioenergy purposes, with
costs rising steeply if other production uses are displaced.
57,61
Including both forest and agricultural systems, global bioenergy production in
the year 2050 could be between 95 and 280 EJ (1 EJ is 10
18
joules = 2.28 10
15
KWhrs).
62
This would supply 5 to 25% of the projected energy needs under some
future development scenarios,
63
and potentially avoid fossil fuel emissions of 1.4 to
4.2 Gt C yr
–1
in 2050.
64
The maximum potential of bioenergy could be as much as
five times greater,
62
but this would require significant infrastructure development.
Similar projections of ~4 Gt C yr
–1
avoided fossil fuel emissions and carbon seques-
tration by about 2040 were estimated in computer simulations of an ambitious global
program of sustainable development of community-scale short-rotation bioenergy
plantations estimated by Read 1999, as reported by Sampson et al.
65
9.7 CONCLUSIONS: THE GLOBAL FOREST SECTOR
AND THE GLOBAL CARBON CYCLE
We asked initially if forests were part of the problem or part of the solution, and
have tried to show that they are part of both. Forests and their management are not
the largest source of the problem, nor can they be its sole solution. However, our
past and present use of the forest land base, especially through deforestation, has
had and continues to make a double contribution to the increase in atmospheric CO
2
through the reduction in the planet’s photosynthetic capacity, and through the elim-
ination or dramatic reduction of the carbon stocks associated with the former forests.
*
“Sustainable” in this context means that the net forest ecosystem uptake of CO
2
(NEP) is at least as
great as the net CO
2
emissions from the combustion of the exported biomass.
© 2006 by Taylor & Francis Group, LLC
194 Climate Change and Managed Ecosystems
This is an important part of the problem. Reduction of the rate of deforestation will
have an immediate and lasting impact on CO
2
emissions and on atmospheric CO
2
concentrations, in addition to other associated environmental benefits.
Forest responses to changes in the global environment, including Earth’s climate,
may also contribute to both the problem and its solution.
Although terrestrial ecosystems appear to currently accommodate nearly 60%
of the direct anthropogenic perturbation inputs of CO
2
to the atmosphere, the natural
physiological mechanisms that are thought to be responsible for this increased uptake
are not likely to function as effectively in the future. Thus, in the absence of
purposeful mitigation, the land-based CO
2
sink will likely decrease and could even
become a source over the coming century,
66
leading to even greater climate changes.
Sustainable development in forestry has an important role to play in reversing
these trends. This role is not restricted to the maintenance or enhancement of carbon
stocks in forest ecosystems, but also can help to alleviate the underlying causes of
deforestation by providing economic benefits. Although there are many activities
that can be undertaken in the management of forest ecosystems to this end, their
specific costs will vary. As climate change proceeds, more expensive activities will
become necessary for additional mitigation.
The sustainable use of forest products, including the production of energy sup-
plies that displace the use of fossil fuels, may make a significant contribution to
mitigate climate change in the longer term because such use avoids the entry of new
carbon into the active part of that cycle, while supplying essential goods and services
to society. These avoided emissions accrue both from the use of forest biomass to
supply energy (either directly or as a last stage in the life cycle of forest products)
and from the use of forest-derived products as substitutes for materials that require
large expenditure of energy (typically from the combustion of fossil fuels).
Management activities that enhance or protect carbon stocks in forest ecosystems
include reducing the regeneration delay through seeding and planting, enhancing
forest productivity, changing the harvest rotation length, the judicious use of forest
products, and forest protection through control and suppression of disturbance by
fire, pests, and disease. At the same time, the flow of material goods and services
from a thriving forest products sector not only reduces the dependence on more
energy-intensive products, such as cement, but also provides economic benefits that
can help pay for such forest-enhancing activities. The sustainable use of forests
thereby offers a potential win–win situation: maintenance of carbon stocks in healthy
forest ecosystems, the cost of which can be offset by the continuous stream of forest
products, which themselves help avoid the direct input of new carbon into the
atmosphere. Good forestry can be part of the solution.
Protection of forest carbon stocks from intensifying and recurring disturbance
events solely as a mitigation strategy is likely neither efficient nor effective as a
long-term measure. This is especially true of wildfires where increasingly large
financial expenditures will be needed to protect vulnerable forests. The situation is
analogous to paying high rent: C pools are only retained as long as the protection
continues, and are lost when the next fire comes along. On the other hand, if
protection is coupled with sustainable forest utilization, transferring C to long-lived
© 2006 by Taylor & Francis Group, LLC
Forests in the Global Carbon Cycle: Implications of Climate Change 195
forest products, then potentially significant gains in terrestrial C retention can be
realized, both on- and offsite.
Although it is straightforward to quantify the direct anthropogenic inputs of CO
2
to the atmosphere, a quantitative understanding of the rates of atmospheric increase
remains a challenge, precisely because of the strong feedbacks exerted by terrestrial
and ocean ecosystems to the changes. Understanding the biospheric feedback — the
response of the world’s biota to the perturbations — is needed:
• To gauge the magnitude of future impacts
• To identify realistic mitigation opportunities that can help reduce or avoid
further adverse perturbation of the C cycle–climate system
• To design, implement, and monitor appropriate mitigation activities
• To design and implement adaptation strategies that can help society to
cope with those changes that are unavoidable
The quantification of C-related costs and benefits from sustainable forest manage-
ment, and of the impacts of climate change on forest C sinks and sources also
remains a challenge, requiring:
• Improved methods and data for assessing vulnerable C pools and the
processes affecting them
• New and improved models for predicting the fate of these pools in a
changing environment
• New tools and data to monitor and verify the predictions over large scales
Over the past decade, there has been a dramatic improvement in the science of
interactions between climate and forests. Particular advances have been made in
understanding landscape-level carbon dynamics through the implementation of
large-scale manipulative experiments and advanced monitoring programs, and in the
development of practical forest-oriented remote-sensing technologies. Further
advances are critically important to understand the dynamics and impacts of human
activities on changing carbon uptake by terrestrial ecosystems. Part of this challenge
is the identification of mitigation opportunities that can help reduce or avoid further
adverse perturbation of the carbon cycle–climate system. A significant component
of this is the development of predictive tools that incorporate human decision making
and social behavior as an integral part of the analytical process. This task has recently
been initiated by the Global Carbon Project of the Earth Systems Partnership.
67
ACKNOWLEDGMENTS
This chapter is based in part on an earlier presentation by M.J.A. at the XII World
Forestry Congress. The authors thankfully acknowledge the thoughtful comments
by two anonymous reviewers.
© 2006 by Taylor & Francis Group, LLC
196 Climate Change and Managed Ecosystems
REFERENCES
1. Zwiers, F.W. 2002. The 20-year forecast. Nature 416:690–691.
2. IPCC. 1990. Climate Change 1990: IPCC Scientific Assessment. Cambridge Univer-
sity Press, New York.
3. IPCC. 2001. Climate Change 2001: The Scientific Basis. Contribution of Working
Group I to the Third Assessment Report of the Intergovernmental Panel on Climate
Change. Cambridge University Press, Cambridge.
4. Reilly, J., P.H. Stone, C.E. Forest, M.D. Webster, G.C. Jacoby, and R.G. Prinn. 2001.
Uncertainty and climate change assessments. Science 293:430–433.
5. WMO. 2002. WMO Statement on the status of the global climate in 2001. WMO-
No. 940, World Meteorological Organisation, Geneva.
6. Apps, M.J. and W.A. Kurz. 1991. The carbon budget of Canadian forests in a changing
climate: can forestry be part of the solution? In Proceedings 3rd International Sym-
posium on Cold Region Development, “ISCORD ’91,” Edmonton, June 16–20, 1991.
Alberta Research Council, 48 pp.
7. Falkowski, P., R.J. Scholes, E. Boyle, J. Canadell, D. Canfield, J. Elser, N. Gruber,
K. Hibbard, P. Hogbeg, S. Linder, A.F. MacKenzie, B. Moore III, T.F. Pedersen, Y.
Rosenthal, S. Seitzinger, V. Smetacek, and W. Steffen. 2000. The global carbon cycle:
a test of our knowledge of Earth as a system. Science 290:291–296.
8. Marland, G., R. Pielke, Sr., M. Apps, R. Avissar, R.A. Betts, K.J. Davis, P.C. Frum-
hoff, S.T. Jackson, L.A. Joyce, P. Kauppi, J. Katzenberger, K.G. MacDicken, R.P.
Neilson, J.O. Niles, D.S. Niyogi, R.J. Norby, N. Pena, N. Sampson, and Y. Xue. 2003.
The climatic impacts of land surface change and carbon management, and the impli-
cations for climate-change mitigation policy. Climate Policy 3:149–157.
9. Melillo, J.R., C.B. Field, and B. Moldan. 2003. Element interactions and the cycles
of life: An overview. In Interactions of the Major Biogeochemical Cycles: Global
Change and Human Impact
s, J.M. Metillo, C.B. Field, and B. Moldan, Eds. Island
Press, Washington, D.C., 1–14.
10. Houghton, R.A. 2003. Revised estimates of the annual net flux of carbon to the
atmosphere from changes in land use and land management 1850–2000. Tellus
55B(2):378–390.
11. Schulze, E., D.C. Wirth, and M. Heimann. 2000. Managing forests after Kyoto.
Science 289:2058–2059.
12. Barford, C.C., S.C. Wofsy, et al. 2001. Factors controlling long- and short-term
sequestration of atmospheric CO
2
in a mid-latitude forest. Science 294:1688–1691.
13. Gholz, H.L. and R.F. Fisher. 1982. Organic matter production and distribution in
slash pine (Pinus elliottii) plantations. Ecology 63:1827–1839.
14. Gower, S.T., O.N. Krankina, R.J. Olson, M.J. Apps, S. Linder, and C. Wang. 2000.
Net primary production and carbon allocation patterns of boreal forest ecosystems.
Ecol. Appl. 11:1395–1411.
15. Kurz, W.A. and M.J. Apps. 1999. A 70-year retrospective analysis of carbon fluxes
in the Canadian forest sector. Ecol. Appl. 9:526–547.
16. MacLaren, J.P. 1996. Plantation forestry — its role as a carbon sink: conclusions
from calculations based on New Zealand’s planted forest estate. Pages 257–270 In
Fore st Ecosystems, Forest Management and the Global Carbon Cycle, M.J. Apps and
D.T. Price, Eds. Springer-Verlag, Berlin, 257–270.
17. Van Wagner, C.E. 1978. Age-class distribution and the forest fire cycle. Can. J. For.
Res. 8:220–227.
© 2006 by Taylor & Francis Group, LLC
Forests in the Global Carbon Cycle: Implications of Climate Change 197
18. Harrington, J. 1982. A Statistical Study of Area Burned by Wildfire in Canada
1953–1980. Information Report PI-X-16, Petawawa National Forestry Institute, Cana-
dian Forestry Service, Department of Environment.
19. Canadell, J.G., H.A. Mooney, D.D. Baldocchi, J.A. Berry, J.R. Ehleringer, C.B. Field,
S.T. Gower, D.Y. Hollinger, J.E. Hunt, R.B. Jackson, S.W. Running, G.R. Shaver, W.
Steffen, S.E. Trumbore, R. Valentini, and B.Y. Bond. 2000. Carbon metabolism of
the terrestrial biosphere: a multi-technique approach for improved understanding.
Ecosystems 3:115–130.
20. Steffen, W. and P. Tyson. 2001. Global Change and the Earth System: A Planet under
Pressure. The Global Environmental Programmes. IGBP Science No. 4, IGBP (Inter-
national Geosphere-Biosphere Programme), Stockholm.
21. Pacala, S.W., G.C. Hurtt, D. Baker, P. Peylin, R.A. Houghton, R.A. Birdsey, L. Heath,
E.T. Sundquist, R.F. Stallard, P. Ciais, P. Moorcroft, J.P. Caspersen, E. Shevliakova,
B. Moore, G. Kohlmaier, E. Holland, M. Gloor, M.E. Harmon, S M. Fan, J.L.
Sarmiento, C.L. Goodale, D. Schimel, and C.B. Field. 2001. Consistent land- and
atmosphere-based U.S. carbon sink estimates. Science 292:2316–2320.
22. Caspersen, J.P., S.W. Pacala, J.C. Jenkins, G.C. Hurtt, P.C. Moorcroft, and R.A.
Birdsey. 2000. Contributions of land-use history to carbon accumulation in U.S.
forests. Science 290:1148–1151.
23. Keeling, C.D., J.F.S. Chin, and T.P. Whorf. Increased activity on northern vegetation
inferred from atmospheric CO
2
measurements. Nature 382:146–149.
24. Lavigne, M.B., R. Boutin, R.J. Foster, G. Goodine, P.Y. Bernier, and G. Robitaille.
2003. Soil respiration responses to temperature are controlled more by roots than by
decomposition in balsam fir ecosystems. Can. J. For. Res. 33:1744–1753.
25. Lavoie, C. and S. Payette. 1996. The long-term stability of the boreal forest limit in
subarctic Quebec. Ecology 77:1226–1233.
26. Zoltai, S.C., T. Singh, and M.J. Apps. 1991. Aspen in a changing climate. In Aspen
Management for the 21st Century, S. Navratil and P.B. Chapman, Eds. Forestry
Canada, Northwest Region, Northern Forestry Centre and Poplar Council of Canada,
Edmonton, Alberta, 143–152.
27. Hogg, E.H. and P.A Hurdle. 1995. The aspen parkland in western Canada: A dry-cli-
mate analogue for the future boreal forest? Water Air Soil Pollut. 82:391–400.
28. Hogg, E.H. 2001. Modelling aspen responses to climatic warming and insect defo-
liation in western Canada. In Sustaining Aspen in Western Landscapes: Symposium
Proceedings, Shepperd, W.D., Binkley, D., Bartos, D.L., Stohlgren, T.J., and Eskew,
L.G., Comps. 13–15 June 2000, Grand Junction, Colorado. U.S. Department of
Agriculture, Forest Service, Rocky Mountain Research Station, Fort Collins, Colo-
rado, Proceedings RMRS-P-18, 325–338.
29. Kurz, W.A., M.J. Apps, B.J. Stocks, and W.J.A. Volney. 1995. Global climatic change:
disturbance regimes and biospheric feedbacks of temperate and boreal forests. In
Biotic Feedbacks in the Global Climatic System: Will the Warming Feed the Warming?
G.M. Woodwell and F.T. Mackenzie, Eds. Oxford University Press, 119–133.
30. Holling, C. S. 2001. Understanding the complexity of economic, ecological, and
social systems. Ecosystems 4:390–405.
31. Luo, Y., L.W. White, J.G. Canadell, E.H. DeLucia, D.S. Ellsworth, A. Finzi, J. Lichter,
and W.E. Schlesinger. 2003. Sustainability of terrestrial carbon sequestration: a case
study in Duke Forest with inversion approach. Global Biogeochem. Cycles
17:1021–1034.
© 2006 by Taylor & Francis Group, LLC
198 Climate Change and Managed Ecosystems
32. DeLucia, E.H., K. George, and J.G. Hamilton. 2002. Radiation-use efficiency of a
forest exposed to elevated concentrations of atmospheric carbon dioxide. Tree Physiol.
22:1003–1010.
33. Oren, R., D.S. Ellsworth, K.H. Johnsen, N. Phillips, B.E. Ewers, C. Maier, K.V.R.
Schafer, H. McCarthy, G. Hendrey, S.G. McNulty, and G.G. Katul. 2001. Soil fertility
limits carbon sequestration by forest ecosystem in a CO
2
-enriched atmosphere. Nature
411:469–472.
34. Schindler, D.W. 1998. A dim future for boreal waters and landscapes. BioScience
48:157–164.
35. Isebrands, J.G., Dickson, R.E., Rebbeck, J., and Karnosky, D.F. 2000. Interacting
effects of multiple stresses on growth and physiological processes in northern forests.
In Responses of Northern U.S. Forests to Environmental Change, R.E. Mickler, R.A.
Birdsey, and J. Hom, Eds. Ecological Studies 139, Springer-Verlag, Berlin, 149–180.
36. Flannigan, M.D., I. Campbell, M. Wotton, C. Carcaillet, P. Richard, and Y. Bergeron.
2001. Future fire in Canada’s boreal forest: paleoecology results and general circu-
lation model — regional climate model simulations. Can. J. For. Res. 31:854–864.
37. Fleming, R.A. and W.J.A. Volney. 1995. Effects of climate change on insect defoliator
population processes in Canada’s boreal forest. Water Air Soil Pollut. 82:445–454.
38. Dale, V.H., L.A. Joyce, S. McNulty, R.P. Neilson, M. Ayres, M.D. Flannigan, P.J.
Hanson, L. Irland, A.E. Lugo, C. Peterson, D. Simberloff, F. Swanson, B.J. Stocks,
and B.M. Wotton. 2001. Climate Change and forest disturbances. BioScience
51:723–734.
39. McNulty, S. 2002. Hurricane impacts on US forest carbon sequestration. Environ.
Pollut. 116:S17–S24.
40. Percy, K.E., C.S. Awmack, R.L. Lindroth, M.E. Kubiske, B.J. Kopper, J.G. Isebrands,
K.S. Pregitzer, G.R. Hendry, R.E. Dickson, D.R. Zak, E. Okansen, J. Sober, R.
Harrington, and D.F. Karnosky. 2002. Altered performance of forest pests under
atmospheres enriched by CO
2
and O
3
. Nature 420:403–407.
41. UNFCCC. 1997. Kyoto Protocol to the United Nations Framework Convention on
Climate Change. In FCCC/CP/1997/7/Add.1..
42. Watson, R., I. Noble, B. Bolin, M.J. Apps et al. 2000. Summary for Policy Makers,
IPCC Special Report on Land Use, Land-Use Change and Forestry. Cambridge
University Press, New York.
43. Kauppi, P.E., R.A. Sedjo, M.J. Apps, C.C. Cerri, T. Fujimori, H. Janzen, O.N.
Krankina, W. Makundi, G. Marland, O. Masera, G.J. Nabuurs, W. Razali, and N.H.
Ravindranath. 2001. Technical and economic potential of options to enhance, main-
tain and manage biological carbon reservoirs and geo-engineering. In Climate Change
2001: Mitigation. Contribution of Working Group III to the Third Assessment Report
of the Intergovernmental Panel on Climate Change, B. Metz, O. Davidson, R. Swart,
and J. Pan, Eds. Cambridge University Press, Cambridge, 310–343.
44. Penman, J., M. Gytarsky, T. Hiraishi, T. Krug, D. Kruger, R. Pipatti, L. Buendia, K.
Miwa, T. Ngara, K. Tanabe, and F. Wagner, Eds. 2003. Good Practice Guidance for
Land Use, Land-Use Change and Forestry. IPCC National Greenhouse Gas Invento-
ries Program, Institute for Global Environmental Strategies, Kanagawa, Japan.
45. Binkley, C.S., M.J. Apps, R.K. Dixon, P. Kauppi, and L O. Nilsson. 1998. Seques-
tering carbon in natural forests. Crit. Rev. Environ. Sci. Technol. 27:S23–45.
46. Kurz, W.A., S.J. Beukema, and M.J. Apps. 1998. Carbon budget implications of the
transition from natural to managed disturbance regimes in forest landscapes. Mitiga-
tion Adaptation Strat. Global Change 2:405–421.
© 2006 by Taylor & Francis Group, LLC
Forests in the Global Carbon Cycle: Implications of Climate Change 199
47. Nohrstedt, H.O. 2001. Response of coniferous forest ecosystems on mineral soils to
nutrient additions: a review of Swedish experiences. Scand. J. For. Res. 16:555–573.
48. Saarsalmi, A. and E. Malkonen. E.2001. Forest fertilization research in Finland: a
literature review. Scand. J. For. Res. 16:514–535.
49. Schroeder, W. and J. Kort. 2001. Temperate agroforestry: adaptive and mitigative
roles in a changing physical and socio-economic climate. In Proceedings of the
Seventh Biennial Conference on Agroforestry in North America, Saskatchewan, Can-
ada, August 12–15, 2001, 350 pp.
50. Fan, S., M. Gloor, J. Mahlman, S. Pacala, J.L. Sarmiento, T. Takahashi, and P. Tans.
1999. The North American Sink. Science 483:1815a.
51. Bousquet, P., P. Peylin, P. Ciais, C.L. Querre, P. Friedlingstein, and P. Tans. 2000.
Regional changes in carbon dioxide fluxes of land and oceans since 1980. Science
290:1342–1346.
52. Karjalainen, T., S. Kellomaki, and A. Pussinen. 1994. Role of wood-based products
in absorbing atmospheric carbon. Silva Fenn. 28:67–80.
53. Harmon, M.E., J.M. Harmon, W.K. Ferrell, and D. Brooks. 1996. Modeling carbon
stores in Oregon and Washington forest products: 1900–1992. Climatic Change
33:521–550.
54. Apps, M.J., W.A. Kurz, S.J. Beukema, and J.S. Bhatti. 1999. Carbon budget of the
Canadian forest product sector. Environ. Sci. Policy 2:25–41.
55. Hendrickson, O.Q. 1990. How does forestry influence atmospheric carbon? Fo r.
Chron. 66:469–472.
56. Dewar, R.C. 1990. Analytical model of carbon storage in the trees, soils and wood
products of managed forests. Tree Physiology 6:417–428.
57. Schlamadinger, B., M. Apps, F. Bohlin, L. Gustavsson, G. Jungmeier, G. Marland,
K. Pingoud, and I. Savolainen. 1997. Towards a standard methodology for greenhouse
gas balances of bioenergy systems in comparison with fossil energy systems. Biomass
Bioenerg. 13:359–375.
58. Pingoud, K., A. Lehitila, and I. Savlolainen. 1999. Bioenergy and the forest industry
in Finland after the adoption of the Kyoto Protocol. Environ. Sci. Policy 2:153–163.
59. Gustavsson, L., T. Karajalainen, G. Marland, I. Savolainen, B. Schlamadinger, and
M.J. Apps. 2000. Project-based greenhouse gas accounting: Guiding principles with
focus on baselines. Energ. Policy 28:935–946.
60. Richter, K. 1998. Life cycle assessment of wood products. In Carbon Dioxide Miti-
gation in Forestry and Wood Industry, G. Kohlmaier, K. Weber, and R. Houghton,
Eds. Springer Verlag, Berlin, 219–248.
61. Schlamadinger, B. and G. Marland. 1996. Full fuel cycle carbon balances of bioenergy
and forestry options. Energ. Conserv. Manage. 37(6–8):813–818.
62. Hall, D.O. and J.I. Scrase. 1998. “Will biomass be the environmentally
friendly fuel
of the future?” Biomass Bioenerg. 15(4/5):357–367.
63. Nakicenovic, N., J. Alcamo, G. Davis, B. de Vries, J. Fenhann, S. Gaffin, K. Gregory,
A. Grübler, T.Y. Jung, T. Kram, E.L. La Rovere, L. Michaelis, S. Mori, T. Morita,
W. Pepper, H. Pitcher, L. Price, K. Riahi, A. Roehrl, H H. Rogner, A. Sankovski,
M. Schlesinger, P. Shukla, S. Smith, R. Swart, S. van Rooijen, N. Victor, and Z. Dadi.
2000. Special Report on Emissions Scenarios. Intergovernmental Panel on Climate
Change, Cambridge.
64. Matthews, R. and K. Robertson. 2001. Answers to ten frequently asked questions
about bioenergy, carbon sinks and their role in global climate change. Graz, Austria,
IEA Bioenergy Task 38, 8 pp.
© 2006 by Taylor & Francis Group, LLC