Cyanobacterial Toxins of Drinking Water Supplies: Cylindrospermopsins and Microcystins - Chapter 8 doc
Bạn đang xem bản rút gọn của tài liệu. Xem và tải ngay bản đầy đủ của tài liệu tại đây (593.81 KB, 25 trang )
141
8
Risk and Safety of
Drinking Water: Are
Cyanobacterial Toxins
in Drinking Water a
Health Risk?
We are all naturally concerned about our own health and the health of others around
us. The main focus of our concerns will, however, be different depending on whether
we live in a developed nation or in a less developed part of the world. In the relatively
recent past, communicable gastrointestinal diseases were major causes of infant
mortality worldwide and were often transmitted through drinking water. This disease
source has been combated with success by the construction of sewage systems and
the provision of clean, disinfected drinking water supplies. Epidemics of the more
lethal gastrointestinal diseases such as cholera still occur in rural populations with
no clean drinking water and in towns where drinking water disinfection has failed.
An example of failure of effective disinfection of a town drinking water supply
leading to severe illness and deaths in the population is the recent dramatic instance
at Walkerton, Ontario, Canada. Enteric disease organisms coming from a farm were
washed into a shallow well by heavy rain and distributed in the town drinking water.
Illness occurred in 2300 people out of a population of 4800, and 7 deaths resulted.
Other severely affected patients had lasting organ damage (O’Connor 2002; Hrudey,
Payment et al. 2003).
A primary responsibility of the drinking water supply industry is therefore to
prevent the transmission of disease through the drinking water, and the regulations
governing drinking water have a necessary focus on disease organisms. Of lesser
importance are turbidity, taste, odor, and chemical contaminants. As the availability
of disinfected, microbiologically safe drinking water has increased, attention has
focused on these other issues. Consumers are inevitably concerned about turbidity,
taste, and odor, which are immediately discernible and underlie most of the com-
plaints that drinking water utilities receive. Changes in the apparent quality of
drinking water are interpreted by consumers to reflect lack of adequate treatment
and to be associated with a health risk.
More subtle, yet likely to present a more real risk to health, are chemical
contaminants in drinking water. These may be natural constituents of the water,
TF1713_C008.fm Page 141 Tuesday, October 26, 2004 1:43 PM
Copyright 2005 by CRC Press
142
Cyanobacterial Toxins of Drinking Water Supplies
chemicals resulting from water treatment, or contaminants such as agricultural
pesticides or sex hormones. An example of a natural constituent of water is arsenic,
which may be present in considerable concentration in groundwater. In the U.S.,
extensive discussion in the recent past has been stimulated by revision of the safe
level for arsenic in drinking water (the Maximum Contaminant Level), arising in
part from increased evidence of human poisoning and cancer in areas where natural
arsenic in groundwater is high (Yang, Chang et al. 2003).
The majority of water treatment worldwide uses chlorine, chloramine, or chlo-
rine dioxide as a disinfectant. New treatment plants increasingly use ozone. The use
of all of these oxidants results in reaction with naturally occurring organic matter
in the water, leading to a range of compounds collectively referred to as disinfection
by-products. The presence of these disinfection by-products in drinking water, some
of which are carcinogens in experimental animals, has also led to controversy and
a move away from chlorine as a disinfectant. A large amount of epidemiological
research is currently directed toward establishing the possible relationship between
human health and the chlorinated and brominated compounds in drinking water
(Hwang, Magnus et al. 2002; Windham, Waller et al. 2003).
Pesticide contamination has long been known to be a risk in drinking water due
to the widespread use of these chemicals in agriculture. In response to the potential
risks involved in the consumption of pesticides, the World Health Organization
(WHO) and national regulatory bodies have specified Guideline Values, Maximum
Contaminant Levels, or Reference Doses for safe drinking water based on lifetime
exposure to the chemical (WHO 1996; USEPA 2004) (Table 8.1). These drinking
water concentrations are calculated in two quite different ways, depending on
whether the chemical contaminant is carcinogenic or noncarcinogenic. Later in this
chapter the implications of this difference are explored in the context of the cyano-
bacterial toxins, cylindrospermopsins, microcystins, and nodularins.
Examples of chemicals for which Guideline Values are determined on the basis
of carcinogenicity are benzene (formerly a component of gasoline) and bromate (a
disinfection by-product), which have been shown to be carcinogenic in animal testing
and are likely to be carcinogenic in humans. Examples of chemicals determined on
the basis of toxicity are atrazine (herbicide) and copper, for which there is no good
evidence of a carcinogenic risk to humans but that are demonstrably toxic (WHO
1996).
8.1 RISK ASSESSMENT AND LEGISLATION
Because of the perceived risks to the population of chemical contaminants in food,
water, and air, the majority of countries have legislated the maximum concentration
of a potentially hazardous contaminant that can be present in these three sources of
human exposure. Legislation for safe food generally preceded that for safe water,
and both are in a process of continuous evolution and refinement. The major changes
in approach to chemical contamination of drinking water occurred in the 1970s and
1980s as a consequence of the activities of the WHO and the U.S. Environmental
Protection Agency (USEPA) in trying to quantitate the adverse effects of individual
TF1713_C008.fm Page 142 Tuesday, October 26, 2004 1:43 PM
Copyright 2005 by CRC Press
Risk and Safety of Drinking Water
143
chemicals. The outcome of these efforts was a series of Guideline Values for con-
taminants in drinking water that could be implemented by legislation.
In the U.S., the Safe Drinking Water Act of 1974 established the responsibility
of the USEPA for determining the safe levels of water contaminants. To quote the
House Report to Congress:
“The purpose of this legislation is to assure that water supply systems serving
the public meet minimum national standards for protection of public
health.”
The USEPA was to identify contaminants “which have an adverse effect on
the health of persons” and to protect the public “to the maximum extent
feasible.”
This broad brief can be interpreted with varying amounts of rigor, and Congress
appreciated the problems of proof for adverse effects on public health. Even at
present, more than a quarter of a century later, there is little consensus on the
evidence, for example, of the effects of steroid hormone contamination of drinking
water on human reproduction. To ensure that the U.S. legislation was as compre-
hensive in its application as possible, the following clarification was recorded: “The
Committee did not intend to require conclusive proof that any contaminant
will
cause
adverse effects as a condition for regulation of a specific contaminant, rather, all
that is required is that the administrator make a reasoned and plausible judgment
that a contaminant
may
have such an effect.”
TABLE 8.1
Drinking Water Guideline Values for Toxic
Contaminants, for Lifetime Safe Consumption,
as Listed by the WHO, 1996
Contaminant Guideline Value, µµ
µµ
g/L
Nitrite 3000
Copper 2000
Lead 10
Arsenic 10
Mercury 1
Trichloroethane 2000
Xylene 500
Dichloromethane 20
Carbon tetrachloride 2
DDT 2
Atrazine 2
Chlordane 0.2
Aldrin 0.03
From WHO 1996.
TF1713_C008.fm Page 143 Tuesday, October 26, 2004 1:43 PM
Copyright 2005 by CRC Press
144
Cyanobacterial Toxins of Drinking Water Supplies
To support this approach, the House Report stated that the USEPA administrator
was to carry out the following procedures:
“The known adverse health effects of contaminants are to be compiled.”
“The Administrator must decide whether any adverse effects can reasonably
be anticipated, even though not proved to exist. It is at this point that the
Administrator must consider the possible impact of synergistic effects, long-
term and multi-media exposures, and the existence of more susceptible
groups in the population.”
“The recommended maximum contaminant level must be set to prevent the
occurrence of any known or anticipated health event.”
However, the technical capability to measure the contaminant and the cost of
removal of the contaminant in water treatment were realized to be major constraints
on the practicality of any particular Maximum Contaminant Level. This issue was left
to the USEPA to resolve: “Economic and technological feasibility [is] to be considered
by the USEPA and then only for the purpose of determining how soon it is possible
to reach recommended maximum contaminant levels and how much protection of the
public health is feasible until then” (all quotations from Robertson 1988).
The regulatory and enforcement responsibility under the Safe Drinking Water
Act was left to the USEPA until the individual states had legislation, monitoring,
and enforcement processes in place. This proceeded reasonably quickly, with the
states progressively assuming control of implementation of the act.
During the early 1980s, the WHO set up expert groups to assess microbiological,
radiological, and chemical contaminant risks in drinking water. The existing Inter-
national Program on Chemical Safety (IPCS) and the International Agency for
Research on Cancer (IARC) played major roles. The outcome was the publication
by the WHO of
Guidelines for Drinking Water Quality
in three volumes in 1984
and 1985 (WHO 1984). These volumes provided a large amount of background on
contaminants, for which actual numerical Guideline Values could not be set, as well
as recommended values for major harmful contaminants (Table 8.1).
In many countries, national health agencies set up safe drinking water guidelines
for contaminants in a manner parallel to the USEPA. The WHO’s
Guidelines for
Drinking Water Quality
were generally followed as a basis for national decisions,
though each country used local criteria to determine the relevance of particular
contaminants and the actual numerical value for the chemical. For implementation
of these contaminant levels in drinking water supplies, the relevant national, state,
or provincial legislature then passed acts that brought into force regulations for the
Maximum Contaminant Level or equivalent concentration of chemical.
By 1986, the U.S. Senate and Congress were not satisfied with the progress that
the USEPA had made in setting Maximum Contaminant Levels for drinking water,
in particular the few chemicals that had been finally set as regulated contaminants.
The amendments of 1986 required a substantial advance in progress, with 83 specified
contaminants to be regulated within 3 years. In this legislation, the definition of a
contaminant was broadened to state the following: “The term
contaminant
means
any physical, chemical, biological or radiological substance or matter in water.” Thus
TF1713_C008.fm Page 144 Tuesday, October 26, 2004 1:43 PM
Copyright 2005 by CRC Press
Risk and Safety of Drinking Water
145
“natural” biological toxins in drinking water were included. This definition is highly
relevant for the inclusion of cyanobacterial toxins among regulated contaminants
once the assessment of adverse health effects has been undertaken.
8.2 WHAT IS A RISK, AND HOW CAN IT BE ASSESSED?
To reach a definition of risk and an assessment of risk that can be applied widely,
the terms and procedures must, to a considerable extent, be formalized. Even the
definition of a risk has been codified, so that there is a common understanding of
what is meant. The IPCS together with the Organization for Economic Cooperation
and Development (OECD) have defined risk as “the probability of adverse effects
caused under specified circumstances by an agent in an organism, a population or
an ecological system.”
This immediately identifies risk as a quantitative term, which can be calculated
by statistical analysis of observational, experimental, or epidemiological data and
expressed as a probability. The other related term,
hazard
, is a qualitative expression
of potential for harm.
Hazard
is defined as “an inherent property of an agent or
situation capable of having adverse effects on something” (in the case in point, the
drinking water consumer).
Having stated these basic definitions of key terms, there are a further set of terms
that describe processes used in risk assessment. The joint publication of the
WHO/Food and Agriculture Organization (1995) on risk analysis for food contam-
inants provided these definitions:
Risk assessment: The scientific evaluation of known or potentially adverse
health effects resulting from (in this context waterborne) hazards. The
process consists of the following steps: (1) hazard identification, (2) hazard
characterization, (3) exposure assessment, and (4) risk characterization. The
definition includes quantitative risk assessment, which emphasizes reliance
on numerical expressions of risk, as well as an indication of attendant
uncertainties.
Hazard identification: The identification of known or potential health effects
associated with a particular agent.
Hazard characterization (hazard assessment/dose–response assessment): The
quantitative and/or qualitative evaluation of the nature of adverse effects
associated with biological, chemical, and physical agents (which may be
present in water). For chemical agents, a dose–response assessment should
be performed if the data are available.
Exposure assessment: The quantitative and/or qualitative evaluation of the
degree of intake likely to occur.
Risk characterization: Integration of hazard identification, hazard character-
ization, and exposure assessment into an estimation of the adverse effects
likely to occur in a given population, including attendant uncertainties.
Risk management: The process of weighing policy alternatives to accept,
minimize, or reduce assessed risks and to select and implement appropriate
options.
TF1713_C008.fm Page 145 Tuesday, October 26, 2004 1:43 PM
Copyright 2005 by CRC Press
146
Cyanobacterial Toxins of Drinking Water Supplies
8.3 RISK MANAGEMENT
The last of these definitions is different in character from the others, as it encom-
passes political, social, and economic factors as well as the available science-based
data in resolving the appropriate actions to be taken. The area of risk management
is in a phase of rapid change, as a rebound from the complex and costly regulatory
approach to contaminants in drinking water. A practical consequence of defining
Maximum Contaminant Levels or regulated Guideline Values for an increasing list
of chemicals is the cost and futility of repeatedly analyzing for large numbers of
chemicals that are below the limits of detection and highly unlikely to occur in that
water supply.
The food industry has developed a different approach, called Hazard Analysis
and Critical Control Point (HACCP). This is based on an initial analysis that first
identifies hazards and their severity and likelihood of occurrence, and, second,
identifies critical control points and their monitoring criteria to establish controls
that will reduce, prevent, or eliminate the identified hazards. This has been modified
from the food industry for use in the drinking water industry and is currently under
development in Australia and Europe as a safe and practical approach to the pre-
vention of adverse health effects from contaminants (National Health and Medical
Research Council of Australia 2004, under approval).
Hazard identification and risk
assessment are integral parts of this process, with measures of likelihood of occur-
rence of the hazard as well as of severity of consequences from the hazard. The
approach encourages the development of preventive strategies, in particular the
multibarrier design of catchment management and water treatment, discussed in
Chapter 11.
8.4 RISK AND CHEMICAL SAFETY IN DRINKING
WATER — CYANOBACTERIAL TOXINS AS TOXIC
CHEMICALS
This approach to determining the safe concentration of the cyanobacterial toxins
cylindrospermopsin and microcystin in drinking water makes the basic assumption
that these are noncarcinogenic. In this case the normal detoxification processes in
the liver (in particular) are assumed to remove the compounds from the body via
oxidation and conjugation up to a threshold dose, which overcomes the metabolic
capacity to render the toxins inactive. The biochemical pathways for detoxification
and excretion of these cyanobacterial toxins have been described earlier and reflect
similar mechanisms for other ingested xenobiotics. Thus the dose–response curve
of injury from microcystin and cylindrospermopsin has a threshold below which no
adverse effects can be observed. It was therefore possible to experimentally deter-
mine the minimum dose that would cause an adverse effect and the maximum dose
that could be administered without ill effect, which are the experimental doses lying
on either side of the actual threshold dose.
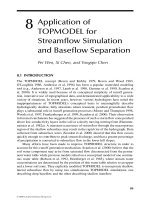
Above this dose or concentration a log dose/linear injury response was seen, up
to the point at which the cells or animals died (Figure 8.1).
The concentration of
toxin resulting in 50% cell death is stated as the effective concentration 50% (EC
50
).
TF1713_C008.fm Page 146 Tuesday, October 26, 2004 1:43 PM
Copyright 2005 by CRC Press
Risk and Safety of Drinking Water
147
For acute measurement of toxicity in whole animals, the lethal dose killing 50% of
the animals (LD
50
) over a fixed period of time can be calculated following admin-
istration of a single dose. In order to be able to compare different toxic chemicals,
the standard procedure for experimental determination of LD
50
is to inject young
mice or rats with measured doses of the toxin into the peritoneal cavity. The doses
cover the range between no observed effect and complete mortality over 24 h. The
LD
50
is expressed as milligrams per kilogram of body weight. This approach provides
a basis for assessing comparative toxicities, which can be applied to any toxic
chemical. Of more value to understanding of toxicity in drinking water is the oral
LD
50
, which is determined by dosing by mouth. Table 8.2 provides examples of oral
toxicities. The much higher doses needed for toxicity by mouth are due to the barrier
provided by the gastrointestinal tract and the destruction of chemicals in the intestine
by enteric enzymes and bacteria.
The threshold concept applies with even more effect when chronic exposure to
a toxic chemical occurs. In this case the bodily defense mechanisms may be activated
to induce increased levels of detoxifying enzymes in the hepatocytes. These cells
are then able to remove xenobiotics at a greater rate than unprepared cells. To
establish experimentally the dose just below and that just above the threshold when
given for an extended period, experimental animals are orally dosed for at least 10
weeks. The most commonly used period of dosing is 13 weeks for a subchronic
exposure experiment and for the whole lifetime of the animal for chronic exposure.
In order to minimize the number of animals exposed, a range-finding experiment
is often conducted with a minimum number of animals dosed orally for 14 days
over a wide range of concentrations. After experimentally determining a dose range
FIGURE 8.1
Death of cultured hepatocytes as a result of incubation with increasing concen-
trations of the cyanobacterial toxin cylindrospermopsin. Death was measured by leakage of
lactate dehydrogenase from the cells.
% of cell mortality
(from LDH leakage)
CYN conc.
(µM, log scale)
0
25
50
75
100
0
0.05
0.5
5
TF1713_C008.fm Page 147 Tuesday, October 26, 2004 1:43 PM
Copyright 2005 by CRC Press
148
Cyanobacterial Toxins of Drinking Water Supplies
that causes limited toxicological symptoms at the upper dose and none at the lowest
dose, a dose regime is set that brackets the threshold dose. This is followed by a
13-week oral dosing of groups of at least 15 animals of each gender at each dose,
with controls and a minimum of three toxin dose rates. At the end of the dosing
period, the animals are clinically examined, euthanized, and examined postmortem
for biochemical and histopathological injury (Fawell, James et al. 1994).
From these data are found the highest dose, expressed in micrograms or milli-
grams per kilogram of body weight, causing no injury to the animals [termed the
No Observed Adverse Effect Level (NOAEL)] and the lowest dose causing injury
to the animals [termed the Lowest Observed Adverse Effect Level (LOAEL)]. These
doses are often a factor of 5 or 10 apart, limiting the accuracy of the final values.
A Tolerable Daily Intake (TDI) or Reference Dose (RfD) can then be calculated, by
the incorporation of a series of safety or uncertainty factors (WHO 1996).
These factors are aimed at providing a safe and conservative adjustment to the
data derived from rodent experiments when applied to human health. The most
valuable data for safety calculations for the population is that from accidental human
exposure to the toxin, with clinical injury to individuals and accurate exposure data.
Fortunately such data are very rare, so that experimental animal data must be
substituted.
The safety factors are standardized, so as to provide comparability between
methodologies and results. To allow for the range of sensitivity within the human
population to a particular toxin, a reduction factor of 10 is applied to the NOAEL
(intraspecies uncertainty). To allow for the possible differences in toxin sensitivity
between rodent and human populations, a further factor of 10 is applied (interspecies
uncertainty). As the majority of the studies are performed over 10 to 13 weeks of
toxin exposure and the desired outcome is a safe level of toxin over the lifetime of
the consumer, an additional safety factor is required. Often there is a lack of data
on teratogenicity, reproductive injury, or tumor promotion, and the uncertainties
from these are incorporated with the lack of lifetime data to give an additional factor
TABLE 8.2
Comparative Toxicities to Rodents of Possible
Drinking Water Contaminants — Oral LD
50
(oral
dose causing 50% mortality over 24 h) mg/kg
Compound Oral LD
50
Atrazine 850
Copper 400
Acrylamide 100–270
Chlorpyriphos 60
Parathion 5
Microcystin-LR 5
Cylindrospermopsin 6 (at 7 days)
Saxitoxin 0.12
TF1713_C008.fm Page 148 Tuesday, October 26, 2004 1:43 PM
Copyright 2005 by CRC Press
Risk and Safety of Drinking Water
149
of 10 (data uncertainty). This provides a combined safety or uncertainty factor of
1000, which is the most commonly applied factor to data from rodent experiments.
Each of these factors can be reduced if the source and quality of the data are
suitable. For example, the interspecies factor is not used if human epidemiological
data are the source of the dose information. Similarly, if the experiment was done
using primates or animals with metabolic processes similar to those of humans, such
as pigs, the interspecies factor is lessened. As the overall quality and comprehen-
siveness of the data improve, further reduction can be made in the data uncertainty.
There is one additional factor that can be applied if the toxin under consideration
has particularly severe and lasting effects — for example the dioxins — and partic-
ular care must be taken in determining safe exposures. If the injury seen at the lowest
dose is a teratogenic or potentially carcinogenic response, this additional factor,
which can range from 1 to 10, applies (WHO 1996).
8.5 THE TOLERABLE DAILY INTAKE
This terminology is adopted by WHO for the estimation of the amount of a substance
that can be ingested from food or drinking water or by inhalation daily over a lifetime
without an appreciable health risk. The term has been criticized on the basis that no
toxin intake is tolerable; however, it is less vulnerable to this criticism than the term
that preceded it, the
Acceptable Daily Intake
. In the U.S., the term
Reference Dose
,
calculated on a similar basis, is employed. The TDI is expressed in micrograms or
milligrams of toxin per kilogram of body weight, as are the NOAEL or LOAEL data.
TDI is therefore calculated as
TDI =
where the combined uncertainty factors for experimental data can range from 100
to (exceptionally) 10,000, with the majority of data employing an uncertainty of
1000. The WHO considers that the combined factors should not exceed 10,000, as
the resulting TDI would be so imprecise as to lack meaning.
Once the TDI for a particular toxic compound has been calculated, this infor-
mation can be used to set safety guidelines for food, air, or water. In all cases the
relative proportion of the dose derived from each of these exposure sources must
be assessed.
For nonvolatile compounds, air is not a major environmental source and can be
omitted. Thus the contribution from food and from drinking water must be deter-
mined. For the majority of metals, industrial contaminants, and pesticides, food is
likely to be a significant source. However, groundwater and surface water are also
liable to contamination and will contribute to the intake.
In the particular case of the cyanobacterial toxins, surface water will be the
major source unless the individual is consuming toxic cyanobacteria in a health food.
An arbitrary allocation of 80 or 90% of cyanobacterial toxin intake from drinking
water has been applied. This is quite different from the normal situation for toxic
NOAEL or LOAEL()
Uncertainty factors
TF1713_C008.fm Page 149 Tuesday, October 26, 2004 1:43 PM
Copyright 2005 by CRC Press
150
Cyanobacterial Toxins of Drinking Water Supplies
contaminants, where food is the main source. In such cases, unless there are data
that can be used to improve the accuracy of the percentage, the WHO suggests that
an arbitrary value of 10% of the intake of a contaminant arising from drinking water
is applicable.
The Guideline Value (GV) for a noncarcinogenic toxicant in drinking water is
therefore
GV =
where body weight is 60 kg for adults, 10 kg for children, and 5 kg for infants and
daily water consumption is 2 L for adults, 1 L for children, and 0.75 L for infants.
A wide range of toxic contaminants have now been assessed to determine
Guideline Values; a few examples are shown in Table 8.2. These compounds have
not been identified as human carcinogens, though in some cases an additional or
increased uncertainty factor has been incorporated to account for tumor promotion
or suspected carcinogenesis in nonhuman mammals.
In the U.S., the maximum concentration of a contaminant allowed in drinking
water is defined as the Maximum Contaminant Level (MCL, also based on toxico-
logical trials in experimental animals, with the incorporation of safety factors to
determine the RfD. Up to the present, no MCLs have been set for cyanobacterial
toxins in the U.S.
In Canada, the equivalent of the GV, calculated similarly, has been defined as
the Maximum Acceptable Concentration (MAC), and a concentration for microcys-
tin-LR has been determined.
8.6 DETERMINATION OF A GUIDELINE VALUE FOR
CYLINDROSPERMOPSIN
There have been several published accounts of the oral toxicity of cylindrosperm-
opsin, the majority of studies using a single dose (Falconer, Hardy et al. 1999;
Seawright, Nolan et al. 1999; Shaw, Seawright et al. 2000). Repeat oral dosing after
a 2-week interval showed unexpectedly enhanced toxicity, indicating residual dam-
age to the animals from the first dose (Falconer and Humpage 2001).
A recent study, following the protocols set out by the OECD for subchronic oral
toxicity assessment in rodents, used male Swiss albino mice exposed to cylindro-
spermopsin through drinking water and through gavage (dosing by mouth) (OECD
1998). The first trial used a cylindrospermopsin-containing extract from cultured
Cylindrospermopsis raciborskii,
supplied in drinking water for 10 weeks. The dose
ranged from 0 to 657
µ
g/kg/day, at four levels. The animals were examined clinically
during the trial and showed no ill effects other than a small dose-related decrease
in body weight compared to controls after 10 weeks. Liver and kidney weights were
significantly higher with increasing dose.
TDI Body weight Proportion of intake from drinking water××
Daily drinking water consumption
TF1713_C008.fm Page 150 Tuesday, October 26, 2004 1:43 PM
Copyright 2005 by CRC Press
Risk and Safety of Drinking Water
151
The biochemical indicators of liver function showed dose-related changes.
Serum total bilirubin and albumin increased while serum bile acids decreased. Liver
enzyme changes in the serum showed a quite different pattern to those seen with
acute liver poisoning or hepatitis, as only a small increase in serum alanine amino-
transferase, a larger increase in alkaline phosphatase, and a decrease in aspartate
aminotransferase were observed. The most substantial change was in the urine
protein/creatinine concentration, which decreased sharply with dose. This was inter-
preted as reflecting decreased protein synthesis in the kidney through inhibition by
the toxin.
Histopathological examination of all internal organs showed changes only in the
liver and kidney. Dose-related hepatocyte damage and renal proximal tubular necro-
sis were observed (Humpage and Falconer 2003).
It was apparent from these results that lower oral doses were required to find
the NOAEL, and a second trial was carried out in which mice were dosed by gavage
over 11 weeks with 0, 30, 60, 120, and 240
µ
g/kg/day of purified cylindrospermopsin.
The same trends in serum parameters were seen, but with no statistically significant
changes. Organ weights showed more sensitivity to these low doses, with significant
increases in body weight, and, as a percentage of body weight, in liver, kidney,
adrenal glands, and testis.
Minor histopathological damage was seen in liver at the two upper dose levels
and in kidney proximal tubules at the highest dose. Urine protein/creatinine
decreased progressively with dose, reaching significance at 120
µ
/kg/day of oral
cylindrospermopsin (see Figure 6.2).
At very low dose levels of toxins, compensatory changes occur in metabolism
to restore homeostasis. The increases in organ weight can be expected to compensate
for reductions in function, as seen in the liver and kidneys, and compensation for
stresses
resulting from the toxin — for example, in the adrenal glands. It therefore
becomes subjective to decide where the NOAEL occurs, depending on which effect
is considered adverse. From these data (Figure 6.2), it is clear that the NOAEL is
below120
µ
g/kg/day. However, statistically significant change in kidney weight
occurred at 60
µ
g/kg/day. Thus, to adopt the conservative viewpoint that the most
sensitive response should be considered as the indicator of adverse effect, the dose
of 30
µ
g/kg/day is accepted as the NOAEL from these trials (Humpage and Falconer
2003).
From this value, the TDI for cylindrospermopsin in drinking water can be
calculated:
TDI = = = 0.03
µ
g/kg/day
Uncertainty factors are as follows: 10 intraspecies (human variability); 10 inter-
species (rodent compared to human); 10 limitations in data, including subchronic,
not lifetime, exposure; use only of male mice; possibility of mutagenicity or carci-
nogenicity; and lack of data for teratogenicity or reproductive toxicity, which gives
an overall uncertainty of 1000.
30
Uncertainty factors
30
1000
TF1713_C008.fm Page 151 Tuesday, October 26, 2004 1:43 PM
Copyright 2005 by CRC Press
152
Cyanobacterial Toxins of Drinking Water Supplies
The GV for safe drinking water is
GV = = 0.81
µ
g/L
Or, for practical purposes, the GV for cylindrospermopsin is 1
µ
g/L.
The need for a GV for cylindrospermopsin is currently under consideration by
the WHO Chemical Safety in Drinking Water committee, together with the available
data from which the Guideline Value can be determined.
8.7 THE TOLERABLE DAILY INTAKE AND DRINKING
WATER GUIDELINE VALUE FOR MICROCYSTIN
Microcystin has been the most thoroughly investigated cyanobacterial toxin and is
still the major toxin under investigation. As described in Chapter 7, the research
has included studies of acute, subchronic, and chronic oral exposure to microcystins
in several species of animal and humans. The criteria set out for oral exposure studies
by the OECD, contributing to TDI calculations, have, however, been completely met
only by Fawell, James et al. (1994) in their study of mouse exposure. This met the
criteria for duration of exposure, both genders of animal, and experimental design.
The data are discussed in Chapter 7. The conclusion was drawn that the NOAEL
for microcystin-LR was 40
µ
g/kg/day. This was supported by the oral toxicity study
carried out in pigs, which resulted in a LOAEL of 100
µ
g/kg/day of microcystin-
LR equivalents (Kuiper-Goodman, Falconer et al. 1999). Therefore,
TDI = = 0.04
µ
g/kg/day
In this case the uncertainty factors were the same as those used for cylindro-
spermopsin, the limitations in data including evidence of tumor promotion, suspicion
of carcinogenesis, conflicting data in teratogenesis, and less than lifetime exposure
studies.
From this TDI, the GV for drinking water was calculated as
GV = = 0.96
µ
g/L
Thus the GV for safe drinking water for microcystin-LR is 1
µ
g/L.
This was adopted as a provisional guideline by the WHO in 1998 as applying
only to microcystin-LR (WHO 1997). Since that time Australia, Brazil, Canada,
the European Union, and New Zealand have incorporated guideline levels or con-
centration standards for microcystins in their national drinking water supplies.
Because microcystin-LR is not the only common microcystin in water supply
reservoirs, consideration must be given to toxicity arising from other microcystins.
In particular instances reservoirs and lakes have carried heavy water blooms of
0.03 60 kg()0.9 proportion in water()××
2 L/day
40
Uncertainty factors
40
1000
=
0.04 60 kg 0.8 (proportion in drinking water)××
2 L
TF1713_C008.fm Page 152 Tuesday, October 26, 2004 1:43 PM
Copyright 2005 by CRC Press
Risk and Safety of Drinking Water
153
Microcystis aeruginosa
that contained predominantly microcystin-LA, others micro-
cystin-LY, others microcystin-YM, and yet others microcystin-RR. Almost all
blooms have a mixture of microcystins present.
In the case of provision of safe drinking water, specifying a concentration for a
single microcystin may be quite inappropriate. Even worse would be chemical or
immunochemical analysis for microcystin-LR alone, which may miss high toxic
concentrations of other microcystins. National guidelines have adapted the WHO
guideline by using the concept of total microcystins expressed as equivalent toxicity
to microcystin-LR. The toxicities of many microcystins are known, and others can
be presumed equal to microcystin-LR as a safe default value (Table 8.3).
The most commonly used analytical methods will identify the range of micro-
cystins, as discussed in Chapter 9. By converting the quantitative chemical data for
separate microcystins to toxicity equivalents on the basis of comparative toxicity to
microcystin-LR, a total toxicity can be determined equivalent to microcystin-LR,
and applied to the Guideline Value of 1
µ
g/L. This will provide the level of safety
for drinking water intended by the WHO guideline.
8.8 CYLINDROSPERMOPSINS AND MICROCYSTINS
AS CARCINOGENS?
Carcinogens present a well-recognized hazard to the human population. The risk of
getting cancer from substances in the environment is the topic of much controversy
and has led to considerable research. The early recognition of a connection between
the inhalation of substances later found to be carcinogens and cancer in the exposed
workers was one major motivation for the establishment in 1948 in the U.S. of the
Environmental Cancer Section of the National Cancer Institute. Through the work
TABLE 8.3
Toxicity of Microcystin Variants with Different
L-Amino Acids in the Peptide Ring — Absence
of Methyl Groups from Methylated Amino
Acids Reduces Toxicity in Des-Methyl Variants
Microcystin LD
50
MCYST-LA 50
MCYST-YM 56
MCYST-LR 60
MCYST-YR 70
MCYST-LY 90
MCYST-WR 150–200
MCYST-FR 250
MCYST-AR 250
MCYST-RR 600
From Sivonen and Jones 1999. With permission.
TF1713_C008.fm Page 153 Tuesday, October 26, 2004 1:43 PM
Copyright 2005 by CRC Press
154
Cyanobacterial Toxins of Drinking Water Supplies
of Wilhelm Heuper, occupational exposure to
β
-napthylamine by dye industry work-
ers was shown to result in bladder cancer (discussed in Hrudey 1998). More recently,
exposure of miners and building workers to asbestos fiber has been shown to result
in a particular type of lung cancer — mesothelioma — with damages cases currently
before the law courts. Because of these and other demonstrated cancers resulting
from occupational exposure, the risk of cancer from environmental contaminants
has become increasingly apparent.
What is much more difficult to achieve than the qualitative identification of a
hazard is to accurately determine risk from environmental exposures. The results of
human epidemiology studies are strongest when the amount of exposure to a poten-
tial carcinogen can be related to the subsequent rate of cancer in the population.
This has been done for some occupational exposures to carcinogens but is very
difficult for environmental exposures. An example of the difficulty of relating human
exposure to outcomes, including cancer, can be seen in the current debate and
research into endocrine-disrupting compounds. No clear consensus has emerged on
the risk to the population of environmental exposures, whereas clear evidence exists
for both pharmacological and occupational exposure (WHO/IPCS 2002).
As cancer is such a considerable component of total mortality, with one-quarter
to one-third of western populations dying of the disease, the identification of “extrin-
sic” or external factors resulting in cancer is of great importance. The WHO sug-
gested in 1964 that three-quarters of all cancers were of extrinsic origin, as compared
with only one-quarter from internal genetic or biochemical origins (WHO 1964). It
is of value to identify what proportion of cancers due to these extrinsic factors can
be attributed to food or water, so that modifications to diet, or food and water
contaminant regulations, can be used to reduce cancer rates. It was estimated in
1981 that the proportion of cancer deaths that could be attributed to diet was 35%,
higher than tobacco at 30% and much higher than alcohol at 3% or pollution at 2%
(Doll and Peto 1981). In particular, it was found that voluntary modifications to diet
can substantially reduce cancer risk without any regulatory involvement (Thomas
and Hrudey 1997).
In the recent past, one of the biggest avoidable causes of death from disease
was smoking. In Canada, the 1991 data showed 26% of all male deaths and 15%
of all female deaths attributed to smoking (Thomas and Hrudey 1997). Of these
deaths, 40% were due to cancer. Thus the risk of death from smoking-related cancer
in the overall male population was roughly 10%, or 0.1.
Estimation of the additional risk, or additional deaths, that can be attributed to
a particular environmental contaminant is best done from data from human epide-
miology if available. As cancer risk is proportional to carcinogen dose, accurate
human risk calculations require exposure data that are almost never available. For
environmental exposures, this is particularly difficult, as individuals have multiple
sources of contaminants, normally at very low doses.
To provide estimates of cancer risk for the variety of carcinogens from industrial
and natural sources that occur in food or drinking water, experimental animal models
have been widely applied. The basic data is obtained from a dose–response trial in
which a range of doses are applied for a lifetime to a large number of experimental
animals and cancers recorded. The highest dose is arbitrarily aimed at being the
TF1713_C008.fm Page 154 Tuesday, October 26, 2004 1:43 PM
Copyright 2005 by CRC Press
Risk and Safety of Drinking Water
155
maximum dose that can be given orally with a weight loss of less than 10% compared
to controls and with no overt signs of toxicity, which is termed the Maximum
Tolerated Dose (MTD). The lower doses are simple proportions of this, such as one-
half and one-quarter. Thus a set of dose–response data is generated, with cancer
rates at three dose levels and zero dose, which reflects the underlying cancer rate
of untreated animals.
The concept that there is no threshold dose of a carcinogen has been widely
adopted on the basis that a single mutational event may lead to cancer and that the
increased cancer incidence will be directly proportional to increased dose. This
appears to fit well with radiation-induced cancers and also with what evidence is
available for chemical carcinogenesis (McMichael 1991). On the strength of this
assumption, several curve-fitting models have been developed, all projecting back
to zero dose, at which there is no increased cancer probability. The most widely
applied is the linear multistage model. This model simplifies to
A(d)
=
q
1
*
d
where
A(d)
is the additional risk (probability) of cancer from exposure to dose
d
,
q
1
* is the slope of the probability/dose plot, and d is the dose in question.
This model can be extrapolated back to a point at which an arbitrary risk
probability is reached, providing a dose for that risk level, or alternatively extrapo-
lated to provide a figure for the risk probability at any specified dose (USEPA 1996).
Because of the inherent variability of biological data, the 95% upper confidence
limit of the slope estimate is used for the probability estimate to give a conservative
figure.
Experimental data from animal cancer trials is likely to give moderate percent-
ages of affected animals, at doses of carcinogen vastly higher than likely to be
encountered in the environment. To determine the dose level that provides an accept-
able level of excess risk, the line from the experimental data is extrapolated down
to low doses. The level of risk used by the WHO for the determination of Guideline
Values is a probability of 10
–5
additional cancers — i.e., 1 in 100,000 (WHO 1996).
As the experimental data will be likely to require 1 (or more) in 10 excess cancers
to meet statistical significance, the downward extrapolation of dose is considerable.
This can lead to an overestimation of the risk or underestimation of the dose. In
practice, the major factor determining the slope of the dose–response line is the
toxicity of the compound, which sets the doses used in the trial. Highly toxic
carcinogens will have a steep slope, compared with less toxic carcinogens, irrespec-
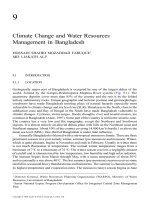
tive of carcinogenicity (Lovell and Thomas 1996; Hrudey 1998). This is illustrated
in Figure 8.2 from Hrudey (1998). The outcome of this effect is that the slope value,
q
1
*, of risk against dose shows a strong negative correlation with MTD. A range of
slope factors and drinking water Guideline Values calculated by carcinogen risk
assessment are shown in Table 8.4. There has been considerable discussion on the
continued use of no-threshold models and their lack of consideration of many factors
affecting carcinogenesis in humans and experimental animals. This has resulted in
proposals for alternative models. One of these is the Benchmark Dose (BMD), which
TF1713_C008.fm Page 155 Tuesday, October 26, 2004 1:43 PM
Copyright 2005 by CRC Press
156
Cyanobacterial Toxins of Drinking Water Supplies
is also calculated from the additional cancers resulting from a range of doses of
carcinogen in rodents. This model required less extrapolation, as it defines the
probability of excess cancers — i.e., the excess risk, at 1, 5, or 10% — as the starting
point from which the BMD was calculated. This risk level is likely to be close to
or within the experimental results. It used the upper probability of the 95% confi-
dence interval to account for statistical variation. The curve-fitting model may be
sigmoid or whatever model best fits the experimental data. Figure 8.3 (Di Marco,
Anderssen et al. 1999) illustrates this approach.
The BMD is thus directly related to risk, as the probability of a particular level
of additional cancers is decided in advance and the dose providing the risk obtained
from the experimental data. To this dose is then applied a series of uncertainty factors
FIGURE 8.2
Association between the upper bounds on low-dose slope estimates and the
maximum dose used in rodent carcinogen bioassays. (From Hrudey 1998. With permission.)
TABLE 8.4
Slope Factors for Carcinogens in Drinking Water (mg/kg/day)
and Their Guideline Values for Drinking Water (
µµ
µµ
g/L), Based
on 1 In 100,000 Risk Probability of Excess Cancers
Compound Slope Factor Guideline Value
Acrylamide 4.5 0.08
Hexachlorobenzene 1.6 0.2
Arsenic 1.5 0.2
Bromate 0.7 0.5
Benzene 0.015–0.055 10–100
From the USEPA Integrated Risk Information System database (IRIS).
MTD/mg kg
–1
day
–1
Upper bound on low dose slope/mg
kg
–1
day
–1
10000000
100000
10000
1000
100
10
1
·1
·01
·001
·0001
·00001
100001000100101·1·01·001·0001·00001
Multi-stage model
(r = –0.941)
linear regression
95% prediction interval
TF1713_C008.fm Page 156 Tuesday, October 26, 2004 1:43 PM
Copyright 2005 by CRC Press
Risk and Safety of Drinking Water
157
and modifying factors to obtain the Guideline Value, which is an estimate of the
dose giving no increased risk for lifetime exposure. This has been developed further
into the
modified
BMD, which is based on the dose of the substance which produces
a 5% increase in cancer incidence, using the central estimate of the dose–response
relationship. The Guideline Value is then obtained after applying four safety or
uncertainty factors. Two are the same as applied in the TDI calculation — that is,
10 for intraspecific variability and 10 for interspecific variability. The third is for
quality of information, ranging from 1 to 10 on the basis of uncertainty of data. This
is comparable to the third factor in TDI calculations. The fourth factor is for extent
of malignancy, organ susceptibility, and genotoxicity; together, these are assigned
an uncertainty factor from 1 to 50. Thus the range of overall uncertainty factors is
from 100 to 50,000 for rodent data, giving considerable room for subjective assess-
ments (Di Marco, Anderssen et al. 1999).
To resolve whether a compound should be regarded as a human carcinogen and
Guideline Values determined using a no-threshold approach, a set of standardized
criteria have been applied (USEPA 1986).
These identify the following:
A human carcinogen as a substance for which sufficient evidence has been
provided from epidemiological studies to support a causal association
between exposure to the agent and cancer.
FIGURE 8.3
Hypothetical data for the determination of the benchmark dose for a carcinogen
for a specified level of rise, using a best-fitting curvilinear dose–response model. At risk
p
,
a horizontal line meeting the dose–response curve determines the Benchmark Dose (BMDp).
(From DiMarco, Anderssen et al. 1999. With permission.)
Extra risk
Best fitting dose–response
model
Dose (mg/kg/day)
0.0
0.5
1.0
Risk p
Lower statistical limit
on dose
NOAEL
BMD
P
TF1713_C008.fm Page 157 Tuesday, October 26, 2004 1:43 PM
Copyright 2005 by CRC Press
158
Cyanobacterial Toxins of Drinking Water Supplies
A probable human carcinogen is a substance for which limited evidence is
available from epidemiological studies for human carcinogenesis, or suffi-
cient evidence is available from animal studies and no evidence available
from epidemiology.
A possible human carcinogen is a substance for which there is limited evi-
dence of carcinogenicity in animals and an absence of evidence from human
epidemiology.
A substance not classifiable as to human carcinogenicity for which there is
inadequate human or animal data for carcinogenicity.
A noncarcinogenic substance for which there is negative evidence in at least
two adequate animal tests in two species or negative evidence in both
adequate epidemiological and animal studies.
Those substances classified as human carcinogens and those classified as prob-
able human carcinogens are assessed for risk and guideline levels on the basis of
the no-threshold model. The other groups of substances are assessed by experimen-
tally determining the NOAEL for calculation of the TDI and the Guideline Value,
as described earlier.
8.9 CYLINDROSPERMOPSIN — IS IT A CARCINOGEN?
To answer this question, the present experimental and epidemiological data must be
examined in the light of the USEPA criteria set out above.
The first and strongest criterion for a human carcinogen is that of human epi-
demiology, establishing a cause–effect relationship between exposure and cancer.
There are no published data on this for cylindrospermopsin. Very preliminary data
with small numbers of excess cancers of the liver and gastrointestinal tract have
been recorded in the Palm Island population, who were exposed to cylindrosperm-
opsin poisoning in 1979 (unpublished personal data). Geographically based analysis
of cancer rates in Florida showed a significantly increased risk of liver cancer in
populations located in areas supplied with surface water for drinking compared with
those in contiguous areas (Fleming, Rivero et al. 2002). Earlier, a survey of micro-
cystins and cylindrospermopsin in tap water in Florida had shown appreciable
concentrations, especially of cylindrospermopsin, in reservoirs and finished water
in some localities supplied from surface water sources (Williams, Burns et al. 2001).
None of these data meet the requirements for an established dose–effect relationship.
The second criterion for a probable human carcinogen accepts data from exper-
imental studies of carcinogenesis as well as epidemiology. At present there are
several studies that can be considered, as well as the nature of the molecule itself.
Cylindrospermopsin is a substituted pyrimidine, with potential to intercalate into the
DNA double helix. The clearest experimental data on genotoxicity is the study of
the effect of cylindrospermopsin on a well-understood human white cell line in
culture. This demonstrated both a clastogenic (chromosome breakage) and aneugenic
(whole chromosome loss) action of the toxin on dividing cells (Humpage, Fenech
et al. 2000). These data show DNA damage of a major type, which in the experiments
led to micronucleus formation and hence defective cells through DNA loss. Other
TF1713_C008.fm Page 158 Tuesday, October 26, 2004 1:43 PM
Copyright 2005 by CRC Press
Risk and Safety of Drinking Water
159
evidence of potential DNA damage by cylindrospermopsin was shown by data
suggesting DNA–cylindrospermopsin adduct formation in hepatocytes (Shaw,
Seawright et al. 2000). The absence of DNA strand breaks in Chinese hamster ovary
cells incubated with cylindrospermopsin may indicate that a metabolite of cylindro-
spermopsin is responsible for genotoxicity, rather than the parent compound (Fessard
and Bernard 2003). Further studies of the mutagenic activity of cylindrospermopsin
are currently in progress in Australia and Europe.
The only published whole-animal study investigating carcinogenesis after
cylindrospermopsin was supplied orally to mice reported a relative risk in dosed
mice of 6.6, calculated from 5 tumors in 53 dosed mice compared to none in 27
control mice. These numbers of experimental animals did not give statistical signif-
icance for the increased risk (Falconer and Humpage 2001). The data are, however,
indicative that the potential for carcinogenesis from cylindrospermopsin requires
urgent investigation. Cylindrospermopsin is currently a “candidate” toxin for the
U.S. National Toxicology Program, which is at present exploring the feasibility of
a standard toxicological assessment.
The IARC is the WHO group that resolves whether the data for a particular
chemical are strong enough for a determination of a substance as a probable human
carcinogen. On the basis of the present data, it is unlikely that such a determination
can be made. The IARC may wish to await the results from the U.S. National
Toxicology Program prior to review of the data for cylindrospermopsin as a
carcinogen.
In the absence of adequate data and the likelihood of several years’ delay in
obtaining carcinogenicity data from standard protocol experiments, it is of interest
to try to model the possible situation for cancer risk from cylindrospermopsin.
Assuming that the toxin is classed as a probable human carcinogen, then assessment
of its carcinogenicity can be presumed to fall within the considerable body of present
data for carcinogens. As discussed earlier, the major component that determines the
slope factor for a carcinogen is its MTD. A linear relationship for slope factor
(obtained from the multistage model) against MTD has a negative correlation of
r
= –0.941, demonstrating the high correlation of toxicity to slope (Figure 8.2)
(Krewski, Gaylor et al. 1993; Hrudey 1998). Applying an oral toxicity for cylindro-
spermopsin in mice of approximate MTD of 500
µ
g/kg/day to the regression above,
the slope factor (the upper bound on the low-dose slope) is 1.6 mg/kg/day. This is
comparable to arsenic at 1.5 and hexachlorobenzene at 1.6 mg/kg/day (WHO 1996).
The calculated risk is then the slope factor multiplied by the exposure, so that a
lifetime exposure of 1.0
µ
g of cylindrospermopsin per liter of drinking water (equal
to 0.03
µ
g/kg/day of cylindrospermopsin in a 60-kg adult drinking 2 L of water)
will result in a theoretical risk of 1 in 20,000 excess cancers.
This is appreciably higher than the standard accepted risk for carcinogens in
drinking water of 1 in 100,000 used by the WHO. To generate a risk estimate of
1 in 100,000 for cylindrospermopsin in drinking water by this approach, the Guide-
line Value would be reduced to approximately 0.2
µ
g/L. The range for the Guideline
Value for cylindrospermopsin in drinking water therefore appears to fall between
0.2
µ
g/L from the carcinogenicity approach to 1.0
µ
g/L from NOAEL data. This
relative closeness in outcomes is not uncommon for toxins, irrespective of the use
TF1713_C008.fm Page 159 Tuesday, October 26, 2004 1:43 PM
Copyright 2005 by CRC Press
160
Cyanobacterial Toxins of Drinking Water Supplies
of the threshold model or the linear multistage model for calculation. Both
approaches use the precautionary principle, with the safety factors designed to
provide a wide margin of safety.
8.10 MICROCYSTINS AND NODULARINS — ARE THEY
CARCINOGENS?
This question must by approached in the same way as the comparable question for
cylindrospermopsin.
First, is there epidemiological evidence of human carcinogenesis, which may
place these toxins in the human carcinogen category? There is considerable evidence
from China that the consumption of surface water is associated with an increased
risk of liver cancer (Yu 1995). It has been suggested that microcystins present in
the surface water are responsible. What has not been established is the microcystin
exposure data for these populations with sufficient accuracy to ensure that the effect
is due to microcystins and not other carcinogenic substances in the water. The
microcystin concentrations that have been measured appear low compared with
concentrations in Australian or northern European surface waters (Zhang, Car-
michael et al. 1991; Ueno, Nagata et al. 1996).
A recent epidemiological study of colorectal cancer in an area of China has
shown an association between drinking surface water and these cancers. Measure-
ment of microcystins in the drinking water sources show a positive correlation of
colorectal cancer with microcystin content in the water (Zhou, Yu et al. 2002). This
is stronger epidemiological evidence than the data for liver cancer, as a result of the
assessments of exposure of the population.
Without further epidemiological data for a dose–response relationship between
cancer rate and microcystin concentrations in drinking water, it is not possible to
classify microcystins as human carcinogens.
For classification as probable human carcinogens, the case is stronger. For
microcystins and nodularins, there is a large body of evidence from animal studies
that is relevant and can be considered with the epidemiological data. Thus the
classification of these toxins as probable human carcinogens requires careful con-
sideration. Whole-animal studies by researchers in several laboratories have clearly
shown that microcystins and nodularin are active tumor promoters in liver, colon,
and skin, as discussed earlier. This does not imply that they are carcinogenic but
leaves open the possibility that they may be nongenotoxic carcinogens. Observation
of liver tumor growth following repeated high doses of microcystin-LR without prior
dosing with carcinogen has been regarded as evidence for carcinogenesis (Ito, Kondo
et al. 1997). Similarly, induction of precancerous foci in liver, caused by nodularin
in the absence of prior carcinogen treatment, has been interpreted as implying direct
carcinogenesis (Ohta, Sueoka et al. 1994). The difficulty with this interpretation is
that a tumor promoter will stimulate cells mutated by prior exposure to dietary
carcinogens, radiation, or natural errors in chromosome replication into precancerous
foci or, with extended high doses, into cancers. Thus a range of evidence for
TF1713_C008.fm Page 160 Tuesday, October 26, 2004 1:43 PM
Copyright 2005 by CRC Press
Risk and Safety of Drinking Water
161
carcinogenesis by microcystins or nodularins using differing experimental designs
is required before a finite conclusion can be drawn.
Evidence for genotoxicity of microcystins and nodularin is similarly inconclu-
sive, as these toxins cause apoptosis and necrosis of hepatocytes and other cells.
This results in DNA damage, which is observed in experimental systems such as
the Comet assay and in other
in vitro
and
in vivo
tests (Rao and Bhattacharya 1996).
Some of the genotoxicity research has used
Microcystis
cell extracts containing
microcystins and potentially a range of other bioactive components, making it
difficult to ascertain the cause of any effects seen (Ding, Shen et al. 1999; Mank-
iewicz, Walter et al. 2002).
On balance, the available data are not strong enough to support classification of
microcystins or nodularins as probable human carcinogens, though the definitive
answer to this lies with the IARC, which has not yet reviewed the data.
Evidence for tumor promotion by these toxins is strong and unambiguous.
Together with the epidemiological data and the possibility of carcinogenesis dis-
cussed above, the evidence supports the classification of these compounds as possible
human carcinogens. On this basis, the threshold hypothesis is the most applicable
to risk assessment. In the absence of dose–response data for cancers, the BMD
method for carcinogens cannot be applied. However, experimental measurement of
the NOAEL, data for which is available, can be used to calculate a TDI and Guideline
Value for microcystins in drinking water. This does not depend on the outcome of
carcinogenicity trials; however, the determination incorporates a combined uncer-
tainty factor including tumor promotion and is the basis for the present WHO
Guideline Value of 1 µg/L microcystin-LR.
8.11 CHRONIC LIFETIME DOSE, INTERMITTENT
ACUTE DOSES, AND RECREATIONAL EXPOSURES
Among the issues that arise from the very fluctuating concentration of toxic cyano-
bacterial cells in water sources is the interpretation of Guideline Values in the case
of short times where the value is exceeded in drinking water. This issue of possible
intermittent exposure to high concentrations of toxin also arises in recreational
exposure to cyanobacterial toxins while swimming or participating in other body-
immersion water sports. The WHO Guideline Values are conservative figures aimed
at providing safety over a lifetime of consumption at this concentration and therefore
are not directly applicable to brief exposures to toxins.
How, then, should an acute rise in cyanobacterial toxin concentration in drinking
water to above the Guideline Value be regarded? Clearly the risk associated with
toxin in drinking water is directly related to the concentration and also, but less
directly, to the duration of exposure. It has been argued that the logical approach to
the concentration question can be seen from scrutiny of the safety factors used in
calculating the Guideline Value. If, for example, the trial for ascertaining the NOAEL
was done by gavage for a subchronic duration, then an additional uncertainty factor
of 10 may have been applied in the calculation of the TDI for a lifetime duration.
For calculating a safe dose from a single exposure or a short duration, this factor
TF1713_C008.fm Page 161 Tuesday, October 26, 2004 1:43 PM
Copyright 2005 by CRC Press
162 Cyanobacterial Toxins of Drinking Water Supplies
would not be required (Fitzgerald, Cunliffe et al. 1999). Hence an increase in the
Guideline Value concentration by a factor of 10 may provide an estimate of the toxin
concentration unlikely to cause harm from an acute exposure.
This approach has been used to develop Alert Levels for microcystins in water
supplies. These Alert Levels can be legislated, so that the drinking water supplier
must notify the health authorities if they are reached. The health authority then has
the responsibility to determine further action — for example, discontinuance of a
particular water source. The Alert Level proposed for South Australia for both total
microcystins and for nodularin in drinking water is 10 µg/L (Fitzgerald, Cunliffe
et al. 1999). This may be converted into a cell concentration of 20,000 cells per
milliliter by using the cell content of microcystins determined from highly toxic
blooms (WHO 2003). It may be considered that these levels are insufficiently
conservative if the likelihood of toxin contamination at this level occurs several
times a year. In this case notification of the health authority may be more appropriate
at 5 µg/L. State and provincial legislatures should consider local circumstances when
setting regulated levels of cyanobacterial toxins in drinking water, both as Guideline
Values and as Alert Levels.
For recreational waters, the toxin concentration is not the most practical measure
to determine safety, as it can be known only after analysis, which would delay action
by responsible authorities. Cyanobacterial cell concentrations vary quickly, espe-
cially in situations where scums can form on bathing beaches. Cell numbers form
a reasonable approximation to toxin concentration provided that the toxic species is
identified. There are extensive data on the toxin content of cells, so it is possible
to base recommendations on the highest toxicity seen in natural samples. This
approach has been described by Chorus, Falconer et al. (2001), who set out a decision
structure for the control of recreational exposure — considered in more detail in
Chapter 9 (Chorus and Bartram 1999). The WHO has published Guidelines for Safe
Recreational Water Environments (WHO 2003), which discusses the approach to
safety in the presence of cyanobacterial blooms, similarly based on species identi-
fication and cell numbers in the water. The WHO classification of “moderate prob-
ability of adverse health effects” (WHO 2003, p. 149) is set at 100,000 cells per
milliliter. This may be associated with toxin concentrations up to 100 µg/L, though
more probably 20 to 40 µg/L if the bloom is Microcystis, Planktothrix, or Cylin-
drospermopsis. This can be used as the basis for legislated Alert Levels for recre-
ational waters. How it is interpreted will depend on local circumstances. A conser-
vative approach would be to designate 2,000 cells per milliliter as the first Alert
Level, with increased scrutiny of the water body. At 20,000 cells per milliliter as
the second Alert Level, warning signs could be posted but the area left open to
bathing. At 100,000 cells per milliliter as the third Alert Level, the area is closed to
body-contact water sports, including water skiing, sailboarding, jet skiing, and other
sports in which there is a likelihood of toxin inhalation. At this cell concentration,
there is a high chance of scum formation on bathing beaches, with associated high
probabilities of adverse health effects.
TF1713_C008.fm Page 162 Tuesday, October 26, 2004 1:43 PM
Copyright 2005 by CRC Press
Risk and Safety of Drinking Water 163
REFERENCES
Chorus, I. and J. Bartram (1999). Toxic Cyanobacteria in Water: A Guide to Their Public
Health Consequences, Monitoring and Management. London, E & FN Spon (on
behalf of WHO).
Chorus, I., I. R. Falconer, et al. (2001). Health risks caused by freshwater cyanobacteria
in recreational water. Journal of Toxicology and Environmental Health Part B,
3: 323–347.
Di Marco, P., R. Anderssen, et al. (1999). Toxicity Assessment for Carcinogenic Soil Contam-
inants. Canberra, National Health and Medical Research Council: 90.
Ding, W. X., H. M. Shen, et al. (1999). Genotoxicity of microcystic cyanobacteria extract of
a water source in China. Mutation Research 442: 69–77.
Doll, R. and R. Peto (1981). The causes of cancer: Quantitative estimates of avoidable risks
of cancer in the United States today. Journal of the National Cancer Institute 66(6):
1192–1308.
Falconer, I. R., S. J. Hardy, et al. (1999). Hepatic and renal toxicity of the blue-green alga
(cyanobacterium) Cylindrospermopsis raciborskii in male Swiss Albino mice. Envi-
ronmental Toxicology 14(1): 143–150.
Falconer, I. R. and A. R. Humpage (2001). Preliminary evidence for in-vivo tumour initiation
by oral administration of extracts of the blue-green alga Cylindrospermopsis raci-
borskii containing the toxin cylindrospermopsin. Environmental Toxicology 16(2):
192–195.
Fawell, J. K., C. P. James, et al. (1994). Toxins from Blue-Green Algae: Toxicological Assess-
ment of Microcystin-LR and a Method for Its Determination in Water. Medmenham,
U.K., Water Research Centre, plc.
Fessard, V. and C. Bernard (2003). Cell alterations but no strand breaks induced in vitro by
cylindrospermopsin in CHO K1 cells. Environmental Toxicology 18(5): 353–359.
Fitzgerald, D. J., D. A. Cunliffe, et al. (1999). Development of health alerts for cyanobacteria
and related toxins in drinking-water in South Australia. Environmental Toxicology
14(1): 203–209.
Fleming, L. E., C. Rivero, et al. (2002). Blue green algal (cyanobacterial) toxins, surface
drinking water, and liver cancer in Florida. Harmful Algae 1: 157–168.
Hrudey, S. E. (1998). Quantitative cancer risk assessment: Pitfalls and progress. Risk Assess-
ment and Risk Management. R. E. Hester and R. M. Harrison, eds. Cambridge, U.K.,
The Royal Society of Chemistry: 57–90.
Hrudey, S. E., P. Payment, et al. (2003). A fatal waterborne disease epidemic in Walkerton,
Ontario: Comparison with other waterborne outbreaks in the developed world. Water
Science and Technology 47(3): 7–14.
Humpage, A. R. and I. R. Falconer (2003). Oral toxicity of the cyanobacterial toxin cylindro-
spermopsin in male Swiss albino mice: Determination of No Observed Adverse Effect
Level for deriving a drinking water Guideline Value. Environmental Toxicology 18:
94–103.
Humpage, A. R., M. Fenech, et al. (2000). Micronucleus induction and chromosome loss in
WIL2-NS cells exposed to the cyanobacterial toxin, cylindrospermopsin. Mutation
Research 472: 155–161.
Hwang, B. F., P. Magnus, et al. (2002). Risk of specific birth defects in relation to chlorination
and the amount of natural organic matter in the water supply. American Journal of
Epidemiology 156(4): 374–382.
Ito, E., F. Kondo, et al. (1997). Neoplastic nodular formation in mouse liver induced by
repeated intraperitoneal injections of microcystin-LR. Toxicon 35(9): 1453–1457.
TF1713_C008.fm Page 163 Tuesday, October 26, 2004 1:43 PM
Copyright 2005 by CRC Press
164 Cyanobacterial Toxins of Drinking Water Supplies
Krewski, D., D. W. Gaylor, et al. (1993). An overview of the report: Correlation between
carcinogenic potency and maximum tolerated dose: Implications for risk assessment.
Risk Analysis 13(4): 383–398.
Kuiper-Goodman, T., I. Falconer, et al. (1999). Human health aspects. Toxic Cyanobacteria
in Water: A Guide to Their Public Health Consequences, Monitoring and Manage-
ment. I. Chorus and J. Bartram, eds. London, E & FN Spon (on behalf of WHO):
113–153.
Lovell, D. P. and G. Thomas (1996). Quantative risk assessment and the limitations of the
linearised multistage model. Human and Experimental Toxicology 15: 87–104.
Mankiewicz, J., Z. Walter, et al. (2002). Genotoxicity of cyanobacteria extracts containing
microcystins from Polish water reservoirs as determined by SOS Chromotest and
comet assay. Environmental Toxicology 17(4): 341–350.
McMichael, A. J. (1991). Setting environmental exposures standards: Current concepts and
controversies. International Journal of Environmental Health Research 1: 2–13.
National Health and Medical Research Council (2004). Discussion document on the Frame-
work for Management of Drinking Water Quality. www.nhmrc.gov.au/advice/pdf/
watergly/pdf.
O’Connor, D. R. (2002). Reports of the Walkerton Commission of Inquiry, Ontario Ministry
of the Attorney General. 2003.
OECD (1998). OECD Guideline for the Testing of Chemicals. Paris, Organization for Euro-
pean Cooperation and Development: 10.
Ohta, T., E. Sueoka, et al. (1994). Nodularin, a potent inhibitor of protein phosphatases 1 and
2a, is a new environmental carcinogen in male f344 rat liver. Cancer Research 54:
6402–6406.
Pan-American Health Organization (1984). Guidelines for Drinking Water Quality: Vol. 1.
Recommendations. Washington, D.C., PAHO.
Rao, P. V. and R. Bhattacharya (1996). The cyanobacterial toxin microcystin-LR induced
DNA damage in mouse liver in vivo. Toxicology 114(1): 29–36.
Robertson, P. (1988). Development of maximum contaminant levels under the Safe Drinking
Water Act. Washington, D.C., U.S. Environmental Protection Agency: 23.
Seawright, A. A., C. C. Nolan, et al. (1999). The oral toxicity for mice of the tropical
cyanobacterium Cylindrospermopsis raciborskii (Woloszynska). Environmental Tox-
icology 14(1): 135–142.
Shaw, G. R., A. A. Seawright, et al. (2000). Cylindrospermopsin, a cyanobacterial alkaloid:
Evaluation of its toxicologic activity. Therapeutic Drug Monitoring 22(1): 89–92.
Sivonen, K. and G. Jones (1999). Cyanobacterial toxins. Toxic Cyanobacteria in Water. A
Guide to Their Public Health Consequences, Monitoring and Management. I. Chorus
and J. Bartram, eds. London, E & FN Spon (on behalf of WHO): 41–111.
Thomas, S. P. and S. E. Hrudey (1997). Risk of Death in Canada. Edmonton, University of
Alberta Press.
USEPA (1986). Cancer risk assessment guidelines. Federal Register 51: 33992–34005.
USEPA (1996). Draft Revision to the Guidelines for Carcinogenic Risk Assessment. Wash-
ington, D.C., Office of Health and Environmental Assessment, Office of Research
and Development, United States Environmental Protection Agency.
USEPA (2004). Integrated Risk Information System. United States Environmental Protection
Agency electronic database, www.epa.gov/iris/
Ueno, Y., S. Nagata, et al. (1996). Detection of microcystins, a blue-green algal hepatotoxin,
in drinking water sampled in Haimen and Fusui, endemic areas of primary liver
cancer in China, by highly sensitive immunoassay. Carcinogenesis 17: 1317–1321.
WHO (1964). Prevention of Cancer. Geneva, World Health Organization.
TF1713_C008.fm Page 164 Tuesday, October 26, 2004 1:43 PM
Copyright 2005 by CRC Press
Risk and Safety of Drinking Water 165
WHO (1984). Guidelines for Drinking Water Quality. First edition. Geneva, World Health
Organization.
WHO (1996). Guidelines for Drinking Water Quality. Second edition. Geneva, World Health
Organization.
WHO (1997). Microcystin-LR. From the Report of the World Health Organization Working
Group Meeting on Chemical Substances in Drinking Water, 22–26 April 1997.
Geneva, World Health Organization.
WHO (2003). Algae and cyanobacteria in fresh water. Guidelines for Safe Recreational Water
Environments. Geneva, World Health Organization: 1: 136–158.
WHO/Food and Agriculture Organization (1995). Application of Risk Analysis to Food Stan-
dards Issues. WHO/FNU/FOS/95.3. Geneva, World Health Organization.
WHO/IPCS (2002). Global Assessment of the State-of-the-Science of Endocrine Disruptors.
Geneva, World Health Organization/International Program on Chemical Safety: 180.
Williams, C. D., J. Burns, et al. (2001). Assessment of cyanotoxins in Florida’s lakes, reser-
voirs, and rivers. Cyanobacteria Survey Project. Harmful Algal Bloom Task Force,
St. John’s River Water Management District, Palatka, FL.
Windham, G. C., K. Waller, et al. (2003). Chlorination by-products in drinking water and
menstrual cycle function. Environmental Health Perspectives 111: 935–941.
Yang, C. Y., C. C. Chang, et al. (2003). Arsenic in drinking water and adverse pregnancy
outcome in an arseniasis-endemic area in northeastern Taiwan. Environmental
Research 91(1): 29–34.
Yu, S. Z. (1995). Primary prevention of hepatocellular carcinoma. Journal of Gastroenterology
and Hepatology 10(6): 674–682.
Zhang, Q. X., W. W. Carmichael, et al. (1991). Cyclic hepatotoxins from freshwater cyano-
bacterial (blue-green algae) waterblooms collected in central China. Environmental
Toxicology and Chemistry 10: 313–321.
Zhou, L., H. Yu, et al. (2002). Relationship between microcystin in drinking water and
colorectal cancer. Biomedical and Environmental Science 15: 166–171.
TF1713_C008.fm Page 165 Tuesday, October 26, 2004 1:43 PM
Copyright 2005 by CRC Press