Quantitative Methods and Applications in GIS - Chapter 3 pptx
Bạn đang xem bản rút gọn của tài liệu. Xem và tải ngay bản đầy đủ của tài liệu tại đây (1005.48 KB, 19 trang )
35
3
Spatial Smoothing and
Spatial Interpolation
This chapter covers two more generic tasks in GIS-based spatial analysis: spatial
smoothing and spatial interpolation. Spatial smoothing and spatial interpolation are
closely related and are both useful to visualize spatial patterns and highlight spatial
trends. Some methods (e.g., kernel estimation) can be used in either spatial smooth-
ing or interpolation. There are varieties of spatial smoothing and spatial interpolation
methods. This chapter only covers those most commonly used.
Conceptually similar to moving averages (e.g., smoothing over a longer time
interval),
spatial smoothing
computes the averages using a larger spatial window.
Section 3.1 discusses the concepts and methods for spatial smoothing, followed by
case study 3A using spatial smoothing methods to examine Tai place-names in
southern China in Section 3.2.
Spatial interpolation
uses known values at some
locations to estimate unknown values at other locations. Section 3.3 covers point-
based spatial interpolation, and Section 3.4 uses case study 3B to illustrate some
common point-based interpolation methods. Case study 3B uses the same data and
further extends the work in case study 3A. Section 3.5 discusses
area-based spatial
interpolation
, which estimates data for one set of (generally larger) areal units with
data for a different set of (generally smaller) areal units. Area-based interpolation
is useful for data aggregation and integration of data based on different areal units.
Section 3.6 presents case study 3C to illustrate two simple area-based interpolation
methods. The chapter is concluded with a brief summary in Section 3.7.
3.1 SPATIAL SMOOTHING
Like moving averages that are calculated over a longer time interval (e.g., 5-day
moving-average temperatures),
spatial smoothing
computes the value at a location
as the average of its nearby locations (defined in a spatial window) to reduce spatial
variability. Spatial smoothing is a useful method for many applications. One is to
address the
small numbers problem
, which will be explored in detail in Chapter 8.
The problem occurs for areas with small populations, where the rates of rare events
such as cancer or homicide are unreliable due to random error associated with small
numbers. The occurrence of one case can give rise to unusually high rates in some
areas, whereas the absence of cases leads to a zero rate in many areas. Another
application is for examining spatial patterns of point data by converting discrete
point data to a continuous density map, as illustrated in Section 3.2. This section
discusses two common spatial smoothing methods (floating catchment area method
and kernel estimation), and Appendix 3 introduces the
empirical Bayes estimation
.
2795_C003.fm Page 35 Friday, February 3, 2006 12:23 PM
© 2006 by Taylor & Francis Group, LLC
36
Quantitative Methods and Applications in GIS
3.1.1 F
LOATING
C
ATCHMENT
A
REA
M
ETHOD
The
floating catchment area
(FCA)
method
draws a circle or square around a location
to define a filtering window and uses the average value (or density of events) within
the window to represent the value at the location. The window moves across the
study area until averages at all locations are obtained. The average values have less
variability and are thus spatially smoothed values. The FCA method may be also
used for other purposes, such as accessibility measures (see Section 5.2).
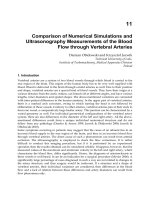
Figure 3.1 shows part of a study area with 72 grid-shaped tracts. The circle
around tract 53 defines the window containing 33 tracts (a tract is included if its
centroid falls within the circle), and therefore the average value of these 33 tracts
represents the spatially smoothed value for tract 53. The circle centers around each
tract centroid and moves across the whole study area until smoothed values for all
tracts are obtained. A circle of the same size around tract 56 includes another set of
33 tracts that defines a new window for tract 56. Note that windows near the borders
of a study area do not include as many tracts and cause a lesser degree of smoothing.
Such an effect is referred to as
edge effect
.
The choice of window size is very important and should be made carefully. A
larger window leads to stronger spatial smoothing, and thus better reveals regional
than local patterns; a smaller window generates reverse effects. One needs to exper-
iment with different sizes and choose one with balanced effects.
Implementing the FCA in ArcGIS is demonstrated in case study 3A in detail.
We first compute the distances (e.g., Euclidean distances) between all objects, and
then distances less than or equal to the threshold distance are extracted.
1
In ArcGIS,
we then summarize the extracted distance table by computing average values of
FIGURE 3.1
The FCA method for spatial smoothing.
94
93
83
82
92
91
81
71
61
51
41
31
21
11 12
22
32
42
52
62
72
73
13
23
33
43
53
63
84
74
64
54
44
34
24
14 15
25
16
26
36
35
45
55
65
75
85
95
96
97
98
88
87
86
77
76
78
68
67
66
58
57
56
46 4847
37
38
28
27
17
18
2795_C003.fm Page 36 Friday, February 3, 2006 12:23 PM
© 2006 by Taylor & Francis Group, LLC
Spatial Smoothing and Spatial Interpolation
37
attributes by origins. Since the table only contains distances within the threshold,
only those objects (destinations) within the window are included and form the
catchment area in the summarization operation. This eliminates the need of pro-
gramming that implements iterations of drawing a circle and searching for objects
within the circle.
3.1.2 K
ERNEL
E
STIMATION
The
kernel estimation
bears some resemblance to the FCA method. Both use a
filtering window to define neighboring objects. Within the window, the FCA method
does not differentiate far and nearby objects, whereas the kernel estimation weighs
nearby objects more than far ones. The method is particularly useful for analyzing
and displaying point data. The occurrences of events are shown as a map of scattered
(discrete) points, which may be difficult to interpret. The kernel estimation generates
a density of the events as a continuous field, and thus highlights the spatial pattern
as peaks and valleys. The method may also be used for spatial interpolation.
A kernel function looks like a bump centered at each point
x
i
and tapering off
to 0 over a bandwidth or window. See Figure 3.2 for illustration. The kernel density
at point
x
at the center of a grid cell is estimated to be the sum of bumps within
the bandwidth:
where
K
( ) is the kernel function,
h
is the bandwidth,
n
is the number of points
within the bandwidth, and
d
is the data dimensionality. Silverman (1986, p. 43)
provides some common kernel functions. For example, when
d
= 2, a commonly
used kernel function is defined as
where measures the deviation in
x-y
coordinates between points
(
x
i
,
y
i
) and (
x
,
y
).
FIGURE 3.2
Kernel estimation.
Kernel function
K( )
Data
point
Bandwidth
X
i
Grid
ˆ
() ( )fx
nh
K
xx
h
d
i
i
n
=
−
=
∑
1
1
ˆ
() [
()()
]fx
nh
xx yy
h
ii
i
n
=−
−+−
=
∑
1
1
2
22
2
2
1
π
()()xx yy
ii
−+−
22
2795_C003.fm Page 37 Friday, February 3, 2006 12:23 PM
© 2006 by Taylor & Francis Group, LLC
38
Quantitative Methods and Applications in GIS
Similar to the effect of window size in the FCA method, larger bandwidths tend
to highlight regional patterns and smaller bandwidths emphasize local patterns
(Fotheringham et al., 2000, p. 46).
ArcGIS has a built-in tool for kernel estimation. To access the tool, make sure
that the Spatial Analyst extension is turned on by going to the Tools from the main
manual bar and selecting Extensions. Click the Spatial Analyst dropdown arrow >
Density > choose Kernel for Density Type in the dialog.
3.2 CASE STUDY 3A: ANALYZING TAI PLACE-NAMES
IN SOUTHERN CHINA BY SPATIAL SMOOTHING
This case study examines the distribution pattern of Tai place-names in southern
China. The study is part of an ongoing larger project
2
dealing with the historical
origins of the Tai in southern China. The Sinification of ethnic minorities, such as
the Tai, has been a long and ongoing historical process in China. One indication of
historical changes is reflected in geographical place-names over time. Many older
Tai names can be recognized because they are named after geographical or other
physical features in Tai, such as “rice field,” “village,” “mouth of a river,” “mountain,”
etc. On the other hand, many other older Tai place-names have been obliterated or
modified in the process of Sinification. The objective of the larger project is to
reconstruct all the earlier Tai place-names in order to discover the original extent of
Tai settlement areas in southern China before the Han pushed south. This case study
is chosen to demonstrate the use of GIS technology in historical-linguistic-cultural
studies, a field whose scholars are less exposed to it.
We selected Qinzhou Prefecture in Guangxi Autonomous Region, China, as the
study area (see the inset in Figure 3.3). Mapping is important for examining spatial
patterns, but direct mapping of Tai place-names may not be very informative.
Figure 3.3 shows the distribution of Tai and non-Tai place-names, from which we
can vaguely see areas with more representations of Tai place-names and others with
less. The spatial smoothing techniques help visualize the spatial pattern.
The following datasets are provided in the CD for the project:
1. Point coverage
qztai
for all towns in Qinzhou, with the item
TAI
identifying whether a place-name is Tai (= 1) or non-Tai (= 0).
2. Shapefile
qzcnty
defines the study area of six counties.
3.2.1 P
ART
1: S
PATIAL
S
MOOTHING
BY
THE
F
LOATING
C
ATCHMENT
A
REA
M
ETHOD
We first test the floating catchment area method. Different window sizes are used
to help identify an appropriate window size for an adequate degree of smoothing to
highlight general trends but not to block local variability. Within the window around
each place, the ratio of Tai place-names among all place-names is computed to
represent the concentration of Tai place-names
around
that place. In implementation,
the key step is to utilize a distance matrix between any two places and extract the
places that are within a specified search radius from each place.
2795_C003.fm Page 38 Friday, February 3, 2006 12:23 PM
© 2006 by Taylor & Francis Group, LLC
Spatial Smoothing and Spatial Interpolation
39
1.
Computing distance matrix between places
: Refer to Section 2.3.1 for
measuring the Euclidean distances. In ArcToolbox, choose Analysis Tools
> Proximity > Point Distance. Enter
qztai
(point) as both the Input
Features and the Near Features and name the output table
Dist_50km.dbf
. By defining a wide search radius of 50 km, the distance
table allows us to experiment with various window sizes
≤
50 km. In the
distance file
Dist_50km.dbf
, the
INPUT_FID
identifies the “from”
(origin) place, and the
NEAR_FID
identifies the “to” (destination) place.
2.
Attaching attributes of Tai place-names to distance matrix
: Join the attribute
table of
qztai
to the distance table
Dist_50km.dbf
based on the
common keys
FID
in
qztai
and
NEAR_FID
in
Dist_50km.dbf
. By
doing so, each destination place is identified as either a Tai place or non-
Tai place by the field
point:Tai
.
3.
Extracting distance matrix within a window
: For example, we define the
window size with a radius of 10 km. Open the table
Dist_50km.dbf
> click the tab Options at the right bottom > Select By Attributes > enter
the condition
Dist_50km.DISTANCE
<=10000
. For each origin
place, only those destination places within 10 km are selected. Click
Options > Export, and save the new table as
Dist_10km.dbf
, which
keeps only distances of 10 km. Those records with a distance = 0 (i.e., the
origin and destination places are the same) indicate that the search circles
are centered around these places.
FIGURE 3.3
Tai and non-Tai place-names in Qinzhou.
Non-Tai
Tai
County
025507510012.5
Kilometers
Guangxi
Qinzhou
N
2795_C003.fm Page 39 Friday, February 3, 2006 12:23 PM
© 2006 by Taylor & Francis Group, LLC
40
Quantitative Methods and Applications in GIS
4.
Calculating Tai place ratios within the window
: On the opened table
Dist_10km.dbf
, right-click the field
INPUT_FID
and choose Summa-
rize > note that
INPUT_FID
appears in the first box (field to summarize),
check the field
TAI
(Sum) in the second box (summary statistics), and name
the output table
Sum_10km.dbf
. In
Sum_10km.dbf
, the field
Sum_TAI
indicates the number of Tai place-names within a 10-km radius and the field
Count_INPUT_FID
indicates the total number of place-names within the
same range. Add a new field
Tairatio
to the table
Sum_10km.dbf
and
calculate it as
Tairatio
= Sum_TAI / Cnt_INPUT_. Note that
Cnt_INPUT_ is the abbreviated field name for Count_INPUT_FID. This
ratio measures the portion of Tai place-names among all places within the
window that is centered at each place.
5. Attaching Tai place-name ratios to the point coverage: Join the table
Sum_10km.dbf to the attribute table qztai based on the common keys
INPUT_FID in Sum_10km.dbf and FID in qztai.
6. Mapping Tai place-name ratios: Use proportional point symbols to map
Tai place-name ratios (each representing the ratio within a 10-km radius
around a place) across the study area, as shown in Figure 3.4.
This completes the FCA method for spatial smoothing, which converts a
binary variable TAI to a continuous ratio variable Tairatio.
7. Sensitivity analysis: Experiment with other window sizes, such as 5 and
15 km, and repeat steps 3 to 6. Compare the results with Figure 3.4 to
examine the impact of window size. Table 3.1 summarizes the results. As
the window size increases, the standard deviation of Tai place-name ratio
declines, indicating stronger spatial smoothing.
FIGURE 3.4 Tai place-name ratios in Qinzhou by the FCA method.
N
County
100 12.5
Kilometers
Tai place-name ratio
0.1
0.25
0.5
0.75
1
0 25 50 75
2795_C003.fm Page 40 Friday, February 3, 2006 12:23 PM
© 2006 by Taylor & Francis Group, LLC
Spatial Smoothing and Spatial Interpolation 41
3.2.2 PART 2: SPATIAL SMOOTHING BY KERNEL ESTIMATION
1. Execute kernel estimation: In ArcMap, make sure that the Spatial Analyst
extension is turned on: from the Tools menu > choose Extensions > check
Spatial Analyst, and from the View menu > choose Toolbars > check
Spatial Analyst. Click the Spatial Analyst dropdown arrow > choose
Density to activate the dialog window. In the dialog, make sure that
qztai (point) is the Input data, select TAI for the Population field,
choose kernel as Density type, use 10,000 (meters) for Search radius,
square kilometers for Area units, and 1000 (meters) for Output cell size,
and name the output raster kernel_10k.
2. Mapping kernel density: By default, estimated kernel densities are cate-
gorized into nine classes, displayed as different hues. Figure 3.5 is based
TABLE 3.1
FCA Spatial Smoothing by Different Window Sizes
Window Size (Radius) (km)
Ratio of Tai Place-Names
Min. Max. Mean Std. Dev.
5 0 1.0 0.1868 0.3005
10 0 1.0 0.1886 0.1986
15 0 0.8333 0.1878 0.1642
FIGURE 3.5 Kernel density of Tai place-names in Qinzhou.
Place-names
Tai
Kernel density
0–0.0067
0.0067–0.0133
0.0133–0.0200
0.0200–0.0266
0.0266–0.0333
0 25 50 75 100 12.5
Kilometers
Non-Tai
County
N
2795_C003.fm Page 41 Friday, February 3, 2006 12:23 PM
© 2006 by Taylor & Francis Group, LLC
42 Quantitative Methods and Applications in GIS
on reclassified kernel densities (five classes) with county boundaries as
the background.
The kernel density map shows the distribution of Tai place-names as a
continuous surface so that patterns like peaks and valleys can be identified.
However, the density values simply indicate relative degrees of concentra-
tion and cannot be interpreted as a meaningful ratio like Tairatio in the
FCA method.
3.3 POINT-BASED SPATIAL INTERPOLATION
Point-based spatial interpolation includes global and local methods. A global inter-
polation utilizes all points with known values (control points) to estimate an unknown
value. A local interpolation uses a sample of control points to estimate an unknown
value. As Tobler’s (1970) first law of geography states, “everything is related to
everything else, but near things are more related than distant things.” The choice of
global vs. local interpolation depends on whether faraway control points are believed
to have influence on the unknown values to be estimated. There are no clear-cut rules
for choosing one over the other. One may consider the scale from global to local as
a continuum. A local method may be chosen if the values are most influenced by
control points in a neighborhood. A local interpolation also requires less computation
than a global interpolation (Chang, 2004, p. 277). One may use validation techniques
to compare different models. For example, the control points can be divided into two
samples: one sample is used for developing the models, and the other sample is used
for testing the accuracy of the models. This section surveys two global interpolation
methods briefly and focuses on three local interpolation methods.
3.3.1 GLOBAL INTERPOLATION METHODS
Global interpolation methods include trend surface analysis and regression model.
Trend surface analysis uses a polynomial equation of x-y coordinates to approximate
points with known values such as
where the attribute value z is considered as a function of x and y coordinates (Bailey
and Gatrell, 1995). For example, a cubic trend surface model is written as
The equation is usually estimated by an ordinary least squares regression. The
estimated equation is then used to project unknown values at other points.
Higher-order models are needed to capture more complex surfaces and yield
higher R-square values (goodness of fit) or lower root mean square (RMS) in
general.
3
However, a better fit for the control points is not necessarily a better model
for estimating unknown values. Validation is needed to compare different models.
zfxy= (,)
zxy b bx by bx bxy by bx bxy(,)=+ + + + + + +
01 2 3
2
45
2
6
3
7
2
+++bxy by
8
2
9
3
2795_C003.fm Page 42 Friday, February 3, 2006 12:23 PM
© 2006 by Taylor & Francis Group, LLC
Spatial Smoothing and Spatial Interpolation 43
If the dependent variable (i.e., the attribute to be estimated) is binary (i.e., 0 and 1),
the model is a logistic trend surface model that generates a probability surface. A
local version of trend surface analysis uses a sample of control points to estimate
the unknown value at a location and is referred to as local polynomial interpolation.
ArcGIS offers up to 12th-order trend surface model. To access the method, make
sure that the Geostatistical Analyst extension is turned on. In ArcMap, click the
Geostatistical Analyst dropdown arrow > Explore Data > Trend Analysis.
A regression model uses a linear regression to find the equation that models a
dependent variable based on several independent variables, and then uses the equa-
tion to estimate unknown points (Flowerdew and Green, 1992). Regression models
can incorporate both spatial (not limited to x-y coordinates) and attribute variables
in the models, whereas trend surface analysis only uses x-y coordinates as predictors.
3.3.2 LOCAL INTERPOLATION METHODS
The following discusses three popular local interpolators: inverse distance weighted,
thin-plate splines, and kriging.
The inverse distance weighted (IDW) method estimates an unknown value as
the weighted average of its surrounding points, in which the weight is the inverse
of distance raised to a power (Chang, 2004, p. 282). Therefore, the IDW enforces
Tobler’s first law of geography. The IDW is expressed as
where z
u
is the unknown value to be estimated at u, z
i
is the attribute value at control
point i, d
iu
is the distance between points i and u, s is the number of control points
used in estimation, and k is the power. The higher the power, the stronger (faster)
the effect of distance decay is (i.e., nearby points are weighted much higher than
remote ones). In other words, distance raised to a higher power implies stronger
localized effects.
Thin-plate splines create a surface that predicts the values exactly at all control
points and has the least change in slope at all points (Franke, 1982). The surface is
expressed as
where x and y are the coordinates of the point to be interpolated,
is the distance from the control point (x
i
, y
i
), and A
i
, a,
z
zd
d
u
iiu
k
i
s
iu
k
i
s
=
−
=
−
=
∑
∑
1
1
zxy Ad d a bx cy
ii i
i
n
(,) ln=+++
=
∑
2
1
dxxyy
iii
=−+−()()
22
2795_C003.fm Page 43 Friday, February 3, 2006 12:23 PM
© 2006 by Taylor & Francis Group, LLC
44 Quantitative Methods and Applications in GIS
b, and c are the n + 3 parameters to be estimated. These parameters are estimated
by solving a system of n + 3 linear equations (see Chapter 11), such as
; ; and
Note that the first equation above represents n equations for i = 1, 2, …, n, and z
i
is the known attribute value at point i.
Thin-plate splines tend to generate steep gradients (overshoots) in data-poor
areas, and other methods such as thin-plate splines with tension, regularized splines,
and regularized splines with tension have been proposed to mitigate the problem
(see Chang, 2004, p. 285). These advanced interpolation methods are grouped as
radial basis functions.
Kriging (Krige, 1966) models the spatial variation as three components: a spa-
tially correlated component, representing the regionalized variable; a “drift” or
structure, representing the trend; and a random error. To measure spatial autocorre-
lation, kriging uses the measure of semivariance (1/2 of variance):
where n is the number of pairs of the control points that are distance (or spatial lag)
h apart and z is the attribute value. In the presence of spatial dependence, γ(h) increases
as h increases, i.e., nearby objects are more similar than remote ones. A semivariogram
is a plot showing how the values of γ(h) respond to the change of distances h.
Kriging fits the semivariogram with a mathematical function or model and uses
it to estimate the semivariance at any given distance, which is then used to compute
a set of spatial weights. The effect of using the spatial weights is similar to that in
the IDW method, i.e., nearby control points are weighted more than distant ones.
For instance, if the spatial weight for each control point i and a point s (to be
interpolated) is W
is
, the interpolated value at s is
where n
s
is the number of sampled points around the point s, and z
s
and z
i
are the
attribute values at s and i, respectively. Similar to the kernel estimation, kriging can
be used to generate a continuous field from point data.
In ArcGIS, all three local interpolation methods are available in the Geostatistical
Analyst extension. In ArcMap, click the Geostatistical Analyst dropdown arrow >
A d d a bx cy z
ii i i i i
i
n
2
1
ln ;++ + =
=
∑
A
i
i
n
=
∑
=
1
0 Ax
ii
i
n
=
∑
=
1
0
Ay
ii
i
n
=
∑
=
1
0
γ() [( ) ( )]h
n
zx zx h
ii
i
n
=−+
=
∑
1
2
2
1
zWz
sisi
i
n
s
=
=
∑
1
2795_C003.fm Page 44 Friday, February 3, 2006 12:23 PM
© 2006 by Taylor & Francis Group, LLC
Spatial Smoothing and Spatial Interpolation 45
Geostatistical Wizard > choose Inverse Distance Weighting, Radial Basis Functions,
or Kriging in the Methods frame to invoke the IDW method, various thin-plate spline
methods, or kriging methods, respectively. The three local interpolators are also
available through Spatial Analyst or 3D Analyst. The Geostatistical Analyst is rec-
ommended, as it offers more information and better interface (Chang, 2004, p. 298).
3.4 CASE STUDY 3B: SURFACE MODELING AND MAPPING
OF TAI PLACE-NAMES IN SOUTHERN CHINA
This project continues case study 3A by mapping the spatial concentrations of Tai
place-names in Qinzhou, China, with various surface modeling techniques. No new
datasets are needed for the project. We will utilize the results generated in case study
3A, Part 1, in particular the Tai place-name ratios computed by the FCA method.
3.4.1 PART 1: SURFACE MAPPING BY TREND SURFACE ANALYSIS
1. Activating the Geostatistical Wizard dialog: If you have exited from
ArcMap without saving the project after case study 3A, repeat step 5 in
Section 3.2.1: join the table Sum_10km.dbf to the attribute table of
qztai. In ArcMap, make sure that both Geostatistical Analyst and Spatial
Analyst extensions are turned on. Click the Geostatistical Analyst drop-
down arrow > choose Geostatistical Wizard to activate the dialog window.
2. Using trend surface analysis to generate the surface: In the dialog, choose
qztai for Input Data, Sum_10km.Tairatio for Attribute, and Global
Polynomial Interpolation for Methods. In the next dialog, experiment with
different powers (e.g., 1, 3, 5, 8, and 10) and review the surfaces and corre-
sponding RMS values. As the power increases, the surface captures more
local patterns and yields a smaller RMS. Here we set the power to 10 with
RMS = 0.1124, and the surface Global Polynomial Interpolation
Prediction Map is automatically added to the layers.
3. Mapping surface for the study area: Right-click the surface and choose
Data > Export to Raster. Name the output raster trend10. Click the
Spatial Analyst dropdown arrow > choose Options > select qzcnty for
Analysis mask. Click the Spatial Analyst dropdown arrow again > choose
Raster Calculator > double-click trend10 under Layers to select, and
click Evaluate. The resulting raster Calculation is the surface for the
study area.
Right-click Calculation and choose Properties to improve the map
(e.g., under Display, define 30% transparency; under Symbology, redefine
the default symbols). Figure 3.6 shows the trend surface map of Tai place-
name ratios. The map displays patterns similar to Figure 3.5 by kernel
estimation, but highlights more global than local trends. It clearly shows
the highest concentration of Tai place-names in the southwest corner
stretching toward northeast and other directions. Note that some interpo-
lated values by the trend surface analysis, such as negative values or values
higher than 1.00, are unrealistic.
2795_C003.fm Page 45 Friday, February 3, 2006 12:23 PM
© 2006 by Taylor & Francis Group, LLC
46 Quantitative Methods and Applications in GIS
4. Optional: Logistic trend surface analysis: ArcGIS can also generate a
surface directly based on the original binomial (0–1) variable Tai. In the
dialog window in step 2, choose point:Tai for Attribute and others
the same as in step 2; repeat the analysis. The result is a probability surface
(i.e., the probability of a place being a Tai place-name) generated by
logistic trend surface analysis.
3.4.2 PART 2: MAPPING BY LOCAL INTERPOLATION METHODS
1. Using IDW to map surface: Similar to step 1 in Part 1, activate the
Geostatistical Wizard dialog. Choose qztai for Input Data,
Sum_10km.Tairatio for Attribute, and Inverse Distance Weighting
for Methods. Use the default power of 2, 15 neighboring points, and a
circular area for selecting control points. Note that RMS = 0.0844. Export
the surface to a raster named idw2. Similar to step 3 in Part 1, generate
a surface for the study area as shown in Figure 3.7. Note that all interpo-
lated values are within the same range as the original, i.e., between 0
and 1. Figure 3.7 shows stronger local patterns than Figure 3.6.
2. Using thin-plate splines to map surface: Similarly, in the Geostatistical
Wizard dialog window, choose Radial Basis Functions for Methods, and
others the same. Use the default method Completely Regularized Spline
and other default settings to generate the surface. Name the raster
regspline. A map based on the surface is slightly different from
Figure 3.7 and not shown here.
FIGURE 3.6 Interpolated Tai place-name ratios in Qinzhou by trend surface analysis.
Place-names
Tai
County
0 25 50 75 100 12.5
Kilometers
Tai place-name ratio
–4.35–1.59
–1.59–0.28
–0.28–0.17
0.17–0.44
0.44–1.08
Non-Tai
N
2795_C003.fm Page 46 Friday, February 3, 2006 12:23 PM
© 2006 by Taylor & Francis Group, LLC
Spatial Smoothing and Spatial Interpolation 47
3. Using kriging to map surface: Similarly, in the Geostatistical Wizard
dialog window, choose Kriging for Methods, and others the same. Use
the default method Ordinary Kriging Prediction Map and other default
settings to generate the surface. Name the raster ordkrig. A similar
map is generated and not shown here.
3.5 AREA-BASED SPATIAL INTERPOLATION
Area-based (areal) interpolation is also referred to as cross-area aggregation, which
transforms data from one system of areal units (source zones) to another (target
zones). A point-based method such as kriging or polynomial trend surface analysis
can be also used to interpolate a grid surface, and then the values of grid cells are
converted to the value for each target zone. In other words, areal units are assumed
to be represented by their centroids, and then a point-based method is used to
interpolate attributes in areal units as approximation.
Many other methods have been developed for areal interpolation (Goodchild et
al., 1993). The simplest and most widely used is areal weighting interpolator
(Goodchild and Lam, 1980). The method apportions the attribute value from each
source zone to target zones according to the areal proportion. The method assumes
that the attribute value is evenly distributed within each of the source zones.
More advanced methods may be used to improve interpolation if additional
information for the study area is available and utilized. The following discusses a
FIGURE 3.7 Interpolated Tai place-name ratios in Qinzhou by the IDW method.
Place-names
Tai
County
0 25 50 75 100 12.5
Kilometers
Tai place-name ratio
0–0.09
0.09–0.23
0.23–0.39
0.39–0.58
0.58–1.00
Non-Tai
N
2795_C003.fm Page 47 Friday, February 3, 2006 12:23 PM
© 2006 by Taylor & Francis Group, LLC
48 Quantitative Methods and Applications in GIS
method that is particularly useful for interpolating census data in the U.S. Utilizing
the road network information revealed in the U.S. Census Bureau’s TIGER files,
Xie (1995; also see Batty and Xie, 1994a, 1994b) developed some network-overlaid
algorithms to project population or other residents-based attributes from one areal
unit to another. Residential houses are usually located along the sides of streets or
along roads. As a result, the distribution of population is closely related to the street
network. Among the three algorithms (network length, network hierarchical weight-
ing, and network house-bearing methods), the network hierarchical weighting
(NHW) method yields the most promising results.
The critical component of the NHW method is a series of GIS overlaying
operations. We take one example to illustrate the method. Researchers on urban
issues often use the Census Transportation Planning Package (CTPP) data
4
to analyze
land use and transportation issues. For the 1990 CTPP Urban Element data, most
regions are aggregated at the traffic analysis zone (TAZ) level.
5
For various reasons
(e.g., merging with other census data), it may be desirable to interpolate the CTPP
data from TAZs to census tracts. In this case, TAZs are the source zones and census
tracts are the target zones. The following five steps implement the task:
1. Overlay the TAZ layer with the census tract layer to create an intersected
TAZ–tract (polygon) layer, and overlay the TAZ–tract layer with the road
network layer to create a control–net (line) layer.
2. Construct a weight matrix for different road categories, as population or
business densities vary along various road classes.
3. Overlay the TAZ layer with the network layer, compute the lengths of
various roads and then the weighted length within each TAZ, and allocate
population or other attributes to the network.
4. Attach the result from step 3 (population or other attributes) to the con-
trol–net layer, and sum up the attributes within each polygon based on
the TAZ–tract layer.
5. Sum up attributes by census tracts to get the interpolated attributes within
each census tract.
3.6 CASE STUDY 3C: AGGREGATING DATA FROM CENSUS
TRACTS TO NEIGHBORHOODS AND SCHOOL DISTRICTS
IN CLEVELAND, OHIO
This case study demonstrates two commonly used methods for area-based data
aggregation. The first one is not an interpolation method per se, but simply aggregates
data from one areal unit to another when multiple source zones are fully included
in each target zone (or assumed to be so for approximation). The second method is
the areal weighting interpolator. Part 1 illustrates the first method by aggregating
census tracts to neighborhoods in Cleveland, as each neighborhood contains multiple
complete census tracts. Part 2 illustrates the second method by aggregating census
tracts to school districts in Cuyahoga County, where the boundaries of school districts
do not match those of census tracts. We use population as an exemplary attribute to
demonstrate the interpolation methods.
2795_C003.fm Page 48 Friday, February 3, 2006 12:23 PM
© 2006 by Taylor & Francis Group, LLC
Spatial Smoothing and Spatial Interpolation 49
Data needed for the project are provided in the CD:
1. Shapefile clevspa2k for the 36 neighborhoods (statistical planning
areas, or SPAs) in Cleveland
2. Shapefile tgr39035uni for unified school districts in Cuyahoga County
3. Shapefiles cuyautm and cuya_pt for census tracts in Cuyahoga
County and corresponding centroids
The school district file is downloaded from the Environmental Systems Research
Institute, Inc. (ESRI) data website (see case study 1A, step 1). Datasets 3 are
generated from case study 1A and 1B.
3.6.1 PART 1: SIMPLE AGGREGATION FROM CENSUS TRACTS TO
N
EIGHBORHOODS IN THE CITY OF CLEVELAND
Simple aggregation uses a spatial join to transfer data from source zone to target
zone, and the implementation is straightforward.
In ArcMap, open the attribute table of cuyautm; note that it only contains the
field popuden, not population. Since attribute joins are temporary, the added fields
area and popuden are retained, but fields from the joined table are lost after
exiting the project (case study 1A). Retrieve the field POP2000 either by joining
the table tgr39035trt00.dbf again or by adding a field POP2000 and calcu-
lating it as POP2000 = area * popuden / 1000000. Repeat the same on the
centroid shapefile cuya_pt.
Right-click the destination layer clevspa2k and choose Joins and Relates
> Join. In the dialog, choose the option “Join data from another layer based on
spatial location,” select cuya_pt as the source layer and the summarized join
option (which states “Each polygon will be given a summary of the numerical
attributes of the points that fall inside it …”), check the box next to Sum, and
name the output shapefile spa_pop. Selecting cuyautm as the source layer
may also work as a polygon-to-polygon join. The safe choice is the point-to-
polygon join used here. The field sum_pop2000 in the attribute table of
spa_pop is the aggregated population at the neighborhood level (other fields
may be deleted).
3.6.2 PART 2: AREAL WEIGHTING AGGREGATION FROM CENSUS
T
RACTS TO SCHOOL DISTRICTS IN CUYAHOGA COUNTY
1. Preparing the school district layer: In ArcToolbox, use Data Management
Tools > Projections and Transformations > Feature > Project to transform
the shapefile tgr39035uni in the geographic coordinate system to a
shapefile cuyauni in the Universal Transverse Mercator (UTM) coor-
dinate system by importing the projection file defined in cuyautm. Add
a new variable area to the attribute table of cuyauni and update it
(see Section 1.2, step 3).
2795_C003.fm Page 49 Friday, February 3, 2006 12:23 PM
© 2006 by Taylor & Francis Group, LLC
50 Quantitative Methods and Applications in GIS
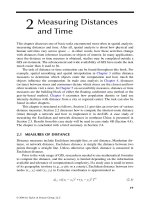
2. Overlaying census tract and school district layers: In ArcToolbox, use
Analysis Tools > Overlay > Intersect > select cuyautm first for Input
Features, and then add cuyauni also as Input Features, and name the
output layer tmp_int. In the attribute table of tmp_int, the field area
is the area size of each census tract from cuyautm, and the field area_1
is the area size of each school district from cuyauni. Figure 3.8 uses
the lower-right corner of the study area to illustrate the intersecting
FIGURE 3.8 Areal weighting interpolation from census tracts to school districts.
Census tracts
Intersect
School districts
193900
188105
188106
188107
194900
133104
133103
133105
184104
132200
133106
194000
195100
184105
184106
184108
184107
195300
184103
195500
195200
195400
10017
04660
04528
10016
04500
193900
04500
188105
188105
188107
194900
133104
133103
133105
10017
132200
133106
194000
195100
184105
184108
184106
04660
184104
B
A
184103
184107
195300
195500
04528
195200
195400
10016
2795_C003.fm Page 50 Friday, February 3, 2006 12:23 PM
© 2006 by Taylor & Francis Group, LLC
Spatial Smoothing and Spatial Interpolation 51
process. Note that tract 184104 is split into two pieces: polygon A belongs
to school district 10016, and B belongs to school district 04660.
3. Apportioning the attribute to area size: Add a variable area_2 to the
attribute table of tmp_int and update it as the area size of the newly
intersected shapefile. Add another field, popu_est, to the attribute table
of tmp_int and compute it as popu_est = pop2000*area_2/area.
This is the interpolated population for each polygon in the intersected layer
by the areal weighting method.
6
For example, the population in polygon A
is equal to the population in tract 184104 multiplied by the area size of
polygon A divided by the area size of tract 184104, i.e., 1468*1297600/
16810900 = 113.
4. Aggregating data to school districts: On the attribute table of tmp_int,
right-click the field unified (school district codes) and choose Sum-
marize > select popu_est (sum) in the second box, and name the output
table uni_pop.dbf. The interpolated population for school districts is
contained in the field sum_popu_e in uni_pop.dbf, which may be
joined to the layer cuyauni for mapping or other purposes.
3.7 SUMMARY
Skills learned in this chapter include:
1. Implementing the FCA method for spatial smoothing
2. Kernel density estimation for mapping point data
3. Trend surface analysis (including logistic trend surface analysis)
4. Local interpolation methods, such as inverse distance weighting, thin-plate
splines, and kriging
5. Simple aggregation if multiple source zones are wholly contained in each
target zone
6. Areal weighting aggregation if boundaries of source zones do not exactly
match those of target zones
Spatial smoothing and spatial interpolation are often used for mapping spatial
patterns, like case study 3A and B on Tai place-names in southern China. The
techniques are useful in many point-based applications. For example, in case study
4A on defining trade areas for professional sports teams, a simple spatial interpola-
tion method is used to generate a surface map showing the probabilities of residents
choosing one club over the other (see Figure 4.4). However, surface mapping is
merely descriptive. Identified spatial patterns such as concentrations or lack of
concentrations can be arbitrary. Where are concentrations statistically significant
instead of random? The answer relies on rigorous statistical analysis, for example,
spatial cluster analysis — a topic to be covered in Chapter 9 (case study 9A uses
the same dataset to identify spatial clusters of Tai place-names).
Area-based spatial interpolation is often used to convert data from different
sources to one areal unit for an integrated analysis. It is also used to convert data
from a finer to a coarser resolution for examining the modifiable areal unit problem
2795_C003.fm Page 51 Friday, February 3, 2006 12:23 PM
© 2006 by Taylor & Francis Group, LLC
52 Quantitative Methods and Applications in GIS
(MAUP). For example, in case study 6 on urban density functions, the technique is
used to aggregate data from census tracts to townships so that functions based on
different areal units can be compared.
APPENDIX 3: EMPIRICAL BAYES (EB) ESTIMATION FOR
SPATIAL SMOOTHING
Empirical Bayes (EB) estimation is another commonly used method for adjusting
or smoothing variables (particularly rates) across areas (e.g., Clayton and Kaldor,
1987; Cressie, 1992). Based on the fact that the joint probability of two events is
the product of one event and the probability of the second event conditionally upon
the first event, Bayesian inference may be expressed as the inclusion of prior
information or belief about a dataset in estimating the probability distribution of the
data (Langford, 1994, p. 143), i.e.,
likelihood function × prior belief = posterior belief
Using a disease risk as an example, the likelihood function can be said to be
the Poisson distributed numbers of observed cases across a study area. The prior
belief is on the distribution of relative risks (rates) conditional on the distribution
of observed cases: for example, relative risks in areas of larger population size are
likely to be more reliable than those in areas of smaller population size. In summary,
(1) the mean rate in the study area is assumed to be reliable and unbiased; (2) rates
for large population are adjusted less than rates for small population; and (3) rates
follow a known probability distribution.
Assume that a common distribution, gamma, is used to describe the prior dis-
tribution of rates. The gamma distribution has two parameters, the shape parameter α
and the scale parameter ν, with the mean = ν/α and the variance = ν/α
2
. The two
parameters α and ν can be estimated by a mixed maximum likelihood and moments
procedure discussed in Marshall (1991). For an area i with population P
i
and k
i
cases
of disease, the crude incidence rate for the area is k
i
/P
i
. It can be shown that the
posterior expected rate or empirical Bayes estimate is
If area i has a small population size, the values of k
i
and P
i
are small relative
to ν and α, and the EB estimate E
i
will be “shrunken” toward the overall mean ν/α.
Conversely, if area i has a large population size, the values of k
i
and P
i
are large
relative to ν and α, and the EB estimate E
i
will be very close to the crude rate k
i
/P
i
.
Compared to the crude rate k
i
/P
i
, the EB estimate E
i
is smoothed by the inclusion
of ν and α.
EB estimation can be applied to a whole study area where all rates are smoothed
toward the overall rate. This is referred to as global empirical Bayes smoothing. It
can also be applied locally by defining a neighborhood around each area and
E
k
P
i
i
i
=
+
+
ν
α
2795_C003.fm Page 52 Friday, February 3, 2006 12:23 PM
© 2006 by Taylor & Francis Group, LLC
Spatial Smoothing and Spatial Interpolation 53
smoothing the rate toward its neighborhood rate. The process is referred to as
regionalized empirical Bayes smoothing. A neighborhood for an area can be defined
as all its contiguous areas plus itself. Contiguity may be defined as rook contiguity
or queen contiguity (see Section 1.4), first-order or second-order contiguity, and
so on.
GeoDa, a free package developed by Luc Anselin and his colleagues (http://
sal.agecon.uiuc.edu/geoda_main.php), can be used to implement the EB estimation
for spatial smoothing. The tools are available in GeoDa 0.9.5-i by choosing Map >
Smooth > Empirical Bayes (or Spatial Empirical Bayes). The
Empirical Bayes procedure smoothes the rates toward the overall mean in the
whole study area, and thus is global EB smoothing. The Spatial Empirical
Bayes procedure smoothes the rates toward a spatial window around an area
(defined as the area and its neighboring areas based on a spatial weights file), and
thus is local EB smoothing.
NOTES
1. One may use the threshold distance to set the search radius in distance computation
and directly obtain the distances within the threshold. However, a table for distances
between all objects gives us the flexibility of experimenting with various window sizes.
2. Collaborators of the project also include John Hartmann and Wei Luo of Northern
Illinois University and Jerold Edmondson of the University of Texas at Arlington.
3. RMS is measured as .
4. For the 1990 CTPP, visit />planning_package_1990. For the 2000 CTPP, visit />5. For example, among the 303 CTPP Urban Element regions in 1990, 265 regions are
summaries for TAZs, 13 for census tracts, and 25 for block groups (based on the file
Regncode.asc distributed by the Bureau of Transportation Statistics and summarized
by the author).
6. For validation, add a field popu_valid and calculate it as popu_valid =
popuden*area_2 /1000000, which should be identical to popu_est. The
areal weighting method assumes that population is distributed uniformly within each
census tract, and thus a polygon in the intersected layer resumes the population density
of the tract, of which the polygon is a component.
RMS z z n
i obs i est
i
n
=−
=
∑
()/
,,
2
1
2795_C003.fm Page 53 Friday, February 3, 2006 12:23 PM
© 2006 by Taylor & Francis Group, LLC