Vibration Fundamentals 1 2010 Part 5 potx
Bạn đang xem bản rút gọn của tài liệu. Xem và tải ngay bản đầy đủ của tài liệu tại đây (1.62 MB, 30 trang )
08.Mobley.13 Page 114 Thursday, February 4, 1999 3:10 PM
114 Vibration Fundamentals
should be in a plane opposing the side load created by the belts on the inboard and
outboard bearings. The secondary point should be at 90 degrees to the primary point.
At least one axial measurement point should be located on each compressor shaft.
Axial data are helpful in identifying and quantifying thrust (i.e., induced) loads cre-
ated by both the process and any potential compressor-element problems, such as
imbalance, cracked blade, etc.
In applications where numerous compressors are in proximity, an additional measure-
ment point on the base is useful for identifying structural resonance or cross-talk
between the units.
Centrifugal
The two major types of centrifugal compressors used in industrial applications are in-
line and bullgear compressors.
In-Line Centrifugal Compressors
Measurement locations for in-line centrifugal compressors should be based on the
same logic as discussed for pumps. Impeller design and orientation, as well as the
inlet and discharge configurations, are the dominant reasons for point location. (Fig-
ure 11.5 illustrates a typical multistage, in-line compressor.)
The in-line impeller configuration generates high axial thrusting, which increases the
importance of the axial (Z-axis) measurement point. That point should be on the fixed
bearing and oriented toward the driver.
In addition, this type of compressor tends to have both the suction and discharge ports
on the same side of the compressor’s housing. As a result, there is a potential for aero-
dynamic instability within the compressor. Orientation of the primary (X-axis) radial
measurement point should be opposite the discharge port and oriented toward the dis-
charge. The secondary (Y-axis) radial point should be in the direction of shaft rotation
and 90 degrees from the primary radial point.
Bullgear Compressors
Because of the large number of these machines being manufactured, proper locations
for displacement, or proximity, probes have been established by the various machine
manufacturers. Nearly all of these compressors are supplied by the original equipment
manufacturer (OEM) with one or two proximity probes already mounted on each pin-
ion shaft and, sometimes, one probe on the bullgear shaft. These probes can be used to
obtain vibration data with the microprocessor-based portable analyzers. However,
they must be augmented with casing measurements acquired from suitable acceler-
ometers. This is necessary because there are two problems with the proximity data.
First, most of the OEM-supplied data-acquisition systems perform signal condition-
ing on the raw data acquired from the probes. If the conditioned signal is used, there is
08.Mobley.13 Page 115 Thursday, February 4, 1999 3:10 PM
115 Vibration Data Acquisition
a bias in the recorded amplitude. This bias may increase the raw-data signal by 30 to
50%. If data from the proximity probes are to be used, it is better to acquire it before
signal conditioning. This can be accomplished by tapping into the wiring between the
probe and display panel.
The second problem is data accuracy. The pinions on most bullgear compressors
rotate at speeds between 20,000 and 75,000 rpm. While these speeds, for the most
part, are within the useful range of a proximity probe (600 to 60,000 rpm), the fre-
quencies generated by common components (i.e., tilting-pad bearings and impeller
vane-pass) are well outside this range. In addition, proximity probes depend on a
good sight picture, which means a polished shaft that has no endplay or axial move-
ment. Neither of these conditions is present in a bullgear compressor.
Primary (X-axis) and secondary (Y-axis) radial measurements should be acquired
from both bearings on the bullgear shaft. If the shaft has Babbitt bearings, it is a good
practice to periodically acquire four radial readings, one at each quadrant of the bear-
ing, to determine the load zones of the bearing. Normal vertical and horizontal loca-
tions are acceptable for the routine readings, but primary (X-axis) measurement points
should be in the horizontal plane (i.e., 90 degrees from vertical in the direction of
rotation). For clockwise rotation, the primary should be on the right side and for coun-
terclockwise on the left.
Because a bullgear compressor incorporates a large helical gear, the shaft displays
moderate to high axial thrusting. Therefore, an axial (Z-axis) measurement point
should be acquired from the thrust (outboard) bearing oriented toward the driver.
The pinion shafts in this type of compressor are inside the housing. As a result, it is
difficult to obtain radial measurements directly. A cross-sectional drawing of the com-
pressor is required to determine the best location and orientation for the measurement
points.
Positive Displacement
Two major types of positive-displacement compressors are used in industrial applica-
tions: reciprocating and screw.
Reciprocating Compressors
Limitations of the frequency-domain analysis prevent total analysis of reciprocating
compressors. It is limited to the evaluation of the rotary forces generated by the main
crankshaft. Therefore, time-domain and phase analysis are required for complete
diagnostics.
The primary (X-axis) radial measurement point should be located in a plane opposite
the piston and cylinder. Its orientation should be toward the piston’s stroke. This ori-
entation provides the best reading of the impacts and vibration profile generated by
the reversing linear motion of the pistons. The secondary (Y-axis) radial measurement
08.Mobley.13 Page 116 Thursday, February 4, 1999 3:10 PM
116 Vibration Fundamentals
Figure 13.2 Typical cross-section of a reciprocating compressor.
point should be spaced at 90 degrees to the primary point and in the direction of rota-
tion at the main crankshaft. This configuration should be used for all accessible main
crankshaft bearings. Figure 13.2 provides a typical cross-section of a reciprocating
compressor, which will assist in locating the best measurement points. Similar draw-
ings are available for most compressors and can be obtained from the vendor. There
should be little axial thrusting of the main crankshaft, but an axial (Z-axis) measure-
ment point should be established on the fixed bearing, oriented toward the driver.
If the vibration analyzer permits acquisition of time-domain data, additional time-
waveform data should be obtained from the intermediate guide as well as the inlet and
discharge valves. The intermediate guide is located where the main crankshaft lever
arm connects to the piston rod. Time waveforms from these locations detect any bind-
ing or timing problems that may exist in the compressor.
Screw Compressors
Figure 11.10 illustrates a typical single-stage screw compressor. Radial measurements
should be acquired from all bearing locations in the compressor. The primary bearing
locations are the inboard, or float, bearings on the driver side of the compressor hous-
ing and the fixed bearing located on the outboard end of each shaft.
In most cases, the outboard bearings are not directly accessible and measurement
points must be located on the compressor’s casing. Extreme care must be taken to
ensure proper positioning. A cross-sectional drawing facilitates selection of the best,
most direct mechanical link to the these bearings.
The primary (X-axis) radial measurement point should be located opposite the mesh
of the rotors and oriented toward the mesh. In the illustration, the primary point is on
08.Mobley.13 Page 117 Thursday, February 4, 1999 3:10 PM
117 Vibration Data Acquisition
the top of the housing and oriented in the downward direction. The secondary (Y-axis)
radial measurement point should be in the direction of rotation and 90 degrees from
the primary.
Because of the tendency for screw compressors to generate high axial vibration when
subjected to changes in process conditions, the axial (Z-axis) measurement point is
essential. The ideal location for this point is on the outboard, or fixed, bearing and ori-
ented toward the driver. Unfortunately, this is not always possible. The outboard bear-
ings are fully enclosed within the compressor’s housing and an axial measurement
cannot be obtained at these points. Therefore, the axial measurement must be
acquired from the float, or inboard, bearings. While this position captures the axial
movement of the shaft, the recorded levels are lower than those acquired from the
fixed bearings.
Electric Motors
Both radial (X- and Y-axis) measurements should be taken at the inboard and outboard
bearing housings. Orientation of the measurements is determined by the anticipated
induced load created by the driven units. The primary (X-axis) radial measurement
should be positioned in the same plane as the worst anticipated shaft displacement.
The secondary (Y-axis) radial should be positioned at 90 degrees in the direction of
rotation to the primary point and oriented to permit vector analysis of actual shaft dis-
placement.
Horizontal motors rely on a magnetic center generated by its electrical field to posi-
tion the rotor in the axial (Z-axis) plane between the inboard and outboard bearings.
Therefore, most electric motors are designed with two float bearings instead of the
normal configuration incorporating one float and one fixed bearing. Vertical motors
should have an axial (Z-axis) measurement point at the inboard bearing nearest the
coupling and oriented in an upward direction. This data point monitors the downward
axial force created by gravity or an abnormal load.
Electric motors are not designed to absorb side loads, such as those induced by V-belt
drives. In applications where V-belts or other radial loads are placed on the motor, the
primary radial transducer (X-axis) should be oriented opposite the direction of
induced load and the secondary radial (Y-axis) point should be positioned at 90
degrees in the direction of rotation. If, for safety reasons, the primary transducer can-
not be positioned opposite the induced load, the two radial transducers should be
placed at 45 degrees on either side of the load plane created by the side load.
Totally enclosed, fan-cooled, and explosion-proof motors present some difficulty
when attempting to acquire data on the outboard bearing. By design, the outboard
bearing housing is not accessible. The optimum method of acquiring data is to perma-
nently mount a sensor on the outboard-bearing housing and run the wires to a conve-
nient data-acquisition location. If this is not possible, the X-Y data points should be as
close as possible to the bearing housing. Ensure that there is a direct mechanical path
08.Mobley.13 Page 118 Thursday, February 4, 1999 3:10 PM
118 Vibration Fundamentals
to the outboard bearing. The use of this approach results in some loss of signal
strength from motor-mass damping. Do not obtain data from the fan housing.
Fans and Blowers
If a fan is V-belt driven, the primary measurement point should be in a plane opposing
the side load created by the belts on the inboard and outboard bearings. The second-
ary point should be at 90 degrees to the primary in the direction of rotation.
Bowed shafts caused by thermal and mechanical effects create severe problems on
large fans, especially overhung designs. Therefore, it is advantageous to acquire data
from all four quadrants of the outboard bearing housing on overhung fans to detect
this problem.
At least one axial measurement point should be located on each fan shaft. This is
especially important on fans that are V-belt driven. Axial data are helpful in identify-
ing and quantifying thrust (induced) loads created by the process and any potential
fan element problems such as imbalance, cracked blade, etc.
In applications where numerous fans are in proximity, an additional measurement
point on the base is useful for identifying structural resonance or cross-talk between
the fans.
Gearboxes
Gearbox measurement point orientation and location should be configured to allow
monitoring of the normal forces generated by the gear set. In most cases, the separat-
ing force, which tends to pull the gears apart, determines the primary radial measure-
ment point location. For example, a helical gear set generates a separating force that is
tangential to a centerline drawn through the pinion and bullgear shafts. The primary
(X-axis) radial measurement point should be oriented to monitor this force and a sec-
ondary (Y-axis) radial should be located at 90 degrees to the primary. The best loca-
tion for the secondary (Y-axis) radial is opposite the direction of rotation. In other
words, the secondary leads the primary transducers.
With the exception of helical gears, most gear sets should not generate axial or thrust
loads in normal operation. However, at least one axial (Z-axis) measurement point
should be placed on each of the gear shafts. The axial point should be located at the
fixed, or thrust, bearing cap and oriented toward the gearbox.
In complex gearboxes, it may be difficult to obtain radial measurements from the
intermediate or idler shafts. In most cases, these intermediate shafts and their bearings
are well inside the gearbox. As a result, direct access to the bearings is not possible. In
these cases, the only option is to acquire axial (Z-axis) readings through the gearbox
housing. A review of the cross-sectional drawings allows the best location for these
08.Mobley.13 Page 119 Thursday, February 4, 1999 3:10 PM
119 Vibration Data Acquisition
Figure 13.3 Typical process-roll configuration and wrap-force vectors.
measurements to be determined. The key is to place the transducer at a point that will
provide the shortest, direct link to the intermediate shaft.
Process Rolls
Process rolls are widely used by industry. As with other machine components, two
radial (X- and Y-axis) and one axial (Z-axis) measurement should be acquired from
each roll. However, the orientation of these measurement points is even more critical
for process rolls than for some of the other machine components.
The loading on each roll is generated by the belt, wire mesh, and/or transported prod-
uct. The amount and distribution of the load varies depending on the wrap of the car-
ried load. Wrap refers to the angular distance around the roll that touches the belt,
wire mesh, or product. In most conveyor systems, the load is relatively uniform and is
in a downward direction. In this case, the traditional vertical, horizontal, and axial
mounting positions are acceptable.
Figure 13.3 represents a typical process-roll configuration. The arrows indicate the
force vectors generated by the wire, belt, or product wrap around these rolls. The left
roll has a force vector at 45 degrees down to the left; the right roll has a mirror image
force vector; and the bottom roll has a vertical vector.
The primary (X-axis) radial measurement for the bottom roll should be in the vertical
plane with the transducer mounted on top of the bearing cap. The secondary radial (Y-
axis) measurement should be in the horizontal plane facing upstream of the belt.
08.Mobley.13 Page 120 Thursday, February 4, 1999 3:10 PM
120 Vibration Fundamentals
Since the belt carried by the roll also imparts a force vector in the direction of travel,
this secondary point should be opposite the direction of belt travel.
The ideal primary (X-axis) point for the top right roll is opposite the force vector. In
this instance, the primary radial measurement point should be located on the right of
the bearing cap facing upward at a 45-degree angle. Theoretically, the secondary (Y-
axis) radial point should be at 90 degrees to the primary on the bottom-left of the
bearing cap. However, it may be difficult, if not impossible, to locate and access a
measurement point here. Therefore, the next best location is at 45 degrees from the
anticipated force vector on the left of the bearing cap. This placement still provides
the means to calculate the actual force vector generated by the product.
Pumps
Appropriate measurement points vary by type of pump. In general, pumps can be
classified as centrifugal or positive displacement, and each of these can be divided
into groups.
Centrifugal Pumps
The location of measurement points for centrifugal pumps depends on whether the
pump is classified as end suction or horizontal splitcase.
End Suction Pumps
Figure 13.4 illustrates a typical single-stage, end-suction centrifugal pump. The suc-
tion inlet is on the axial centerline, while the discharge may be either horizontal or
vertical. In the illustration, the actual discharge is horizontal and is flanged in the ver-
tical downstream.
The actual discharge orientation determines the primary radial (X-axis) measurement
point. This point must be oriented in the same plane as the discharge and opposite the
direction of flow. In the illustration, the primary point should be in the horizontal
plane facing the discharge.
Restrictions or other causes of back-pressure in the discharge piping deflect the shaft
in the opposite direction. Referring back to the illustration, the shaft would be
deflected toward the front of the picture. If the discharge were vertical and in the
downward direction, the primary radial measurement point would be at the top of the
pump’s bearing cap looking downward.
A second radial (Y-axis) measurement point should be positioned at 90 degrees to the
primary in a plane that captures secondary shaft deflection. For the pump illustrated in
Figure 13.4, the secondary (Y-axis) radial measurement point is located on top of the
pump’s bearing cap and oriented downward. Since the pump has a clockwise rotation,
back-pressure in the discharge piping forces the shaft both downward and horizon-
tally toward the front of the picture.
08.Mobley.13 Page 121 Thursday, February 4, 1999 3:10 PM
121 Vibration Data Acquisition
Figure 13.4 Typical end-suction, single-stage centrifugal pump.
Because this type of pump is susceptible to axial thrusting, an axial (Z-axis) measure-
ment point is essential. This point should be on the fixed bearing housing oriented
toward the driver.
Horizontal Splitcase Pumps
The flow pattern through a horizontal splitcase pump is radically different than that
through an end-suction pump. Inlet and discharge flow are in the same plane and
almost directly opposite one another. This configuration, illustrated in Figure 13.5,
greatly improves the hydraulic-flow characteristics within the pump and improves its
ability to resist flow-induced instability.
The location of the primary (X-axis) radial measurement point for this type of pump is
in the horizontal plane and on the opposite side from the discharge. The secondary (Y-
axis) radial measurement point should be 90 degrees to the primary point and in the
direction of rotation. If the illustrated pump has a clockwise rotation, the measure-
ment point should be on top, oriented downward. For a counterclockwise rotation, it
should be on bottom, oriented upward.
Single-stage pumps generate some axial thrusting due to imbalance between the dis-
charge and inlet pressures. The impeller design provides a means of balancing these
forces, but it cannot absolutely compensate for the difference in the pressures. As a
result, there will be some axial rotor movement. In double volute, or multistage,
08.Mobley.13 Page 122 Thursday, February 4, 1999 3:10 PM
122 Vibration Fundamentals
Figure 13.5 Typical horizontal splitcase pump.
pumps, two impellers are positioned back to back. This configuration eliminates most
of the axial thrusting when the pump is operating normally.
An axial (Z-axis) measurement point should be located on the fixed bearing housing.
It should be oriented toward the driver to capture any instability that may exist.
Multistage Pumps
Multistage pumps may be either end-suction or horizontal splitcase pumps. They have
two basic impeller configurations, in-line or opposed, as shown in Figure 13.6. In-line
impellers generate high thrust loads.
The impeller configuration does not alter the radial measurement locations discussed
in the preceding sections. However, it increases the importance of the axial (Z-axis)
measurement point. The in-line configuration drastically increases the axial loading
on the rotating element and, therefore, the axial (Z-axis) measurement point is critical.
Obviously, this point must be in a location that detects axial movement of the shaft.
However, since large, heavy-duty fixed bearings are used to withstand the high thrust
loading generated by this design, direct measurement is difficult. A cross-sectional
08.Mobley.13 Page 123 Thursday, February 4, 1999 3:10 PM
123 Vibration Data Acquisition
Figure 13.6 In-line and opposed impellers on multistage pumps.
drawing of the pump may be required to locate a suitable location for this measure-
ment point.
Positive-Displacement Pumps
Positive-displacement pumps can be divided into two major types: rotary and recipro-
cating. All rotary pumps use some form of rotating element, such as gears, vanes, or
lobes to increase the discharge pressure. Reciprocating pumps use pistons or wobble
plates to increase the pressure.
Rotary Pumps
Locations of measurement points for rotary positive-displacement pumps should be
based on the same logic as in-line centrifugal pumps. The primary (X-axis) radial
measurement should be taken in the plane opposite the discharge port. The secondary
08.Mobley.13 Page 124 Thursday, February 4, 1999 3:10 PM
124 Vibration Fundamentals
(Y-axis) radial should be at 90 degrees to the primary and in the direction of the rotor’s
rotation.
Since most rotary positive-displacement pumps have inlet and outlet ports in the same
plane and opposed, there should be relatively little axial thrusting. However, an axial
(Z-axis) measurement should be acquired from the fixed bearing, oriented toward the
driver.
Reciprocating Pumps
Reciprocating pumps are more difficult to monitor because of the combined rotational
and linear motions that are required to increase the discharge pressure. Measurement
point location and orientation should be based on the same logic as that of reciprocat-
ing compressors.
09.Mobley.14 Page 125 Thursday, February 4, 1999 3:21 PM
Chapter 14
TRENDING ANALYSIS
Long-term vibration trends are a useful diagnostic tool. Trending techniques involve
graphically comparing the total energy, which is the sum of the frequency compo-
nents’ amplitude over some consistent, user-selected frequency range (i.e., F
MIN
to
F
MAX
), over a long period of time to get a historical perspective of the vibration pat-
tern. Plots of this sum against time (e.g., days) provide a means of quantifying the rel-
ative condition of the monitored machine (see Figure 14.1). Most predictive
maintenance systems provide automatic-trending capabilities for recorded data. This
is not to be confused with time-domain plots, which are instantaneous measures of
total vibration amplitude plotted against time measured in seconds.
Figure 14.1 Trend data are plotted versus time and provide historical trends.
125
09.Mobley.14 Page 126 Thursday, February 4, 1999 3:21 PM
126 Vibration Fundamentals
Figure 14.2 Typical broadband measurements.
Used properly, this feature greatly enhances a predictive maintenance program. The
real value of trending techniques is that they provide the capability of automatically
scanning large amounts of data (both broadband and narrowband) and reporting any
change in preselected values.
T
YPES OF
T
RENDS
The three primary categories of trends are broadband, narrowband, and combinations
of the two.
Broadband Trends
Most microprocessor-based vibration-monitoring systems acquire and record a fil-
tered broadband energy level for each data point included in the program. The band-
width of the energy band is determined by the minimum, F
MIN
, and maximum, F
MAX
,
frequencies that were established as part of the database setup. In most applications,
the minimum frequency should be zero, but the maximum varies, depending on the
specific machine-train. Figure 14.2 illustrates typical broadband data.
09.Mobley.14 Page 127 Thursday, February 4, 1999 3:21 PM
127 Trending Analysis
POINT SHAFT INSTABILITY VANEPASS BEARING DEFECTS
V01 0.10 0.09 0.001
V02 0.10 0.09 0.002
V03 0.13 0.10 0.002
V04 0.11 0.09 0.010
Figure 14.3 Narrowband data.
Broadband data cannot be used to identify specific machine components (e.g., bear-
ing, gears) or failure modes (e.g., imbalance, misalignment). The data acquired using
broadband filters are limited to the total energy value contained within the user-
selected frequency window or bandwidth, F
MIN
to F
MAX
.
At best, broadband energy provides a gross approximation of the machine’s condition
and its relative rate of degradation. Since the only available data are overall energy
values, broadband data do not provide enough detail to permit diagnosis of machine-
train condition. Without discrete identification of the specific frequencies that make
up the overall energy, the failure mode or failing component cannot be determined.
Narrowband Trends
Like broadband data, narrowband data also reflect the total energy, but it reflects a
more restricted user-selected range or window. Narrowband monitoring generally is
used to trend and evaluate one selected machine-train component rather than several.
Filtered narrowband windows are typically set up around the unique frequency com-
ponents generated by specific machine-train components so that the energy in each
filtered window can be directly attributed to that specific machine component. How-
ever, even though narrowband analysis improves the diagnostic capabilities of a pre-
dictive maintenance program, it is not possible to isolate and identify specific failure
modes within a machine-train. Figure 14.3 illustrates the added information provided
by narrowband data.
09.Mobley.14 Page 128 Thursday, February 4, 1999 3:21 PM
128 Vibration Fundamentals
Figure 14.4 Narrowband trends provide energy histories of specific components.
Figure 14.4 illustrates narrowband data trends. In addition to the overall or broadband
energy, narrowband trends indicate the relative energy in select machine-train compo-
nents. In effect, this type of analysis is a series of mini-overall energy readings.
Composite Trends
Most microprocessor-based systems permit composite trending (i.e., simultaneous
displays) of both filtered broadband and narrowband data. Figure 14.5 illustrates a
composite trend that includes both broadband and narrowband data. This type of plot
is quite beneficial because it permits the analyst to track the key indicators of machine
condition on one plot.
E
VALUATION
M
ETHODS
Trend data can be used in the following ways: (1) to compare with specific reference
values, (2) mode-shape comparisons, and (3) cross-machine comparisons.
Comparison to Reference Values
Three types of reference-value comparisons are used to evaluate trend data: baseline
data, rate of change, and industrial standards.
Baseline Data
A series of baseline or reference data sets should be taken for each machine-train
included in a predictive maintenance program. These data sets are necessary for
future use as a reference point for trends, time traces, and FFT signatures that are col-
09.Mobley.14 Page 129 Thursday, February 4, 1999 3:21 PM
129 Trending Analysis
Figure 14.5 Combined trends (i.e., composite) provide both broadband and narrowband
data.
lected over time. Such baseline data sets must be representative of the normal operat-
ing condition of each machine-train to have value as a reference.
Three criteria are critical to the proper use of baseline comparisons: reset after main-
tenance, proper identification, and process envelope.
Reset After Maintenance
The baseline data set must be updated each time the machine is repaired, rebuilt, or
when any major maintenance is performed. Even when best practices are used,
machinery cannot be restored to as-new condition when major maintenance is per-
formed. Therefore, a new baseline or reference data set must be obtained following
these events.
Proper Identification
Each reference or baseline data set must be clearly and completely identified. Most
vibration-monitoring systems permit the addition of a label or unique identifier to any
user-selected data set. This capability should be used to clearly identify each baseline
data set.
09.Mobley.14 Page 130 Thursday, February 4, 1999 3:21 PM
130 Vibration Fundamentals
In addition, the data set label should include all defining information. For example,
any rework or repairs made to the machine should be identified. If a new baseline data
set is obtained after the replacement of a rotating element, this information should be
included in the descriptive label.
Process Envelope
Since variations in process variables, such as load, have a direct effect on the vibration
energy and signature generated by a machine-train, the actual operating envelope for
each baseline data set must also be clearly identified. If this step is omitted, direct
comparison of other data to the baseline will be meaningless. The label feature in
most vibration monitoring systems permits tagging the baseline data set with this
additional information.
Rate of Change
Rate of change is the most often used trend analysis. Because most of the micropro-
cessor-based systems provide the ability to automatically display both broadband and
narrowband data trends, analysts tend to rely on this means of comparative analysis.
Rate of change is a valid means of defining the relative condition of rotating machin-
ery. As a general rule, there must be a change in mechanical condition before there
can be a change in the vibration energy generated by a machine. Therefore, monitor-
ing the rate that the energy levels change, either up or down, is a useful tool (see Fig-
ure 14.6). Caution: Broadband and narrowband data must be normalized for changes
in load before being valid. Normal variations in machine load destroy the validity of
non-normalized trend data and little can be gained from its use.
Industrial Standards
There are a number of published standards that define acceptable levels of vibration in
machinery. These standards are valuable reference tools, but they must be clearly
understood and properly used. Industrial-standard data can be obtained from a Rath-
bone chart and from the American Petroleum Institute.
Rathbone Vibration-Severity Chart
The Rathbone chart provides levels of vibration severity that range from extremely
smooth, which is the best possible operating condition, to very rough or absolute-fault
limit, which is the maximum level where a machine can operate (see Figure 14.7).
This chart is useful, although it is often misused. Four factors must be understood
before using the chart:
1. Data included in the Rathbone chart are valid for machines with running
speeds between 1200 and 3600 rpm. The chart cannot be used for low-
speed or turbomachinery.
09.Mobley.14 Page 131 Thursday, February 4, 1999 3:21 PM
131 Trending Analysis
Figure 14.6 Rate of change of trend data indicates condition change.
2. The data presented in the chart are relative vibration levels (i.e., taken from
a bearing pedestal using either an accelerometer or velocity probe) in
inches per second (in./sec) peak.
3. Data are peak values of velocity (in./sec) for a filtered broadband from 10
to 10,000 Hz.
4. The severity levels are relative, not absolute. For example, when a machine
reaches the absolute-fault limit, it has a 90% probability of failure within
its next 1000 hours of operation (i.e., it is not going to fail tomorrow).
09.Mobley.14 Page 132 Thursday, February 4, 1999 3:21 PM
132 Vibration Fundamentals
Figure 14.7 Rathbone chart-relative vibration severity.
American Petroleum Institute Standards
The American Petroleum Institute (API) has established standards for vibration lev-
els. Unlike the Rathbone chart, which presents relative vibration data, the API stan-
dards are actual shaft displacement as measured with a displacement probe. Based on
the API data, acceptable vibration can be defined by:
12,000
Vibration Severity = m ils, peak-to-peak
rpm
The API equivalent of the absolute-fault limit can be defined by:
09.Mobley.14 Page 133 Thursday, February 4, 1999 3:21 PM
133 Trending Analysis
12,000
Absolute-fault Limit = 1.3 × m ils, peak-to-peak
rpm
The API standards are reasonable for turbomachinery, but are unacceptable for lower
speed machines. The standards are applicable for rotating machinery with speeds
above 1800 rpm; marginal for speeds between 600 and 1800 rpm; and should not be
used for speeds below 600 rpm.
Mode Shape (Shaft Deflection)
A clear understanding of the mode shape, or shaft deflection, of a machine’s rotating
element is a valuable diagnostic tool. Both broadband and narrowband filtered energy
windows can be used at each measurement point and orientation across the machine.
The resultant plots, one in the vertical plane and one in the horizontal plane, provide an
approximation of the mode shape of the complete machine and its rotating element.
Unfortunately, these plots must be developed manually. The microprocessor-based
systems generally do not automate this function, but they are easily constructed on
graph paper. The following steps are used to construct such a plot:
1. The first step is to draw two horizontal lines on the graph paper. One is
used to plot the vertical data and the other to plot the horizontal. These two
lines show the location of each measurement point in inches with the out-
board motor bearing being at zero.
2. Next, draw vertical lines that intersect the left-hand end of the two hori-
zontal lines. These vertical lines form the amplitude scale for the two plots.
Establish the amplitude scale based on the maximum energy level recorded
in the broadband or narrowband windows.
3. The final step is to plot the actual measured amplitude at each measure-
ment point on the machine-train. Start with the outboard motor bearing
and move across the machine until the final data set is plotted.
Broadband Plots
The overall energy from the filtered broadband plotted against measurement location
provides an approximation of the mode shape of the installed machine. Figure 14.8
illustrates a vertical broadband plot taken from a Spencer blower. Note that the motor
appears to be flexing in the vertical direction. Extremely high amplitudes are present
in the motor’s outboard bearing and the amplitudes decrease at subsequent measure-
ment points across the machine.
A mode curve exhibiting the shape shown in Figure 14.8 could indicate that the motor
mountings, or the baseplate under the motor, are loose and that the motor is moving
vertically. In fact, in the example from which this figure was taken, this is exactly
what was happening. The blower’s baseplate “floats” on a 1-in. thick cork pad, which
09.Mobley.14 Page 134 Thursday, February 4, 1999 3:21 PM
134 Vibration Fundamentals
Figure 14.8 Vertical broadband mode shape for Spencer blower indicates potential failure.
is normally an acceptable practice. However, in this example, an inlet filter/silencer
was mounted without support directly to the inlet located on the right end of the
machine. The weight of the filter/silencer compressed the cork pad under the blower,
which lifted the motor-end of the baseplate off of the cork pad. In this mode, the
motor has complete freedom of movement in the vertical plane. In effect, it acts like a
tuning fork and creates the high overall energy recorded on the mode plot.
Narrowband Plots
Narrowband plots permit the same type of evaluation for major vibration components
such as fundamental running speed (1
×) or gear mesh. The plots are constructed in the
same way as for the broadbands, except that the amplitude values are for user-selected
windows, or bands.
Using the previously mentioned example of the Spencer blower, Figure 14.9 is a plot
of the fundamental (1
×) frequency of the motor-blower shaft versus measurement
location. Note that the vertical mode (see Figure 14.9) appears to be relatively normal,
09.Mobley.14 Page 135 Thursday, February 4, 1999 3:21 PM
135 Trending Analysis
Figure 14.9 Horizontal narrowband (1×) mode shape indicates shaft deflection.
except for the motor looseness problem. The horizontal plot seems to indicate that the
shaft is being severely deflected from its true centerline. In addition, the plot suggests
that the deflection is outboard (i.e., toward the rotor) from the two blower-support
bearings. This outboard deflection eliminates misalignment between the motor and
blower as a possible source of the deflection. We must now determine what could
cause the rotor to be deflected and why only in the horizontal direction.
The Spencer blower in this example provides air to a drying process in a metal-coating
line. Its configuration includes an end-suction inlet that is in line with the shaft and a
horizontal discharge that is perpendicular to the shaft. In this particular example, the
source of the shaft deflection observed in the mode plot is aerodynamic instability.
The reason for this instability is that the blowers are incorrectly sized for the applica-
tion and are running well outside their performance curve. In effect, the blowers have
no back-pressure and are operating in a runout condition. The result of operating in
09.Mobley.14 Page 136 Thursday, February 4, 1999 3:21 PM
136 Vibration Fundamentals
this condition is that the design load intended to stabilize the rotor is no longer
present. This causes the shaft to deflect or flex, generating the high amplitudes
observed in the horizontal mode plot.
The problem is eliminated by restricting the discharge air flow from the blowers. By
increasing the back-pressure, the blowers are able to operate within their normal enve-
lope and the shaft deflection disappears.
Cross-Machine Comparisons
Cross-machine comparison is an extremely beneficial tool to the novice analyst. Most
vibration-monitoring systems permit direct comparison of vibration data, both filtered
window energy and complete signatures, acquired from two machines. This capability
permits the analyst to compare a machine that is known to be in good operating condi-
tion directly with one that is perceived to have a problem. There are several ways that
cross-machine comparisons can be made using microprocessor-based systems: multi-
ple plots, ratio, and difference.
L
IMITATIONS
Although quite valuable when used properly, trends do not allow the analyst to con-
firm that a problem exists or to determine the cause of incipient problems. Another
limitation is the limited number of values the system can handle. Further, the data
need to be normalized for speed, load, and process variables.
Number of Values
Some of the vibration-monitoring systems limit the number of data sets and duration
of data that can be automatically trended. In most systems, the number of values that
can be trended is limited to 8 to 12 data sets. Although this limitation prevents trend-
ing the machine over its useful life, it does not eliminate trending as a vibration-mon-
itoring tool.
Data Normalization
Trend data that are not properly normalized for speed, load, and process variables are
of little value. Because load and process-variable normalization require a little more
time during the data-acquisition process, many programs do not perform these adjust-
ments. If this is the case, it is best to discontinue the use of trends altogether.
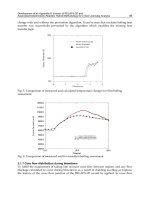
As an example, Figure 14.10 illustrates the impact of load on vibration trends. The
solid line represents the recorded raw broadband vibration levels. The dashed line is
the same data adjusted for changes in load.
09.Mobley.14 Page 137 Thursday, February 4, 1999 3:21 PM
137 Trending Analysis
Figure 14.10 Trends must be adjusted or normalized for load changes.
Figure 14.11 Baselines must be reset following repair.
Trend data also must be adjusted for maintenance and repair activities. Figure 14.11
illustrates an average trend curve that indicates a sharp rise in vibration levels. It also
reflects that, after repair, the levels drop radically. At this point, all baseline and refer-
ence values should be reset. If this does not occur, the automatic trending capabilities
of the computer-based system do not function properly.
10.Mobley.15 Page 138 Friday, February 5, 1999 10:38 AM
Chapter 15
FAILURE-MODE ANALYSIS
All of the analysis techniques discussed to this point have been methods to determine
if a potential problem exists within the machine-train or its associated systems. Fail-
ure-mode analysis is the next step required to pinpoint specifically the failure mode
and identify which machine-train component is degrading.
Although failure-mode analysis identifies the number and symptoms of machine-train
problems, it does not always identify the true root cause of problems. Root cause must
be verified by visual inspection, additional testing, or other techniques such as operat-
ing dynamics analysis.
Failure-mode analysis is based on the assumption that certain failure modes are com-
mon to all machine-trains and all applications. It also assumes that the vibration pat-
terns for each of these failure modes, when adjusted for process-system dynamics, are
absolute and identifiable.
Two types of information are required to perform failure-mode analysis: (1)
machine-train vibration signatures, both FFTs and time traces; and (2) practical
knowledge of machine dynamics and failure modes. A number of failure-mode
charts are available that describe the symptoms or abnormal vibration profiles that
indicate potential problems exist. An example is the following description of the
imbalance failure mode, which was obtained from a failure-mode chart: Single-
plane imbalance generates a dominant fundamental (1
×) frequency component with
no harmonics (2×, 3×, etc.). Note, however, that the failure-mode charts are simplis-
tic since many other machine-train problems also excite, or increase the amplitude
of, the fundamental (1
×) frequency component. In a normal vibration signature, 60
to 70% of the total overall, or broadband, energy is contained in the 1× frequency
component. Any deviation from a state of equilibrium increases the energy level at
this fundamental shaft speed.
138