báo cáo khoa học: " Analysis of expression profiles of MAGE-A antigens in oral squamous cell carcinoma cell lines" ppsx
Bạn đang xem bản rút gọn của tài liệu. Xem và tải ngay bản đầy đủ của tài liệu tại đây (1.5 MB, 9 trang )
BioMed Central
Page 1 of 9
(page number not for citation purposes)
Head & Face Medicine
Open Access
Research
Analysis of expression profiles of MAGE-A antigens in oral
squamous cell carcinoma cell lines
Urs DA Müller-Richter*
1
, Albert Dowejko
2
, Tobias Reuther
1
,
Johannes Kleinheinz
3
, Torsten E Reichert
2
and Oliver Driemel
2
Address:
1
Dpt of Oral and Maxillofacial Plastic Surgery, University Hospital Würzburg, Pleicherwall 2, 97070 Würzburg, Germany,
2
Dpt of Oral
and Maxillofacial Surgery, University Hospital Regensburg, Franz-Josef-Strauss-Allee 11, 93053 Regensburg, Germany and
3
Dpt of Maxillofacial
Surgery, University of Münster, Waldeyerstraße 30, 48149 Münster, Germany
Email: Urs DA Müller-Richter* - ; Albert Dowejko - ;
Tobias Reuther - ; Johannes Kleinheinz - ;
Torsten E Reichert - ; Oliver Driemel -
* Corresponding author
Abstract
Background: The immunological response to solid tumours is insufficient. Therefore, tumour
specific antigens have been explored to facilitate the activation of the immune system. The cancer/
testis antigen class of MAGE-A antigens is a possible target for vaccination. Their differential
expression profiles also modulate the course of the cancer disease and its response to
antineoplastic drugs.
Methods: The expression profiles of MAGE-A2, -A3, -A4, -A6 and -A10 in five own oral squamous
cell carcinoma cell lines were characterised by rt-PCR, qrt-PCR and immunocytochemistry with a
global MAGE-A antibody (57B) and compared with those of an adult keratinocyte cell line (NHEK).
Results: All tumour cell lines expressed MAGE-A antigens. The antigens were expressed in groups
with different preferences. The predominant antigens expressed were MAGE-A2, -A3 and -A6.
MAGE-A10 was not expressed in the cell lines tested. The MAGE-A gene products detected in the
adult keratinocyte cell line NHEK were used as a reference.
Conclusion: MAGE-A antigens are expressed in oral squamous cell carcinomas. The expression
profiles measured facilitate distinct examinations in forthcoming studies on responses to
antineoplastic drugs or radiation therapy. MAGE-A antigens are still an interesting aim for
immunotherapy.
Background
Tumour cells express specific antigens. Despite the fact
that the protein products of these genes are absent or only
partially found on healthy cells, the immunological
response is insufficient[1,2]. The goal of several studies
was to map these tumour antigens and use them to induce
or boost the immunological response[3-5]. Of particular
interest are tumour antigens that occur only on tumour
cells and are not detectable on physiologically healthy
cells. Such a group of tumour antigens are the MAGE-A
antigens, a subgroup of cancer/testis antigens. These anti-
gens are only expressed on germ cells and placenta
Published: 9 April 2009
Head & Face Medicine 2009, 5:10 doi:10.1186/1746-160X-5-10
Received: 31 July 2008
Accepted: 9 April 2009
This article is available from: />© 2009 Müller-Richter et al; licensee BioMed Central Ltd.
This is an Open Access article distributed under the terms of the Creative Commons Attribution License ( />),
which permits unrestricted use, distribution, and reproduction in any medium, provided the original work is properly cited.
Head & Face Medicine 2009, 5:10 />Page 2 of 9
(page number not for citation purposes)
cells[6,7]. The authors could also demonstrate an expres-
sion in fetal oral keratinocytes[25] but could not elucidate
their role in development. In contrast, these antigens are
commonly expressed on many different tumours[7-9].
They are found in dermal and oral squamous cell carcino-
mas, amongst others[7,10-12]. These studies suggest that
MAGE-A antigens are simultaneously expressed in antigen
groups. The MAGE-A subgroups differ in their protein
structures[7,13]. This might influence an interaction with
a potential drug or antibody and weaken their therapeutic
effect. To validate this hypothesis, we quantitatively ana-
lysed the expression profiles of MAGE-A2, MAGE-A3,
MAGE-A4, MAGE-A6 and MAGE-A10 in 5 oral squamous
cell carcinoma cell lines by qrt-PCR and compared the
results with the expression profile of a reference adult
keratinocyte cell line.
Methods
Normal Human Epidermal Keratinocytes (NHEK)
The adult Normal Human Epidermal Keratinocytes
(NHEK-adult) cell line was obtained from PromoCell
GmbH, 69126 Heidelberg, Germany. The cell line was
established using adult keratinocytes. The culturing was
carried out according to the manufacturer's instructions.
Tumour cell lines
PCI-13-1
The PCI-13-1 cell line was established from a male patient
who suffered from low grade oral squamous cell carci-
noma of the retromolar triangle. The tumour stage was
pT4pN1M0G3.
PCI-1-1
The origin of this cell line was a larynx carcinoma of the
glottis. It was harvested from a male patient. The grading
was moderately differentiated and the tumour staging was
pT2N0M0G2.
PCI-52
This tumour originated from the aryepiglottic fold of a
male patient. It was a primary carcinoma with moderate
differentiation. The tumour staging at the time of harvest-
ing was pT2N0M0G2.
PCI-68-1
This cell line was established from a primary tongue carci-
noma of male patient. The carcinoma was well differenti-
ated. The tumour staging at time the cells were harvested
was pT4N0M0G1.
PCI-9-1
This cell line was established from a primary carcinoma of
the base of the tongue of a male patient. It was moderately
differentiated. The tumour staging was pT4N3M0G2.
RNA-isolation and rt-PCR
Total RNA from the tumour cell lines examined was
extracted using RNeasy Mini Kits (Qiagen, 40724 Hilden,
Germany) according to the manufacturer's instructions.
The isolated RNA was stored at -20°C until reverse tran-
scription. CDNA was created from isolated total RNA
using dN6-random-primers (Roche Pharma AG, 79639
Grenzach-Wyhlen, Germany) and reverse transcription
with Superscript II (Invitrogen GmbH, 76131 Karlsruhe,
Germany). cDNA was incubated with 1 μl RNase A (Roche
Pharma AG, 79639 Grenzach-Wyhlen, Germany) for 60
min at 37°C. The cDNA was stored at -20°C until rt-PCR
analysis. RNA integrity was tested by rt-PCR of the house-
keeping gene beta-actin. Specific rt-PCR detection of
MAGE-A2, MAGE-A3, MAGE-A4, MAGE-A6 and MAGE-
A10 was performed with the primers listed in Table 1. The
primers were obtained from TibMolBiol (12103 Berlin,
Germany). The ideal annealing temperature of single
MAGE-A primers was defined by a gradient rt-PCR (52 to
72°C in 12 steps). The following program was used for
MAGE-A primers: initial denaturation at 94°C for 5 min-
utes, 35 cycles of amplification with denaturation at 94°C
for one minute, primer annealing for 1 minute (for spe-
cific temperatures see Table 1) and elongation at 72°C for
two minutes, and a final elongation at 72°C for 10 min-
utes. The rt-PCR program for MAGE-A4 differed in that it
used an elongation time of two minutes within the cycles
and a final elongation time of 5 minutes. The synthesised
rt-PCR products were separated by electrophoresis in an
agarose gel, stained with ethidium bromide and visualised
with UV light. As indicator for product size the 100 bp
marker TrackIt kit (Invitrogen GmbH, 76131 Karlsruhe,
Germany) was used. Water instead of cDNA was used as
control.
Quantitative Real-Time PCR (LightCycler)
The expression profiles of MAGE-A2, MAGE-A3, MAGE-
A4, MAGE-A6 and MAGE-A10 were quantitatively meas-
ured by qrt-PCR. To validate the values measured for each
MAGE-A gene, three measurements were performed and
the mean value calculated. The measurements were per-
formed with a LightCycler 2.0 qrt-PCR-System (Roche
Pharma AG, 79639 Grenzach-Wyhlen, Germany) using
FastStart DNA Master Plus SYBR-Green I (Roche Pharma
AG, 79639 Grenzach-Wyhlen, Germany). The reaction
volume of each measurement was 20 μl, consisting of 1 μl
cDNA, 1 μl forward primer (20 μM), 1 μl reverse primer
(20 μM), 4 μl LightCycler DNA Master SYBR-Green I
(Roche), and 13 μl water. The steps for the qrt-PCR pro-
gram for the LightCycler were: an initial denaturation at
95°C for 7 minutes, 45 cycles of amplification with dena-
turation at 95°C for 10 minutes, primer annealing for 10
seconds (for specific temperatures see Table 1) and elon-
gation at 72°C for 18 seconds. Completing the protocol,
a melting range analysis with one cycle at 95°C for 30 sec-
Head & Face Medicine 2009, 5:10 />Page 3 of 9
(page number not for citation purposes)
onds followed by a cycle at 67°C for 20 seconds with con-
tinuously measured fluorescence was performed. The
values measured were normalised to the expression in
adult keratinocytes (NHEK, reference)[25]. The values are
given in arbitrary units (a.u.).
Immunocytochemistry
For immunocytochemistry, the monoclonal global
MAGE-A antibody 57B was used (by courtesy of Prof.
Giulio C. Spagnoli, Onkologische Chirurgie, Institute for
Surgical Research and Hospital Management, University
Hospital Basel, 4031 Basel, Switzerland). This mono-
clonal antibody binds to a common epitope of MAGE-A
antigens and facilitates simultaneous detection. The cells
were seeded (5 × 10
5
adherent cells per chamber) on a
four chamber slide (LabTek™ Chamber Slide System,
Nunc, 65201 Wiesbaden, Germany) and incubated. After-
wards the cells were washed three times (Wash buffer
S3006, DAKO, 22083 Hamburg, Germany) and fixated
with acetone. Endogenous peroxidase was blocked with
for ten minutes (DAKO 2023, DAKO, 22083 Hamburg,
Germany) and the cells were washed again three times.
The antibody ligands were blocked with 5% goat serum
(X0907, DAKO, 22083 Hamburg, Germany) for one
hour. The monoclonal antibody (anti-MAGE 57B) was
diluted 1:10 and incubated with the fixed cells for one
hour. The cells were washed three times again. Staining
was performed with a secondary antibody (radish peroxi-
dase) with the Envision™/HRP-System (DAKO K4063,
DAKO, 22083 Hamburg, Germany) according to the
manufacturer's instructions and additional counterstain-
ing was done with hematoxylin.
Results
Using rt-PCR, MAGE-A antigens were detected in all cell
lines examined (Figures 1, 2, 3, 4, 5). MAGE-A10 was also
detected in all cell lines. This is in contrast to qrt-PCR
which did not reveal any significant expression compared
with the reference cell line. This can be explained by the
high number of PCR-cycles (35). Even minimal amounts
are amplified to sufficient portion for detection.
Table 1: This table presents the structure of the primers used, their base pair lengths and the corresponding annealing temperatures.
Gene Sequence (5'→ 3') Base pairs (bp) Annealing temp. (°C)
β-Actin for CTACGTCGCCCTGGACTTCGAGC
rev GATGGAGCCGCCGATCCACACGG
384 68
MAGE-A2 for AAGTAGGACCCGAGGCACTG
rev GAAGAGGAAGAAGCGGTCTG
236 62
MAGE-A3 for CCAAGCAGCACTCAGTAGGAAGG
rev GGAAGCTTTGCTGAAGATC
150 51
MAGE-A4 for GAGCAGACAGGCCAACCG
rev AAGGACTCTGCGTCAGGC
445 65
MAGE-A6 for GGAAGGTGGCCAAGTTGGTTC
rev CCAGCTGCAAGGAATCGGAAG
149 56
MAGE-A10 for CACAGAGCAGCACTGAAGGAG
rev CTGGGTAAAGACTCACTGTCTGG
484 60
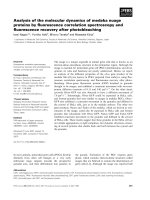
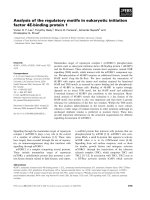
RT-PCR-Blot of MAGE-A2 expression in the cell lines exam-inedFigure 1
RT-PCR-Blot of MAGE-A2 expression in the cell lines
examined. Double bands indicate splice variants. (left col-
umn = 100 bp marker, right column (control) = water).
Head & Face Medicine 2009, 5:10 />Page 4 of 9
(page number not for citation purposes)
Some splicing variants of MAGE-A2 and MAGE-A4 were
found. They can be seen in figure 1 (MAGE-A2) for the cell
lines PCI 13-1, PCI 1-1, PCI 52 und PCI 9-1 and in figure
3 for the cell line PCI 52. Those splicing variants have
been described before . The
amplification of each of those variants is very strong com-
pared with its counterpart (wild type). This should cause
no bias regarding the amplification in qrt-PCR.
For further analysis, immunocytochemical staining and
hematoxylin counterstaining of cultured cells was per-
formed (Figures 6, 7, 8, 9, 10, 11). The staining patterns
differed significantly. In the NHEK adult keratinocyte cell
line, only a sole cell in the whole slide was stained with
the 57B antibody (Figure 6). The results for each cell line
are described in detail.
PCI 13-1
In rt-PCR all MAGE-A antigens could be amplified. This
cell line showed a splicing variant for MAGE-A2. In qrt-
PCR these cells expressed like cell line PCI 9-1, MAGE-A
antigens -A2, -A3 and -A6 significantly. The expression
levels were also comparable to cell line PCI 9-1. MAGE-A2
showed an expression of 11.46 a.u., MAGE-A3 9.94 a.u.
(the highest value measured of the cell lines) and MAGE-
A6 had an expression of 62.79 a.u.
The staining revealed a relatively equal pattern with some
additional strong (about 15% of the cells) staining (Figure
7). The staining was mainly localised within the cytosol.
The staining rate of the tumour cells was about 100%.
This correlates with a multi-MAGE-A expression profile,
with MAGE-A2, -A3, -A6 very high and MAGE-A4 being
significantly weaker.
PCI 1-1
In rt-PCR all MAGE-A antigens could be amplified. This
cell line showed also a splicing variant for MAGE-A2. PCI
1-1 also has a similar multi-MAGE-A expression profile in
qrt-PCR compared to PCI 13-1. This cell line expresses 3
different MAGE-A antigens (MAGE-A2, MAGE-A3 and
MAGE-A6). MAGE-A2 and MAGE-A6 were expressed at a
moderate level (MAGE-A2: 9.21 a.u.; MAGE-A3: 9.76 a.u.)
and MAGE-A6 was expressed at a high level (64.54 a.u.).
A MAGE-A4 expression was absent.
The cells of this tumour cell line were stained by mAb 57B
in a very similar pattern compared to PCI 13-1 (Figure 8).
Staining was also mainly localised within the cytosol and
the staining rate was also approximately 100%. A strong
staining was seen in about 10% of the tumour cells.
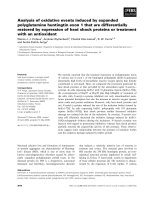
RT-PCR-Blot of MAGE-A3 expression in the cell lines exam-inedFigure 2
RT-PCR-Blot of MAGE-A3 expression in the cell lines
examined. The intensity of the bands suggests different lev-
els of expression. (left column = 100 bp marker, right column
(control) = water).
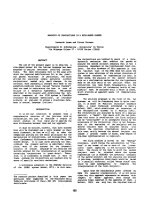
RT-PCR blot of MAGE-A4 expression in cell lines examinedFigure 3
RT-PCR blot of MAGE-A4 expression in cell lines
examined. Cell line PCI 52 has a splice variant. Besides this
finding, there is a homogenous expression pattern. (left col-
umn = 100 bp marker, right column (control) = water).
Head & Face Medicine 2009, 5:10 />Page 5 of 9
(page number not for citation purposes)
PCI 52
The rt-PCR all MAGE-A antigens could be amplified and
PCI 52 had also a splicing variant for MAGE-A2 and an
additional splicing variant for MAGE-A4.
In qrt-PCR the expression profile of this cell line showed
the most increased MAGE-A antigens. MAGE-A2, MAGE-
A3, MAGE-A4, and MAGE-A6 were increased. PCI 52 is
also the only cell line examined that showed a significant
expression of MAGE-A4 in rt-PCR as well as in qrt-PCR
(15.96 a.u.). This is remarkable because it was the only
cell line with a MAGE-A4 splicing variant. The expression
of MAGE-A2 was the highest of the cell lines examined
and reached 15.39 a.u. Expression of MAGE-A6 was at the
same level and reached 18.31 a.u. The value of MAGE-A3
expression was the lowest, at 3.49 a.u.
In this cell line, a very strong staining was seen. All cells
showed a strong cytosolic and sometimes an even
stronger cell membrane staining with mAb 57B (Figure 9).
The staining rate was 100%.
PCI 68-1
Despite the amplification of all MAGE-A antigens in rt-
PCR PCI 68-1 only MAGE-A3 was significantly increased
in qrt-PCR. But an expression of 2.97 a.u. was weak. In rt-
PCR this cell line was the only one with the same splicing
variant of MAGE-A2 compared with the reference cell line
NHEK.
Within these tumour cells, no significant staining could
be achieved by mAb 57B (Figure 10). The staining rate was
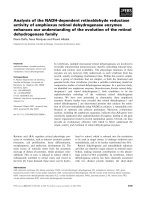
RT-PCR blot of MAGE-A6 expression in the cell lines exam-inedFigure 4
RT-PCR blot of MAGE-A6 expression in the cell lines
examined. There is a homogenous expression pattern. (left
column = 100 bp marker, right column (control) = water).
RT-PCR blot of MAGE-A10 expression in the cell lines examinedFigure 5
RT-PCR blot of MAGE-A10 expression in the cell
lines examined. There is a homogenous expression pat-
tern. (left column = 100 bp marker, right column (control) =
water).
Slide with NHEK cells stained immunocytochemically for MAGE-A and counterstained with hematoxylin (400× magni-fication)Figure 6
Slide with NHEK cells stained immunocytochemi-
cally for MAGE-A and counterstained with hematox-
ylin (400× magnification). Only a single cell was found
with antibody staining.
Head & Face Medicine 2009, 5:10 />Page 6 of 9
(page number not for citation purposes)
about 0%. Only a very homogenous Hematoxylin stain-
ing was possible.
PCI 9-1
In rt-PCR all MAGE-A antigens could be amplified. This
cell line showed the same splicing variant for MAGE-A2
like PCI 13-1, PCI1-1 and PCI 52.
This cell line also expresses a group of MAGE-A antigens.
As with PCI 1-1, this cell line highly expresses MAGE-A2,
MAGE-A3 and MAGE-A6 in qrt-PCR. MAGE-A2 showed
an expression of 10.67 a.u., MAGE-A3 of 8.88 a.u. and
MAGE-A6 of 85.86 a.u. (the highest value measured of the
cell lines examined).
In this cell line, there was a significant staining by mAb
57B (Figure 11). Nearly all of the cells were stained in the
Tumour cell line PCI 13-1 with immunocytochemical MAGE-A staining and hematoxylin counterstaining (400× magnifica-tion)Figure 7
Tumour cell line PCI 13-1 with immunocytochemical
MAGE-A staining and hematoxylin counterstaining
(400× magnification). Most cells are stained by the
MAGE-A antibody. Some of the cells show a strong cytosolic
staining.
Tumour cell line PCI 1-1 with immunocytochemical MAGE-A staining and simultaneous hematoxylin counterstaining (400× magnification)Figure 8
Tumour cell line PCI 1-1 with immunocytochemical
MAGE-A staining and simultaneous hematoxylin
counterstaining (400× magnification). There is ubiqui-
tous cytosolic staining, and some strong cytosolic staining by
the MAGE-A Ab.
Tumour cell line PCI 52 with immunocytochemical MAGE-A staining and simultaneous hematoxylin counterstaining (400× magnification)Figure 9
Tumour cell line PCI 52 with immunocytochemical
MAGE-A staining and simultaneous hematoxylin
counterstaining (400× magnification). There is a ubiqui-
tous cytosolic staining with simultaneous strong staining of
the cell membranes.
Tumour cell line PCI 68-1 with immunocytochemical MAGE-A staining and simultaneous hematoxylin counterstaining (400× magnification)Figure 10
Tumour cell line PCI 68-1 with immunocytochemical
MAGE-A staining and simultaneous hematoxylin
counterstaining (400× magnification). No staining with
MAGE-A Ab of this tumour cell line was observed.
Head & Face Medicine 2009, 5:10 />Page 7 of 9
(page number not for citation purposes)
cytosol. The staining rate was about 100%. About 15% of
the cells showed a stronger staining by mAb 57B.
The single qrt-PCR measurements listed in Table 2 were
averaged for more a concise analysis.
Discussion
The results are in accordance with reports in literature on
the multiple expression of MAGE-A antigens in tumour
cells that were harvested from primary solid can-
cers[10,12]. It was also possible to amplify MAGE-A anti-
gens from the adult keratinocyte cell line NHEK in very
low levels compared to the tumour cell lines. This might
depend on the amplification cycles that facilitate the
detection of very small amounts of those antigens. In
immuncytochemistry those antigens were not detectable
in NHEK. This corresponds with own results of immuno-
histochemical stainings in benign lesions of the oral
mucosa, that did not show any MAGE-A antigens (data
not shown). Among the five cell lines, only one expressed
a single MAGE-A antigen. Three cell lines expressed 3 anti-
gens, one cell line (PCI 13-1) showed an additional insig-
nificant expression of a fourth antigen (MAGE-A4, 1.58
a.u.), and one cell line expressed 4 MAGE-A antigens. This
proves that simultaneous heterogeneous expression of
MAGE-A antigens is the rule and not the exception. The
antigens show different expression patterns. Up until
now, knowledge about the function of single MAGE-A
gene products has been very limited[14]. Therefore, it is
necessary to assess their function in regards to the course
of disease and the prognosis. With this study on hand, fur-
Tumour cell line PCI 9-1 with immunocytochemical MAGE-A staining and simultaneous hematoxylin counterstaining (400× magnification)Figure 11
Tumour cell line PCI 9-1 with immunocytochemical
MAGE-A staining and simultaneous hematoxylin
counterstaining (400× magnification). There is some
weak cytosolic staining with sporadic stronger cytosolic
staining with MAGE-A Ab.
Table 2: The table depicts the quantitative expression of the
examined MAGE-A antigens in relation to the reference cell line
of the adult keratinocytes (NHEK).
MAGE NHEK 13-1 68-1 1-1 52 9-1
A2 1,00 12,18 1,67 11,74 4,24 14,46
1,00 13,49 0,07 9,22 3,33 10,68
1,00 8,71 1,10 6,67 2,00 6,86
M 1,00 11,46 0,95 9,21 15,39 10,67
A3 1,00 14,90 3,46 15,97 5,90 16,80
1,00 7,30 2,21 6,60 1,90 4,60
1,00 7,62 3,24 6,70 2,66 5,23
M 1,00 9,94 2,97 9,76 3,49 8,88
A4 1,00 2,09 0,93 0,51 20,07 0,19
1,00 1,30 1,41 0,96 1,64 0,65
1,00 1,34 0,83 0,46 26,17 0,29
M 1,00 1,58 1,06 0,65 15,96 0,37
A6 1,00 98,53 2,43 114,00 38,93 197,00
1,00 47,68 0,92 38,89 9,59 29,95
1,00 42,15 0,16 40,73 6,40 30,62
M 1,00 62,79 1,17 64,54 18,31 85,86
A10 1,00 0,05 0,38 0,29 0,02 0,05
1,00 0,223 0,382 0,292 0,024 0,05
1,00 0,173 1,093 0,278 0,091 0,337
M 1,00 0,15 0,62 0,29 0,05 0,15
(M = mean)
Head & Face Medicine 2009, 5:10 />Page 8 of 9
(page number not for citation purposes)
ther testing (e.g. for apoptosis or mitosis) in the examined
cell lines in correlation with the expression of specific
MAGE-A antigens is feasible. In the literature, there have
been some remarks on the negative and positive influ-
ences of MAGE-A antigens on the course of cancer. The
MAGE-A2 and MAGE-A6 gene products have been
reported to bind to p53 (MAGE-A2 and MAGE-A6) and
p73 (MAGE-A2) and to impair their function. This causes
increased cell growth and decreased apoptosis[15,16] and
leads to an increased resistance against chemotherapeu-
tics (e.g. taxanes)[17,18]. These antigens were the most
highly expressed antigens in the cell lines examined. They
were found at significant levels in all tumour cell lines
except PCI 68-1, and did not correspond to a T-(T2–T4) or
N-stage (N0–N3) of the primary tumour tissue. Despite
these criteria, the PCI 68-1 primary tumour tissue had the
most differentiated cells (G1). Perhaps this might corre-
late with the missing expression of the MAGE-A antigens,
but this has to be investigated in further studies. The
expression of MAGE-A antigens depends on the demeth-
ylation of the promoter region[19]. Demethylation might
be correlated with a higher degree of cell de-differentia-
tion (G2 or G3)[19].
A higher expression of MAGE-A3 reduces the responsive-
ness of tumour cells to doxorubicin[17]. This antigen was
expressed with at least borderline values in all tumour cell
lines examined. Although doxorubicin is not a first-line
antineoplastic agent for head and neck squamous cell car-
cinomas, these findings might be worthy of further inves-
tigations, as this could be one explanation, among others
(e.g. sufficient levels of interferon-inducible protein
IFI16)[20], for reduced responsiveness to doxorubicin.
A contradictory result is achieved by an elevated expres-
sion of MAGE-A4. Its gene product binds to the tumour
protein gankyrin, which has a destabilising effect on retin-
oblastoma protein (pRb). Gankyrin binding to pRb
results in its hyperphosphorylation, release of the E2F
transcription factors, activation of DNA synthesis genes
and unscheduled entry into the cell cycle[21,22]. Further-
more, it inhibits apoptosis by degradation of p53[23].
Binding of the MAGE-A4 gene product to gankyrin pRb is
not destabilized, and degradation of p53 is reduced, The
consequence of which is suppression of adhesion-inde-
pendent tumour cell growth and formation of tumour cell
clustering[21-24]. In our analyses, MAGE-A4 was only sig-
nificantly expressed in tumour cell line PCI 52
(pT2N0M0G2). It was co-expressed with MAGE-A2, -A3
and -A6. This offers the opportunity to study the different
behaviour of this tumour cell line as compared to other
tumour cell lines expressing only MAGE-A2, -A3 and -A6.
In these examinations, further determination of the role
of MAGE-A4 in the progression and prognosis of oral
squamous cell carcinoma might be possible.
In contrast to other investigators[10], no increased expres-
sion of MAGE-A10 was found in the tumour cell lines
examined. This finding has to be verified in further stud-
ies. This is underlined especially in regard to an elevated
expression of MAGE-A10 in a previous study of the
authors in fetal keratinocytes[25].
In conclusion, oral and pharyngeal squamous cell carci-
noma cell lines were found to express MAGE-A antigens.
The MAGE-A antigens are expressed in groups of different
antigens. This finding is supported by the litera-
ture[10,12]. The physiological functions of the MAGE-A
gene products in cell differentiation and their possible
implications on the course of cancerous disease and its
prognosis are still unknown[9]. With the values presented
in this study, further examinations regarding the functions
of the MAGE antigens are possible. Furthermore, the evi-
dence of these antigens makes them still interesting as
possible targets for immunotherapy.
Competing interests
The authors declare that they have no competing interests.
Authors' contributions
UMR: study design, drafting of manuscript; AD: labora-
tory studies; TR: manuscript revision; JK: manuscript revi-
sion; TR: manuscript revision; OD: study design,
manuscript revision
Acknowledgements
The authors would like to thank Dr. Michael Kochel and
Professor Alexander C Kübler for their assistance revising
the manuscript.
References
1. Ochsenbein AF: Immunological ignorance of solid tumors.
Springer Semin Immunopathol 2005, 27(1):19-35.
2. Zitvogel L, Tesniere A, Kroemer G: Cancer despite immunosur-
veillance: immunoselection and immunosubversion. Nat Rev
Immunol 2006, 6(10):715-27.
3. Ferris RL: Progress in head and neck cancer immunotherapy:
can tolerance and immune suppression be reversed? ORL J
Otorhinolaryngol Relat Spec 2004, 66(6):332-40.
4. Melchionda F, McKirdy MK, Medeiros F, Fry TJ, Mackall CL: Escape
from immune surveillance does not result in tolerance to
tumor-associated antigens. J Immunother 2004, 27(5):329-38.
5. Suri A: Cancer testis antigens–their importance in immuno-
therapy and in the early detection of cancer. Expert Opin Biol
Ther 2006, 6(4):379-89.
6. Simpson AJ, Caballero OL, Jungbluth A, Chen YT, Old LJ: Cancer/
testis antigens, gametogenesis and cancer. Nat Rev Cancer
2005, 5(8):615-25.
7. Scanlan MJ, Simpson AJ, Old LJ: The cancer/testis genes: review,
standardization, and commentary. Cancer Immun 2004, 4:1.
8. Scanlan MJ, Gure AO, Jungbluth AA, Old LJ, Chen YT: Cancer/testis
antigens: an expanding family of targets for cancer immuno-
therapy. Immunol Rev 2002, 188:22-32.
9. Costa FF, Le Blanc K, Brodin B: Cancer/Testis antigens, stem
cells and cancer. Stem Cells 2007, 25(3):707-11.
10. Figueiredo DL, Mamede RC, Proto-Siqueira R, Neder L, Silva WA Jr,
Zago MA: Expression of cancer testis antigens in head and
neck squamous cell carcinomas. Head Neck 2006, 28(7):614-9.
Publish with Bio Med Central and every
scientist can read your work free of charge
"BioMed Central will be the most significant development for
disseminating the results of biomedical research in our lifetime."
Sir Paul Nurse, Cancer Research UK
Your research papers will be:
available free of charge to the entire biomedical community
peer reviewed and published immediately upon acceptance
cited in PubMed and archived on PubMed Central
yours — you keep the copyright
Submit your manuscript here:
/>BioMedcentral
Head & Face Medicine 2009, 5:10 />Page 9 of 9
(page number not for citation purposes)
11. Kienstra MA, Neel HB, Strome SE, Roche P: Identification of NY-
ESO-1, MAGE-1, and MAGE-3 in head and neck squamous
cell carcinoma. Head Neck 2003, 25(6):457-63.
12. Ries J, Schultze-Mosgau S, Neukam F, Diebel E, Wiltfang J: Investiga-
tion of the expression of melanoma antigen-encoding genes
(MAGE-A1 to -A6) in oral squamous cell carcinomas to
determine potential targets for gene-based cancer immuno-
therapy. Int J Oncol 2005, 26(3):817-24.
13. Juretic A, Spagnoli GC, Schultz-Thater E, Sarcevic B: Cancer/testis
tumour-associated antigens: immunocytochemical detec-
tion with monoclonal antibodies. Lancet Oncol 2003, 4(2):104-9.
14. Barker PA, Salehi A: The MAGE proteins: emerging roles in cell
cycle progression, apoptosis, and neurogenetic disease. J
Neurosci Res 2002, 67(6):705-12.
15. Giono LE, Manfredi JJ: The p53 tumor suppressor participates
in multiple cell cycle checkpoints. J Cell Physiol 2006,
209(1):13-20.
16. Jungbluth AA, Ely S, DiLiberto M, Niesvizky R, Williamson B, Frosina
D, Chen YT, Bhardwaj N, Chen-Kiang S, Old LJ, Cho HJ: The can-
cer-testis antigens CT7 (MAGE-C1) and MAGE-A3/6 are
commonly expressed in multiple myeloma and correlate
with plasma-cell proliferation. Blood 2005, 106(1):167-74.
17. Duan Z, Duan Y, Lamendola DE, Yusuf RZ, Naeem R, Penson RT, Sei-
den MV: Overexpression of MAGE/GAGE genes in paclitaxel/
doxorubicin-resistant human cancer cell lines. Clin Cancer Res
2003, 9(7):2778-85.
18. Monte M, Simonatto M, Peche LY, Bublik DR, Gobessi S, Pierotti MA,
Rodolfo M, Schneider C: MAGE-A tumor antigens target p53
transactivation function through histone deacetylase
recruitment and confer resistance to chemotherapeutic
agents. Proc Natl Acad Sci USA 2006, 103(30):11160-5.
19. Wischnewski F, Pantel K, Schwarzenbach H: Promoter demethyl-
ation and histone acetylation mediate gene expression of
MAGE-A1, -A2, -A3, and -A12 in human cancer cells. Mol Can-
cer Res 2006, 4(5):339-49.
20. De Andrea M, Gioia D, Mondini M, Azzimonti B, Reno F, Pecorari G,
Landolfo V, Tommasino M, Accardi R, Herold-Mende C, Landolfo S,
Gariglio M: Effects of IFI16 overexpression on the growth and
doxorubicin sensitivity of head and neck squamous cell car-
cinoma-derived cell lines.
Head Neck 2007, 29(9):835-44.
21. Higashitsuji H, Itoh K, Nagao T, Dawson S, Nonoguchi K, Kido T,
Mayer RJ, Arii S, Fujita J: Reduced stability of retinoblastoma
protein by gankyrin, an oncogenic ankyrin-repeat protein
overexpressed in hepatomas. Nat Med 2000, 6(1):96-9.
22. Higashitsuji H, Liu Y, Mayer RJ, Fujita J: The oncoprotein gankyrin
negatively regulates both p53 and RB by enhancing proteas-
omal degradation. Cell Cycle 2005, 4(10):1335-7.
23. Dawson S, Higashitsuji H, Wilkinson AJ, Fujita J, Mayer RJ: Gankyrin:
a new oncoprotein and regulator of pRb and p53. Trends Cell
Biol 2006, 16(5):229-33.
24. Nagao T, Higashitsuji H, Nonoguchi K, Sakurai T, Dawson S, Mayer
RJ, Itoh K, Fujita J: MAGE-A4 interacts with the liver oncopro-
tein gankyrin and suppresses its tumorigenic activity. J Biol
Chem 2003, 278(12):10668-74.
25. Müller-Richter UDA, Dowejko A, Zhou W, Reichert TE, Driemel O:
Different Expression of MAGE-A-Antigens in fetal and adult
keratinocyte cell lines. Oral Oncol 2008, 44(7):628-33.