Estuarine Research, Monitoring, and Resource Protection - Chapter 4 ppsx
Bạn đang xem bản rút gọn của tài liệu. Xem và tải ngay bản đầy đủ của tài liệu tại đây (1.14 MB, 50 trang )
Case Study 3
1960_book.fm Page 117 Friday, August 15, 2003 1:37 PM
Copyright © 2004 CRC Press, LLC
119
4
Delaware National
Estuarine Research Reserve
INTRODUCTION
The National Oceanic and Atmospheric Administration (NOAA) designated the
Delaware National Estuarine Research Reserve (DNERR) as a National Estuarine
Research Reserve System (NERRS) program site on July 21, 1993. The DNERR
consists of two well-deÞned component sites about 32 km apart (see Figure 4.1):
1. The Lower St. Jones River Reserve site located south of Dover in east-
central Kent County, Delaware
2. The Upper Blackbird Creek Reserve site located between Odessa and
Smyrna in southern New Castle County, Delaware
Both the Lower St. Jones River Reserve site and the Upper Blackbird Creek
Reserve site are subestuaries of the Delaware River estuary. Tidal marshes and tidal
streams comprise the primary habitats of both reserve sites.
The Lower St. Jones River Reserve site covers a 1518-ha area along the lower
8.8-km portion of the St. Jones River watershed. Here, agricultural land use pre-
dominates in the watershed. The St. Jones River stretches for 16.8 km across the
Delmarva Peninsula, and it discharges to the mid–Delaware Bay zone. The Trunk
Ditch, Beaver Branch, and Cypress Branch are the largest tributaries of the Lower
St. Jones River, which is characterized by mesohaline salinity conditions. The lower
boundary of the reserve site extends 3.2 km into the open waters of Delaware Bay;
it encompasses a 1036-ha area of subtidal bottom.
The Upper Blackbird Creek Reserve site, which covers an area of 477 ha, lies
~9.0 to 18.5 km upstream of the Blackbird Creek mouth. This site is characterized
by low salinity brackish or freshwater tidal creek habitat. Woodlots, croplands, and
upland Þelds also occur within the designated boundaries of the reserve. Forested
wetlands with coastal plain ponds blanket much of the land area upstream of the
reserve site, notably in the Blackbird State Forest. Forested and agricultural land
cover dominates much of the Blackbird Creek watershed. Extensive tidal mud ßats
and
Spartina
marshes border Blackbird Creek bayward of the Beaver Branch trib-
utary in the upper creek segment.
This chapter provides an overview of the DNERR based in large part on pub-
lished reports of the Delaware Department of Natural Resources and Environmental
Control (1993, 1994, 1995, 1999) and the U.S. Environmental Protection Agency
(Dove and Nyman, 1995; Sutton et al., 1996). The estuarine proÞle of the DNERR
is a particularly important source of information on the reserve.
1960_book.fm Page 119 Friday, August 15, 2003 1:37 PM
Copyright © 2004 CRC Press, LLC
120
Estuarine Research, Monitoring, and Resource Protection
LOWER ST. JONES RIVER RESERVE SITE
W
ATERSHED
More than 50,000 people reside in the 233-km
2
area of the St. Jones River watershed.
Development is greatest in the middle and upper watershed, being highly concen-
trated in the urbanized area of Dover, Delaware. Considering the entire St. Jones
River watershed, approximately 48% of the land use cover is agriculture, 25%
developed, 14% wetlands, 10% forested land, and 3% open water. Impervious land
cover in the watershed amounts to nearly 25%. Within the reserve area, most of the
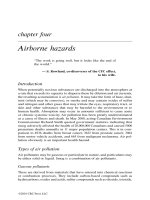
FIGURE 4.1
Map of the Delaware National Estuarine Research Reserve showing the location
of the Upper Blackbird Creek and the Lower St. Jones River DNERR sites. (From the
Delaware Department of Natural Resources and Environmental Control. 1999. Delaware
National Estuarine Research Reserve: Estuarine ProÞles. Technical Report, Delaware Depart-
ment of Natural Resources and Environmental Control, Dover, DE.)
Pennsylvania
New Jersey
Maryland
Delaware
Atlantic Ocean
Delaware Bay
Legend
Major town
Major highway
DNERR Site
DNERR watershed
10 0 10 20 Kilometers
N
Wilmington
Newark
Odessa
Smyrna
Dover
Milford
Lewes
Georgetown
River DNERR
Lower St. Jones
Upper Blackbird
Creek DNERR
1960_book.fm Page 120 Friday, August 15, 2003 1:37 PM
Copyright © 2004 CRC Press, LLC
Delaware National Estuarine Research Reserve
121
land remains in private ownership despite the purchase of nearly 300 ha of wetland
and upland habitat by NERRS in 1991–1992.
The Lower St. Jones River Reserve site and Upper Blackbird Creek Reserve site
occur in the Atlantic Coastal Plain and are underlain by thick layers of unconsolidated
sediments and semi-consolidated sedimentary rocks. The terrane is gently sloping;
relief in the Lower St. Jones River Reserve ranges from sea level to 22 m. Soils in
the upland areas of both reserve sites consist of well-drained or moderately drained
sandy loams to poorly drained sandy–clay loams rich in organic matter. Because
tidal wetlands are extensive, tidal marsh soils predominate in large areas of the
reserve. These soils are composed of clay and sand layers mixed in many places
with mucky peat. They attain a thickness of nearly 30 m in the marsh habitat at the
mouth of the St. Jones River (DNERR, 1999).
Upland Vegetation
The Lower St. Jones River Reserve site supports two types of forest communities:
upland forest and tidal marsh forest. Principal species of the upland forest community
are the white oak (
Quercus alba
), southern red oak (
Q. falcata
), sassafras (
Sassafras
albidum
), black cherry (
Prunus serotina
), American beech (
Fagus grandifolia
),
American holly (
Ilex opaca
), black haw (
Viburnum prunifolium
), and tulip tree
(
Liriodendron tulipifera
). The tidal swamp forest community includes red cedar
(
Juniperus virginiana
), red maple (
Acer rubrum
), black gum (
Nyssa sylvatica
), sweet
gum (
Liquidambar styracißua
), green ash (
Fraxinus pennsylvanica
), and willows
(
Salix
spp.). Farmland, old Þelds, and mixed deciduous hardwood forests comprise
most of the upland land cover.
Wetland Vegetation
Forested wetland vegetation, scrub forest, and scrub–marsh mixes deÞne the marsh
habitat along the St. Jones River, with 66 species of plants reported (Wetlands
Research Associates and Environmental Consulting Services, 1995) (Table 4.1).
Mixed associations of emergent vegetation typify tidal wetland habitat of the Lower
St. Jones River Reserve site. Emergent vegetation of high marsh areas exhibits
greater diversity of plant assemblages than that of low marsh areas. The smooth
cordgrass (
Spartina alternißora
) is the dominant species of the tidal marsh, covering
62.2% of the Lower St. Jones River Reserve wetlands area (Table 4.2). Tall-form
S.
alternißora
grows along tide-channel banks, and short-form
S. alternißora
spreads
across broad expanses of intertidal habitat. The big cordgrass (
S. cynosuroides
) is
also found along channel edges. Marsh edaphic algae (diatoms) in the top few
millimeters of marsh sediments constitute a valuable food source for Þsh and other
fauna of the salt marsh system. Pickerel weed (
Ponderia cordata
), marshpepper
smartweed (
Polygonum hydropiper
), and swamp rose mallow (
Hibiscus palustris
)
are subdominants within the cordgrass communities. Above mean high water
(MHW), salt meadow cordgrass (
Spartina patens
) and salt grass (
Distichlis spicata
)
concentrate in patches, most conspicously immediately below the border areas of
the upper marsh.
1960_book.fm Page 121 Friday, August 15, 2003 1:37 PM
Copyright © 2004 CRC Press, LLC
122
Estuarine Research, Monitoring, and Resource Protection
TABLE 4.1
Taxonomic List of Plants Identified in St. Jones River
Marshes
Common Name Scientific Name
Red maple
Acer rubrum
Ground nut
Apios americana
Orach
Atriplex patula
Grounsel bush
Baccharis halimifolia
Hedge bindweed
Calystegia sepium
Winged sedge
Carex alata
Greenish-white sedge
Carex albolutescens
Lone sedge
Carex lonchocarpa
Lurid sedge
Carex lurida
Uptight sedge
Carex stricta
Bitternut hickory
Carya cordiformis
Buttonbush
Cephalanthus occidentalis
Water hemlock or spotted cowbane
Cicuta maculata
Sweet pepperbush
Clethra alnifolia
Canker root
Coptis trifolia
Persimmon tree
Diospyros virginiana
Salt grass
Distichlis spicata
Spikerush
Eleocharis ambigens
American beech
Fagus grandifolia
Green ash
Fraxinus pennsylvanicus
Common madder
Galium tinctorium
Manna grass
Glyceria stricta
Swamp rose mallow
Hibiscus palustris
Many-ßowered pennywort
Hydrocotyle umbellata
Inkberry
Ilex glabra
American holly
Ilex opaca
Winterberry
Ilex verticillata
Jewel weed
Impatiens capensis
Marsh elder
Iva frutescens
Black walnut
Juglans nigra
Red cedar
Juniperus virginiana
Rice cutgrass
Leersia oryzoides
Sweet gum
Liquidambar styracißua
Japanese honeysuckle
Lonicera japonica
Sweet bay magnolia
Magnolia virginiana
Yellow pond lily
Nuphar lutea
Black gum
Nyssa sylvatica
Cinnamon fern
Osmunda cinnamomea
Royal fern
Osmunda regalis
Arrow arum
Peltandra virginica
Common reed
Phragmites australis
Black bindweed
Polygonum convolvulus
1960_book.fm Page 122 Friday, August 15, 2003 1:37 PM
Copyright © 2004 CRC Press, LLC
Delaware National Estuarine Research Reserve
123
Marsh shrub communities proliferate in higher marsh areas. Two types of shrub
communities are evident:
1. Fresher, lower salinity tidal communities
2. Brackish, higher salinity tidal communities
Woody plants dominate the lower salinity tidal communities; smooth alder
(
Alnus serrulata
), winterberry (
Ilex verticillata
), buttonbush (
Cephalanthus occiden-
talis
), sweet pepperbush (
Clethra alnifolia
), and dogwoods (
Cornus
spp.) are plant
species commonly observed here. In higher salinity tidal communities, the predom-
inant marsh shrubs include the marsh elder (
Iva frutescens
) and groundsel bush
Black cherry
Prunus serotina
Mock bishopweed
Ptilimnium capillaceum
Willow oak
Quercus phellos
Swamp honeysuckle
Rhododron viscosum
Multißora rose
Rosa multißora
Swamp rose
Rosa palustris
Swampdock
Rumex verticillatus
Saltwort
Salsola kali
Common elderberry
Sambucus canadensis
American three-square
Scirpus americanus
Saltmarsh bulrush
Scirpus robustus
Giant bulrush
Scirpus validus
Sawbriar
Smilax glauca
Smooth cordgrass
Spartina alternißora
Big cordgrass
Spartina cynosuroides
Saltmeadow cordgrass
Spartina patens
Skunk cabbage
Symplocarpus foetides
Tall meadow-rue
Thalictrum pubescens
Poison ivy
Toxicodendron radicans
Narrow-leaf cattail
Typha angustifolia
Broad-leaf cattail
Typha latifolia
Highbush blueberry
Vaccinium corumbosum
Northern arrowwood
Viburnum recognitum
Black haw
Viburnum prunißoloium
Source:
From the Delaware Department of Natural Resources and Envi-
ronmental Control. 1999. Delaware National Estuarine Research
Reserve: Estuarine ProÞles. Technical Report, Delaware Department of
Natural Resources and Environmental Control, Dover, DE.
TABLE 4.1 (CONTINUED)
Taxonomic List of Plants Identified in St. Jones River
Marshes
Common Name Scientific Name
1960_book.fm Page 123 Friday, August 15, 2003 1:37 PM
Copyright © 2004 CRC Press, LLC
124
Estuarine Research, Monitoring, and Resource Protection
(
Baccharis halimifolia
). Red cedar (
Juniperus virginiana
) is also evident in the
brackish tidal communities.
Deep-water emergents form a low-marsh mixed association along the edges of
creeks and ponds. Comprising this plant association are arrow arum (
Peltandra
virginica
), yellow pondweed (
Nuphar lutea
), marshpepper smartweed (
Polygonum
hydropiper
), and pickerel weed (
Ponderia cordata
). Dense monospeciÞc stands of
yellow pondweed occur in some areas.
The common reed (
Phragmites australis
), an invasive species, inhabits fresh
and brackish marshes along marsh upland borders. This nuisance species has spread
most rapidly in the Upper Blackbird Creek marshes but also has been documented
in more restricted areas along the upland edge and major river banks of the Lower
St. Jones River Reserve site. Increasing distribution of the common reed in reserve
marshes is a growing concern because this species generally degrades coastal
wetland habitat values for wildlife. Efforts to control the spread of
Phragmites
in
the DNERR have consisted of aerial herbicide spraying followed by prescribed
burning. However, this species is resilient, and its persistent monotypic stands
remain a target for various remedial programs. Monotypic stands of
Phragmites
currently cover about 10 to 15% of Delaware’s tidal wetlands (DNREC, 1993).
Three other emergent wetland plant communities exist in the DNERR:
Typha
spp.,
Scirpus americanus
, and
Zizania aquatica
communities. Although relatively
TABLE 4.2
Vegetation Cover in Wetlands of the Delaware National Estuarine
Research Reserve
Upper Blackbird Creek
Lower St. Jones River
Map Unit Percent Cover Map Unit Percent Cover
Spartina alternißora 28.64 Spartina alternißora 62.23
Tidal ßat 26.44 Phragmites australis 13.38
Open water 14.21 Impoundment 7.54
Phragmites australis 11.05 Open water 7.03
Spartina alternißora mix 4.74 Marsh shrub 3.63
Tidal swamp forest 4.20 Salt hay 2.37
Marsh shrub 3.64 Spartina cynosuroides 1.68
Spartina cynosuroides 2.72 Tidal swamp forest 0.92
Typha spp. 1.53 Tidal ßat 0.72
Zizania aquatica 1.09 Marsh shrub 0.43
Peltandra virginica 0.96 Typha (latifolia/angustifolia) 0.04
Ponderia cordata 0.44 Scirpus americanus 0.02
Impoundment 0.30 Atriplex triangularis 0.01
Nuphar lutea 0.04 Peltandra virginica 0.01
Scirpus americanus 0.01
Source: From the Delaware Department of Natural Resources and Environmental Control. 1999.
Delaware National Estuarine Research Reserve: Estuarine ProÞles. Technical Report, Delaware
Department of Natural Resources and Environmental Control, Dover, DE.
1960_book.fm Page 124 Friday, August 15, 2003 1:37 PM
Copyright © 2004 CRC Press, LLC
Delaware National Estuarine Research Reserve 125
minor emergent wetland components, these communities provide important hab-
itat for a number of animal populations such as muskrats (Ondatra zibethicus)
and an array of bird species. Two cattail species (Typha angustifolia and T.
latifolia) have been documented in Typha communities of the reserve. The cattails
may be present as monospeciÞc stands or a mixed community with a number of
co-dominants (i.e., smooth cordgrass, Spartina alternißora; rice cutgrass, Leersia
oryzoides; salt marsh water hemp, Acnida cannabina; and nodding bur-marigold,
Bidens cernua). Emergent plants of the Scirpus community grow along brackish
shorelines as either monotypic stands of the American three-square (Scirpus
americanus) or a mixed community with a few other common marsh plants (i.e.,
Spartina alternißora, S. patens, and Distichlis spicata). Extensive monospeciÞc
stands of wild rice comprise the Zizania aquatica community, which proliferates
in fresh to slightly brackish water areas.
AQUATIC HABITAT
The lower 8.8-km section of the St. Jones River site is a medium-salinity tidal river
subjected to semidiurnal tides. The mean tidal range at the mouth of the river amounts
to about 1.5 m; at spring tide, however, the mean tidal range averages 1.7 m.
SigniÞcant tidal range attenuation occurs upriver.
The channel width of the Lower St. Jones River at the site of the reserve ranges
from ~40 to 90 m. Mid-channel depths at low tide along this stretch of the river
range from ~2.4 to 5.5 m. The highest current velocities are recorded in the lower
segment of the river. Here, maximum current velocities observed during spring
tides and neap tides are ~30 to 40 and ~20 to 30 cm/sec, respectively. The water
column is relatively well mixed, with little evidence of two-layered estuarine ßow.
Hence, ßow is mainly unidirectional from surface to bottom in the lower river
with slight differences (10 to 20%) in current velocity observed throughout the
water column.
Water Quality
A YSI Model 6000 data logger deployed at Scotton Landing in the middle reach
of the Lower St. Jones River during 1996 recorded physical–chemical data semi-
continuously (every 30 min) year-round. The water quality parameters monitored
were temperature, salinity, dissolved oxygen, pH, turbidity, and depth (Figure 4.2
and Figure 4.3). The absolute temperature over the annual period at the Scotton
Landing site ranged from less than 0 to 30°C. The monthly mean water temper-
ature, in turn, ranged from less than 0°C in February to 25.5°C in August. The
annual salinity range in the middle reach of the river ranged from ~1‰ to more
than 20‰. Mean monthly salinity values ranged from ~3‰ in December to more
than 12‰ in September. Waters in the Lower St. Jones River are generally clas-
siÞed as mesohaline.
Annual dissolved oxygen values (% saturation) varied from less than 20% to
more than 120% saturation. The monthly mean dissolved oxygen, however, ranged
from more than 40% in July to more than 80% in March. Hypoxic events were also
1960_book.fm Page 125 Friday, August 15, 2003 1:37 PM
Copyright © 2004 CRC Press, LLC
126 Estuarine Research, Monitoring, and Resource Protection
documented during the summer months. Absolute dissolved oxygen measurements
varied from 0 to 14.9 mg/l. The monthly mean absolute dissolved oxygen values
ranged from ~4 mg/l (July) to 10 mg/l (March). The mean annual dissolved oxygen
value was 6.45 mg/l.
FIGURE 4.2 Comparison of monthly mean water temperature, pH, speciÞc conductivity, and
salinity for Blackbird Landing and Scotton Landing in 1996. (From the Delaware Department
of Natural Resources and Environmental Control. 1999. Delaware National Estuarine
Research Reserve: Estuarine ProÞles. Technical Report, Delaware Department of Natural
Resources and Environmental Control, Dover, DE.)
Jan.
Feb.
Mar.
Apr.
May
June
July
Aug.
Sept.
Oct.
Nov.
Dec.
30
25
20
15
10
5
0
Temperature (C)
Water Temperature
Jan.
Feb.
Mar.
Apr.
May
June
July
Aug.
Sept.
Oct.
Nov.
Dec.
30
25
20
15
10
5
0
-5
Temperature (C)
Water Temperature
Jan.
Feb.
Mar.
Apr.
May
June
July
Aug.
Sept.
Oct.
Nov.
Dec.
8
7.5
7
6.5
6
8
7.5
7
6.5
6
pH
pH
Jan.
Feb.
Mar.
Apr.
May
June
July
Aug.
Sept.
Oct.
Nov.
Dec.
4
3.5
2.5
2
1.5
0.5
3
1
0
Specific Conductivity (%)
Specific Conductivity
Jan.
Feb.
Mar.
Apr.
May
June
July
Aug.
Sept.
Oct.
Nov.
Dec.
2.5
2
1.5
1
0.5
0
Salinity (ppt)
Salinity
Jan.
Feb.
Mar.
Apr.
May
June
July
Aug.
Sept.
Oct.
Nov.
Dec.
14
12
10
8
6
4
2
0
Salinity (ppt)
Salinity
Jan.
Feb.
Mar.
Apr.
May
June
July
Aug.
Sept.
Oct.
Nov.
Dec.
25
15
20
10
5
0
Specific Conductivity (%)
Specific Conductivity
Jan.
Feb.
Mar.
Apr.
May
June
July
Aug.
Sept.
Oct.
Nov.
Dec.
pH
pH
Blackbird Landing
Scotton Landing
1960_book.fm Page 126 Friday, August 15, 2003 1:37 PM
Copyright © 2004 CRC Press, LLC
Delaware National Estuarine Research Reserve 127
The pH measurements at Scotton Landing for 1996 ranged from 6.01 to 8.87.
The mean pH value for the year was 7.02. Highest pH levels were observed in
March, and lowest pH levels were noted in June and July.
Turbidity generally ranged from 50 to 125 NTU, with highest levels (mean ~125
NTU) registered in September. However, spiked events of more than 500 NTU
FIGURE 4.3 Comparison of monthly mean water depth, dissolved oxygen, and turbidity for
Blackbird Landing and Scotton Landing in 1996. (From the Delaware Department of Natural
Resources and Environmental Control. 1999. Delaware National Estuarine Research Reserve:
estuarine proÞles. Technical Report, Delaware Department of Natural Resources and Envi-
ronmental Control, Dover, DE.)
Jan.
Feb.
Mar.
Apr.
May
June
July
Aug.
Sept.
Oct.
Nov.
Dec.
2
1.5
1
0.5
0
Water Depth (m)
Jan.
Feb.
Mar.
Apr.
May
June
July
Aug.
Sept.
Oct.
Nov.
Dec.
2
1.5
1
0.5
0
Water Depth (m)
Water Depth Water Depth
Jan.
Feb.
Mar.
Apr.
May
June
July
Aug.
Sept.
Oct.
Nov.
Dec.
12
10
8
6
4
2
0
Dissolved Oxygen (mg/l)
Dissolved Oxygen
Jan.
Mar.
May
July
Sept.
Nov.
100
80
60
40
20
0
100
80
60
40
20
0
Dissolved Oxygen (%)
Dissolved Oxygen
Jan.
Mar.
May
July
Sept.
Nov.
400
200
250
300
350
150
100
50
0
Turbidity (ntu)
Turbidity
Jan.
Mar.
May
July
Sept.
Nov.
150
125
100
50
25
0
Turbidity (ntu)
Turbidity
Jan.
Mar.
May
July
Sept.
Nov.
Dissolved Oxygen (%)
Dissolved Oxygen
Jan.
Feb.
Mar.
Apr.
May
June
July
Aug.
Sept.
Oct.
Nov.
Dec.
12
10
8
6
4
2
0
Dissolved Oxygen (mg/l)
Dissolved Oxygen
Blackbird Landing Scotton Landing
1960_book.fm Page 127 Friday, August 15, 2003 1:37 PM
Copyright © 2004 CRC Press, LLC
128 Estuarine Research, Monitoring, and Resource Protection
occasionally interrupted periods of relatively stable, low turbidity conditions. These
episodic events typically resulted from storms and elevated stormwater runoff, which
transported large concentrations of sediments and other particulate matter into the
system. The roiling of bottom sediments by high winds and other factors also
contributed to higher turbidity levels.
Water depth can inßuence the amount of turbidity in the water column because
bottom agitation and erosion of sediments may be substantially less in deeper
waters. At the Scotton Landing site, mean monthly water depths varied from about
1.3 to 1.7 m. The shallowest depths were reported in February and the deepest
depths in September.
An extensive water quality database on the DNERR for the period from 1996
through 2002 can be obtained over the Internet from the NERRS Centralized Data
Management OfÞce (CDMO). The CDMO database can be accessed at the following
Internet address: .
ANTHROPOGENIC IMPACTS
Pollution
The Delaware River estuary and its watershed have historically experienced signif-
icant alteration due to heavy industrialization and other human activities. A wide
array of anthropogenic problems, including excessive watershed development, point
and nonpoint source runoff, habitat loss and alteration, toxic chemical contaminants,
and degraded water quality (Sutton et al., 1996), potentially threatens the environ-
mental integrity of the system. The Delaware River watershed drains an area of
~33,000 km
2
, and more than 6 million people live in areas surrounding the estuary.
Poor development planning in the watershed has led to considerable population
pressure on habitats and resources in the system.
Water quality has been compromised in some areas of the Delaware Estuary due
to substantial loadings of nutrients, trace metals, volatile organics, polycyclic aro-
matic hydrocarbons (PAHs), and some chlorinated hydrocarbon compounds (Ken-
nish, 2000) (Tables 4.3 to 4.5). Water quality degradation in the estuary peaked
during the period from the 1940s to the 1960s as a consequence of rapid industri-
alization of the Delaware River basin, accelerated growth of major cities, and the
expansion of urban water and sewer systems. Water quality has generally improved
in the estuary since the 1970s through the application of environmental remediation
programs, as evidenced by increased dissolved oxygen and pH levels observed over
the past three decades.
Nutrient loading in the Delaware Estuary is higher than that in many other major
U.S. estuaries, such as the Chesapeake Bay; nitrogen loading in the estuary amounts
to ~7500 mmol N/m
2
/yr, and phosphorus loading, ~600 mmol P/m
2
/yr (Kennish,
2000). The total nitrogen concentration in the estuary (1.5 to 3 mg N/l) far exceeds
the phosphate concentration (~0.02 to 0.12 mg P/l) (Sutton et al., 1996). Heavy
metal concentrations are also elevated relative to those of other major estuarine
systems. Arsenic, chromium, copper, and lead loadings in the estuary are ~1 ¥ 10
5
kg/yr, while mercury loading is ~1 ¥ 10
4
kg/yr (Sutton et al., 1996). The loading of
1960_book.fm Page 128 Friday, August 15, 2003 1:37 PM
Copyright © 2004 CRC Press, LLC
Delaware National Estuarine Research Reserve 129
TABLE 4.3
Representative Toxic Substances of Concern in the Delaware
Estuary
Metals
Aluminum Chromium
a
Nickel
Arsenic
a
Copper
a
Selenium
Beryllium Lead
a
Silver
a
Cadmium Mercury
a
Zinc
a
Volatile Organics
Acrolein Chloroform Trichloroethene
Acrylonitrile 1,2-Dichloroethane
a
Vinyl chloride
Benzene Tetrchloroethene
a
Carbon tetrachloride Toluene
Nonvolatile Organics
Polycyclic Aromatic Hydrocarbons (PAHs)
a
Acenaphthene Benzopyrenes Fluorenes
Acenaphthylene Biphenyl Indeno [1,2,3-c,d] pyrene
Anthracene Chrysene Naphthalene
Benzo [a] anthracene Dibenzo [a,h] anthracene Perylene
Benzoßuoranthenes Dibenzothiophene Phenanthrene
Benzo [g,h,i] perylene Fluoranthene Pyrene
Organochlorines
Chlorinated Pesticides
Aldrin Endosulfan Pentachlorophenol
Chlordane
a
Heptachlor Toxaphene
DDT and its metabolites
a
Hexachlorobenzene Endrin
Dieldrin
a
Mirex
Polychlorinated Biphenyls (PCBs)
Others
Dinitrophenol Nitrophenol
Nitrobenzene Phenol
a
These substances were named to the preliminary list of toxic pollutants of concern
by the Delaware Estuary Program’s Toxics Task Force.
Source: Sutton, C.C., J.C. O’Herron, III, and R.T. Zappalorti. 1996. The ScientiÞc
Characterization of the Delaware Estuary. Technical Report (DRBC Project No. 321;
HA File No. 93.21), Delaware Estuary Program, U.S. Environmental Protection
Agency, New York.
1960_book.fm Page 129 Friday, August 15, 2003 1:37 PM
Copyright © 2004 CRC Press, LLC
130 Estuarine Research, Monitoring, and Resource Protection
TABLE 4.4
Loading of Toxic Substances to the Delaware Estuary
Contaminant
Source Percent of
Total
LoadingPS
a
UR
a
AR
a
AD
a
As 43.8/7.3 8.9/3.2 46.6/92 0.7/2.0 10.4
Cr 87.4/20.1 11.6/5.8 — 1.0/3.8 14.3
Cu 82.1/18.7 15.6/7.7 — 2.3/9.0 14.2
Pb 70.3/13.2 24.5/10.0 — 5.2/16.9 11.7
Hg 10.1/0.2 10.1/0.3 — 79.8/20.2 0.9
Ag 100.0/2.2 — — — 1.4
Zn 52.6/33.4 43.5/59.8 — 4.0/43.6 39.6
PAH—95.1/10.6 — 4.9/4.4 3.2
Chlorinated pesticides 39.5/0.4 2.6/0.1 57.9/7.8 — 0.7
PCBs 66.7/<0.01 — — 33.3/0.1 <0.01
Volatile organics 79.0/4.5 21.0/2.6 — — 3.5
Percent of total loading by
source
62.3 28.8 5.2 3.6 99.9/99.9
Note: PS = point source; UR = urban source; AR = agricultural runoff; AD = atmospheric deposition.
a
Percent loading of a substance by source/percent contribution of a substance to loading from a source.
Source: Sutton, C.C., J.C. O’Herron, III, and R.T. Zappalorti. 1996. The ScientiÞc Characterization
of the Delaware Estuary. Technical Report (DRBC Project No. 321; HA File No. 93.21), Delaware
Estuary Program, U.S. Environmental Protection Agency, New York.
TABLE 4.5
Dissolved Trace Metal Concentrations in the Delaware River and Other
East Coast Rivers
Trace Metal (mg/l)
River Cd CoCuFeMnNi PbZn
Delaware 0.17 0.42 2.36 32.9 155 3.86 0.27 12.1
Susquehanna 0.089 1.0 1.21 57.3 655 5.75 0.21 2.62
Hudson 0.25 — 3.24 31.9 10.7 2.41 — 8.83
Connecticut 0.10 — 4.17 113 45.9 — — 0.98
Potomac ———————0.55
Southeastern
U.S. (Mean)
0.078 — 0.56 30.7 18 0.26 — 0.64
Source: Sutton, C.C., J.C. O’Herron, III, and R.T. Zappalorti. 1996. The ScientiÞc Characterization
of the Delaware Estuary. Technical Report (DRBC Project No. 321; HA File No. 93.21), Delaware
Estuary Program, U.S. Environmental Protection Agency, New York.
1960_book.fm Page 130 Friday, August 15, 2003 1:37 PM
Copyright © 2004 CRC Press, LLC
Delaware National Estuarine Research Reserve 131
PAHs equals 3.28 ¥ 10
4
kg/yr (Frithsen et al., 1995). Among organochlorine con-
taminants, PCBs and DDTs continue to be problematic. The loading of PCBs and
DDTs in the estuary is estimated to be 89 kg/yr and 7900 kg/yr, respectively (Frithsen
et al., 1995). Bottom sediments are a repository for the largest fraction of chemical
contaminants that enter the estuary. In some areas, the contaminants may pose a
signiÞcant health threat to some biota, particularly upper-trophic-level organisms
(Kennish, 2000).
Point and nonpoint source pollution contributes to the same water quality
problems in the Lower St. Jones River as observed in the Delaware River estuary,
including elevated levels of nutrients (nitrogen and phosphorus) and chemical
contaminants (heavy metals, hydrocarbons, and PCBs). For example, several indus-
trial facilities exist in the St. Jones River watershed where point source wastewater
discharges are regulated by the National Pollution Discharge Elimination System
(NPDES) of Delaware’s Department of Natural Resources and Environmental Con-
trol. The central sewer system in Dover, Delaware periodically releases sewage
waste in combined sewer overßows. However, the most persistent water quality
problems in the St. Jones River are ascribable to nonpoint source pollution from
both urban and rural areas in the St. Jones River watershed. Escalating urban land
use in the Dover area has increased pollutant export to the river via accelerated
stormwater runoff from impervious surfaces or residential landscapes. Nonpoint
source pollutant loads from Dover and surrounding areas originate largely from
construction sites, high-density commercial zones, and industrial centers; they
consist of heavy metals, oil and grease, organochlorine compounds, and other
contaminants. In more rural areas, agricultural runoff mainly associated with corn
and soybean production or animal feedlots transports nutrients and sediments to
the St. Jones River. In addition to nitrogen, phosphorus, and sediment inputs,
constituent loads of concern from farmlands include oxygen-demanding compounds
and pesticides. Aside from urban and agricultural runoff, the effects of silviculture,
land disposal, leaching of nutrients and coliform bacteria from septic Þelds, and
the atmospheric deposition of an array of contaminants augment pollutant inputs.
Nutrient loading is of particular concern because of its link to eutrophication of
estuarine waters (Kennish, 1997; Livingston, 2001, 2003).
The accumulation of PCBs in the St. Jones River watershed is a resource
management problem. A health advisory was issued on March 18, 1993 for all tidal
and several nontidal reaches of the St. Jones River watershed because of elevated
PCB levels in aquatic sediments and the food web. This advisory recommended
limited consumption (i.e., no more than two 226.8-g meals a year) of catÞsh (Ameiu-
rus catus, A. nebulosus, and Ictalurus punctatus), white perch (Morone americana),
carp (Cyprinus carpio), and largemouth bass (Micropterus salmoides) taken in the
upper portions of the St. Jones River downstream to Bowers Beach (DNERR, 1999).
The exact source of the PCBs remains undetermined.
Some biota throughout the Delaware Estuary have also accumulated high levels
of PCBs and other toxins (Sutton et al., 1996; Kennish, 2000). Owing to widespread
contamination by PCBs, DDTs, chlordane, dioxin, and mercury, consumption advi-
sories have been issued by government agencies for a number of Þsh species in the
estuary, notably blueÞsh (Pomatomus saltatrix), striped bass (Morone saxatilis),
1960_book.fm Page 131 Friday, August 15, 2003 1:37 PM
Copyright © 2004 CRC Press, LLC
132 Estuarine Research, Monitoring, and Resource Protection
white perch (Morone americana), American eel (Anguilla rostrata), white catÞsh
(Ameiurus catus), channel catÞsh (Ictalurus punctatus), and chain pickerel (Esox
niger). Apart from these ÞnÞsh species, other fauna exhibiting high concentrations
of certain toxins in the estuary are mussels (Mytilus edulis), oysters (Crassostrea
virginica), and osprey (Pandion haliaetus) (Kennish, 2000).
Habitat Alteration
The most profound alteration of upland habitat in the DNERR region is the conver-
sion of natural forested land cover to population centers and farmlands. These land
use conversions have contributed to various levels of habitat destruction and nonpoint
source pollution in the watershed. However, other land use conversions have also
impacted habitat and water quality in watershed areas. Included here are the devel-
opment of exurban residential subdivisions, installation of septic systems in envi-
ronmentally sensitive areas, construction of highways, operation of a major airbase,
creation of borrow pits for sand and gravel mining, and nonselective marsh ditching
for mosquito control (DNERR, 1999).
Dredging of the Delaware River main shipping channel deepens the waterway,
resulting in improved circulation of the estuary. Sharp et al. (1994) showed that, soon
after dredging, changes in salinity, dissolved oxygen, turbidity, and water quality occur
throughout the estuary. Upper estuary locations experience increased tidal amplitudes.
These changes may also inßuence water quality conditions in subestuaries such as the
St. Jones River. However, because the lower reserve site is a considerable distance
from the channel dredging areas, the dredging effects are likely to be small.
Shoreline erosion is an escalating problem along the Delaware River and Bay.
Rising sea level and wave erosion are threatening the wetland shoreline habitat in
the system. Principal shoreline protective measures implemented to control shoreline
erosion include the installation of permanent engineering structures such as bulk-
heads and seawalls. However, these shoreline structures alter or even destroy habitat
for turtles, horseshoe crabs, shorebirds, and various wildlife populations. In addition,
toxins (e.g., wood preservatives) that leach from the treated wooden structures can
contaminate adjacent waters and bottom sediments, thereby posing a potential danger
to organisms inhabiting these areas.
Three federal Superfund sites exist in the St. Jones watershed:
1. Dover Air Force Base
2. Wildcat LandÞll
3. Dover Gas Light Company
All have serious chemical contamination problems that can cause the degradation
of water quality offsite if leachates are not effectively controlled. Dover Air Force
Base has been responsible for signiÞcant groundwater contamination due to volatile
organic compounds (solvents and gasoline) and heavy metals derived from aircraft
operations on site. Tributaries of the St. Jones River have received groundwater
contaminated with pollutants from the base. However, no serious environmental
impacts have been attributed to this water contamination.
1960_book.fm Page 132 Friday, August 15, 2003 1:37 PM
Copyright © 2004 CRC Press, LLC
Delaware National Estuarine Research Reserve 133
The Wildcat LandÞll was a privately owned and operated industrial and
municipal waste disposal facility located about 3.7 km upstream of the Lower
St. Jones River Reserve site. The facility, which closed in 1973 due to permit
violations associated with illegal disposal of waste materials, caused contamina-
tion of surface water and sediments along the St. Jones River as a result of inputs
of PCBs and other toxins (DNREC, 1994). Since its closing, the landÞll has been
reclaimed for wildlife purposes. However, during its operation the landÞll may
have been a signiÞcant source of PCBs, which are now stored in bottom sediments
of the St. Jones River.
The Dover Gas Light Company was another source of PCB contamination in
the St. Jones River watershed during the 20th century. It also caused coal tar
contamination of soils and groundwater in the watershed. This site is located in
Dover, Delaware, and its impact may have been more problematic for the Lower St.
Jones River than for the upper reaches of the system (DNERR, 1999).
BIOTIC COMMUNITIES
Phytoplankton
Phytoplankton surveys conducted at three stations in the Lower St. Jones River
during 1995 and 1996 identiÞed 44 taxa, with most belonging to the Bacillario-
phyta (diatoms) (N = 24) and the Chlorophycota (green algae) (N = 10). The
numerically dominant taxa in decreasing order of abundance were Melosira spp.,
Guinardia spp., Ceratium spp., and Biddulphia spp. Three of these taxa (Melosira,
Guinardia, and Biddulphia) are diatoms. Volvox spp., Ankistrodesmus spp., Scene-
desmus spp., Chlamydomonas spp., Hydrodictyon spp., and Chlorella spp. were
the most abundant green algae, and Anabaena spp., Microcystis spp., and Oscil-
latoria spp. were the dominant blue-green algae. Table 4.6 provides a taxonomic
list of phytoplankton collected in both the Lower St. Jones River and Upper
Blackbird Creek (DNERR, 1999).
A distinct seasonal pattern of phytoplankton abundance and diversity occurs in
the Lower St. Jones River. Phytoplankton abundance here peaks in the summer and
drops to a minimum in the winter. Diatoms rank among the most abundant taxa
during all seasons. Maximum diversity takes place in the summer and minimum
diversity in the fall.
The phytoplankton community is much more diverse in the Delaware River
estuary, where more than 250 species and over 100 genera have been registered
(Marshall, 1992). Watling et al. (1979) documented 113 phytoplankton species
in Delaware Bay. Diatoms predominate from fall through spring, with several
species (Skeletonema costatum, Thalassiosira nordenskioldii, Asterionella gla-
cialis, Chaetoceras sp., and Rhizosolenia sp.) acting as the principal constituents
of the spring bloom (Watling et al., 1979; Marshall, 1992). Phytoplankton biomass
peaks in the lower estuary during March and in the upper estuary during July
(Pennock and Sharp, 1986). Phytoplankton diversity is highest in the summer
and fall when small ßagellates are most abundant in the estuary (Marshall, 1992,
1995; Kennish, 2000).
1960_book.fm Page 133 Friday, August 15, 2003 1:37 PM
Copyright © 2004 CRC Press, LLC
134 Estuarine Research, Monitoring, and Resource Protection
Zooplankton
Zooplankton sampling in the Lower St. Jones River during the 1995–1996 period
collected 39 microzooplankton taxa and 53 mesozooplankton taxa. Among the most
common microzooplankton (<64 mm) taxa observed in plankton collections were
copepod nauplii, rotifers (Brachionus spp., Filinia spp., Keratella spp., Notholca
spp., and unidentiÞed forms), protozoans (Tintinnidium spp., Arcellinida, Peritrichia,
TABLE 4.6
Taxonomic List of Phytoplankton Collected in the Blackbird Creek and St.
Jones River Areas of the Delaware National Estuarine Research Reserve
Division Cyanophycota (Blue-Green Algae) Gyrosigma spp.
Anabaena spp. Hantzschia spp.
Anacystis spp. Navicula spp.
Microcystis spp. Nitzschia spp.
Oscillatoria spp. Pinnularia spp.
Sphaerocystis spp. Surirella spp.
UnidentiÞed Cyanophycota
Division Chlorophycota (Green Algae)
Division Bacillariophyta (Diatoms)
Class Coscinodiscophyceae (Centric Diatoms)
Actinastrum spp.
Ankistrodesmus spp.
Biddulphia spp. Chlamydomonas spp.
Chaetoceros spp. Chlorella spp.
Coscinodiscus spp. Hydrodictyon spp.
Cyclotella spp. Pediastrum spp.
Ditylum spp. Scenedesmus spp.
Guinardia spp. Tetraedron spp.
Leptocylindrus spp. Ulothrix spp.
Lithodesmium spp. Volvox spp.
Melosira spp. UnidentiÞed Chlorphycota
Rhizosolenia spp.
Skeletonema spp.
UnidentiÞed Coscinodiscophyceae
Division Cryptophycota
Class Cryptophyceae
Cryptomonas spp.
Class Fragilariophyceae (Araphid, Pennate Diatoms) Division Pyrrhophycota (Dinoflagellates)
Asterionella spp. UnidentiÞed Pyrrhophycota
Fragilaria spp. Class Dinophyceae
Synedra spp. Ceratium spp.
Tabellaria spp. Gymnodinium spp.
Thalassionema spp. Noctiluca spp.
Thalassiothrix spp. Peridinium spp.
Class Bacillariophyceae (Raphid, Pennate Diatoms)
Unidentified Phytoflagellates
Achnanthes spp. Unidentified Phytoplankton
Source: Delaware Department of Natural Resources and Environmental Control. 1999. Delaware
National Estuarine Research Reserve: Estuarine ProÞles. Technical Report, Delaware Department
of Natural Resources and Environmental Control, Dover, DE.
1960_book.fm Page 134 Friday, August 15, 2003 1:37 PM
Copyright © 2004 CRC Press, LLC
Delaware National Estuarine Research Reserve 135
Zoomastigophora), cladocerans (Daphnia spp.), bivalve larvae, Gastropoda, and
Polychaeta. The Ascidiacea were also abundant. Copepod nauplii dominated the
microzooplankton during the spring, summer, and fall; unidentiÞed Rotifera domi-
nated during the winter. Cladocerans and polychaete larvae were also abundant in
the Lower St. Jones River during a given season. Microzooplankton diversity was
highest in the summer and lowest in the fall (DNERR, 1999).
Of the 53 mesozooplankton (64 to 250 mm) taxa found in the Lower St. Jones
River, polychaete larvae dominated the collections and were most abundant in the
spring and summer. Nematodes predominated in the winter, and the copepod, Eury-
temora afÞnis, was most numerous in the fall. Several other copepod taxa were also
abundant, notably copepod nauplii, Acartia tonsa, Acartia spp., copepodites, Cal-
anoida, Leptastacus spp., Cyclopoida, Cyclops spp., Halicyclops fosteri, Pseudodi-
aptomus pelagicus, and Harpacticoida. In addition, crab larvae (Uca spp. and
Rhithropanopeus spp.), mysid shrimp (Neomysis americana), cladocerans (Bosmina
spp., Daphnia spp., and Diaphanosoma spp.), rotifers (Brachionus spp., Notholca
spp., and unidentiÞed Rotifera), Ascidiacea, Cirripedia, Cnidaria medusa, Gas-
tropoda, and Tardigrada were numerically important mesozooplankton.
Zooplankton attained highest densities in the upper reaches of both the St. Jones
River and Blackbird Creek. While phytoplankton densities likewise peaked in the
upper reaches of the St. Jones River, they were highest in the lower reaches of
Blackbird Creek. Densities of plankton were generally greatest in the summer, an
exception being phytoplankton in the St. Jones River, which exhibited maximum
densities in the spring (Table 4.7).
TABLE 4.7
Net Plankton Density Recorded in the Blackbird Creek and St. Jones River
Season
Phytoplankton
(n/ml)
Microzooplankton
(n/m
3
)
Mesozooplankton
(n/m
3
)
Blackbird Creek
Fall 1995 2,662 16,235 2,977
Winter 1995–96 1,732 5,241 788
Spring 1996 4,972 14,525 6,476
Summer 1996 7,587 27,901 11,305
Annual Mean, 1995–96 6,450 25,608 10,940
St. Jones River
Fall 1995 2,392 7,824 2,086
Winter 1995–96 1,721 8,641 1,199
Spring 1996 11,120 4,949 2,472
Summer 1996 3,978 15,223 8,235
Annual Mean, 1995–96 8,797 14,518 6,162
Source: Delaware Department of Natural Resources and Environmental Control. 1999. Delaware
National Estuarine Research Reserve: Estuarine ProÞles. Technical Report, Delaware Department
of Natural Resources and Environmental Control, Dover, DE.
1960_book.fm Page 135 Friday, August 15, 2003 1:37 PM
Copyright © 2004 CRC Press, LLC
136 Estuarine Research, Monitoring, and Resource Protection
In the Delaware Estuary, copepods account for ~85% of the total zooplankton
biomass (Herman, 1988). Among the numerically dominant copepod species in the
estuary are Acartia hudsonica, Acartia tonsa, Eurytemora afÞnis, Halicyclops fosteri,
Oithona colcarva, and Pseudodiaptomus pelagicus. Of these species, A. tonsa is
most abundant, attaining peak numbers in the summer (Stearns, 1995; Kennish,
2000). Oithona colcarva and P. pelagicus are also abundant at this time, and along
with H. fosteri, persist into the fall. Abundant forms in the winter and spring include
A. hudsonica, E. afÞnis, O. colcarva, and P. pelagicus. Zooplankton attain peak
numbers in Delaware Bay in the summer, often exceeding 0.5 ¥ 10
5
individuals/m
3
(Herman et al., 1983).
Sutton et al. (1996) reported that cladocerans, cyclopoid copepods, and gam-
marid amphipods dominate the zooplankton community in the tidal waters upestuary.
Estuarine and marine species (e.g., calanoid copepods) predominate in Delaware
Bay. Salinity is a major factor inßuencing the spatial distribution of zooplankton
species in the system (Stearns, 1995).
Benthic Fauna
More than 30 macroinvertebrate taxa were collected in benthic surveys conducted
in the Lower St. Jones River during the 1994–1995 sampling period. These benthic
fauna belong to Þve phyla, notably the Annelida, Arthropoda, Mollusca, Platyhel-
minthes, and Nemertea (Table 4.8). Ten of the taxa comprised more than 90% of
all the organisms collected at eight sampling sites. These ten taxa are listed here
in order of decreasing abundance: Oligochaeta (58% of the total), Chironomidae
(9%), Corophium sp. (5%), Polychaeta (3%), Neomysis americana (3%), Edotea
triloba (3%), Streblospio benedicti (3%), Gammarus sp. (3%), Ilyanassa sp. (2%),
and turbellarians (2%). While oligochaetes were by far the most abundant benthic
macroinvertebrate taxa in the Lower St. Jones River, the opossum shrimp (Neomy-
sis americana) was the overwhelming dominant member of the parabenthic com-
munity there, constituting more than 92% of all parabenthic organisms collected
(DNERR, 1999).
The seasonal densities of the benthic macroinvertebrates ranged from 3850 to
4573 individuals/m
2
, with maximum numbers recorded during spring. The densities
of parabenthic organisms ranged from 578 to 21,210 individuals/m
2
. Peak densities
of these organisms were found in the fall.
Bivalves and polychaetes dominate the soft-bottom benthic community in Del-
aware Bay. In polyhaline waters near the mouth of the bay, surf clams (Spisula
solidissima) and sand dollars (Echinarachnius parma) predominate in sandy sedi-
ments, and polychaetes (Nucula proxima and Nephtys spp.) are most abundant in
silty sediments. Other numerically important macroinvertebrate species found in the
bay are the bivalves Crassostrea virginica and Ensis directus as well as the poly-
chaetes Glycera dibranchiata and Heteromastus Þliformis. In mesohaline silts and
Þne sands, the bivalves Gemma gemma, Mulinia lateralis, and Mya arenaria are
likewise abundant (Maurer et al., 1978; Steimle, 1995).
Proceeding to mesohaline salt marsh habitats adjacent to the St. Jones River,
the most common members of the macroinvertebrate community are Þddler crabs
1960_book.fm Page 136 Friday, August 15, 2003 1:37 PM
Copyright © 2004 CRC Press, LLC
Delaware National Estuarine Research Reserve 137
TABLE 4.8
Mean Density of Benthic Macroinvertebrates in the Tidal
River and Channels of the St. Jones River during 1994
(Summer and Fall) and 1995 (Spring)
a
Taxon Upper Lower Mean % Total
Tidal River
Oligochaeta 1302 1335 1319 34.9
Chironomidae 1765 118 942 24.9
Corophium sp. 1103 11 557 14.7
Edotea triloba 226 135 180 4.8
Neomysis americana 318 27 172 4.6
Ilyanassa sp. 0 312 156 4.1
Gammarus sp. 151 16 83 2.2
Gammaridae 145 0 73 1.9
Polychaeta 0 135 67 1.8
Bivalvia 5 102 54 1.4
Streblospio benedicti 591481.3
Scolecolepides viridis 11 54 32 0.9
Polydora ligni 27 22 24 0.6
Cyathura polita 38 0 19 0.5
Nemertea 32 0 16 0.4
Nereis succinea 22 11 16 0.4
Eurypanopeus depressus 01680.2
Coecidotea sp. 11 0 5 0.1
Isopoda 0 5 3 0.1
Spionidae 5 0 3 0.1
Idotea sp. 0 5 3 0.1
Xanthidae 5 0 3 0.1
Channels
Oligochaeta 5839 737 3288 74.7
Turbellaria 581 59 320 7.3
Neomysis americana 22 301 161 3.7
Gammarus sp. 22 237 129 2.9
Streblospio benedicti 11 183 97 2.2
Corophium sp. — 172 86 2.0
Chironomidae 140 11 75 1.7
Nereis succinea 22 108 65 1.5
Polydora ligni 38 65 51 1.2
Edotea triloba 81 16 48 1.1
Scolecolepides viridis 32 0 16 0.4
Sphaeriidae 32 — 16 0.4
Gammaridae 16 5 11 0.2
Xanthidae 5 11 8 0.2
Hypaniola ßorida 5550.1
Nassarius sp. 0 11 5 0.1
(continued)
1960_book.fm Page 137 Friday, August 15, 2003 1:37 PM
Copyright © 2004 CRC Press, LLC
138 Estuarine Research, Monitoring, and Resource Protection
(Uca spp.), salt marsh snails (Melampus bidentatus), mud snails (Ilyanassa obso-
leta), grass shrimp (Palaemonetes spp.), marsh crabs (Sesarma reticulatum), blue
crabs (Callinectes sapidus), ribbed mussels (Geukensia demissa), amphipods
(Orchestia grillus and Gammarus spp.) and isopods (Edotea triloba). Quadrat
sampling revealed a mean density of marsh surface macroinvertebrates amounting
to 44 individuals/m
2
, with the most numerous species being the salt marsh snail
Melampus bidentatus (mean density = 37.6 individuals/m
2
) followed in decreasing
order of abundance by Uca minax, Orchestia grillus, U. pugnax, Geukensia
demissa, Palaemonetes pugio, and Sesarma reticulatum. Of all salt marsh areas
sampled, Spartina alternißora habitat had the highest mean density of macroin-
vertebrates (135.4 individuals/m
2
) (DNERR, 1999).
Finfish
Nektonic surveys conducted in the summer and fall of 1994 and the spring of 1995
documented 25 species of Þsh in the Lower St. Jones River. Estuarine species
dominated the assemblage. For example, the Atlantic silverside (Menidia menidia),
mummichog (Fundulus heteroclitus), spot (Leiostomus xanthurus), sheepshead min-
now (Cyprinodon variegatus), white perch (Morone americana), and bay anchovy
(Anchoa mitchilli) — in decreasing order of abundance — were the most abundant
forms, comprising nearly 95% of the total ÞnÞsh catch (Table 4.9). FinÞsh abundance
was signiÞcant in secondary tributaries (DNERR, 1999).
The ÞnÞsh community is much more diverse in the Delaware Estuary, where
more than 200 species of Þsh have been recorded. O’Herron et al. (1994) identiÞed
the following priority species in the estuary: alewife (Alosa pseudoharengus), Amer-
ican shad (A. sapidissima), blueback herring (A. aestivalis), American eel (Anguilla
rostrata), Atlantic menhaden (Brevoortia tyrannus), Atlantic sturgeon (Acipenser
Nemertea 11 0 5 0.1
Bivalvia 0 5 3 0.1
Hirudinea 0 5 3 0.1
Limulus polyphemus 0530.1
Melita nitida 0530.1
a
Density = number/m
2
.
Source: Delaware Department of Natural Resources and Environmental
Control. 1999. Delaware National Estuarine Research Reserve: Estuarine
ProÞles. Technical Report, Delaware Department of Natural Resources and
Environmental Control, Dover, DE
TABLE 4.8 (CONTINUED)
Mean Density of Benthic Macroinvertebrates in the Tidal
River and Channels of the St. Jones River during 1994
(Summer and Fall) and 1995 (Spring)
a
Taxon Upper Lower Mean % Total
1960_book.fm Page 138 Friday, August 15, 2003 1:37 PM
Copyright © 2004 CRC Press, LLC
Delaware National Estuarine Research Reserve 139
TABLE 4.9
Finfish Abundance in the Upper Blackbird Creek and Lower St. Jones
River during 1994 (Summer and Fall) and 1995 (Spring)
Species
Blackbird
Creek
St. Jones
River
Percent of
Total
Leiostomus xanthurus (spot) 2319 829 32.80
Fundulus heteroclitus (mummichog) 523 1143 17.36
Brevoortia tyrannus (Atlantic menhaden) 1241 — 12.93
Menidia menidia (Atlantic silverside) 18 1198 12.67
Morone americana (white perch) 585 342 9.66
Cyprinodon variegatus (sheepshead minnow) — 634 6.60
Anchoa mitchilli (bay anchovy) 3 281 2.96
Trinectes maculatus (hogchoker) 78 65 1.49
Cynoscion regalis (weakÞsh) 19 51 0.73
Morone saxatilis (striped bass) 36 29 0.68
Anguilla rostrata (American eel) 20 32 0.54
Urophycis regia (spotted hake) — 31 0.32
Pogonias cromis (black drum) 5 21 0.27
Ameiurus gibbosus (brown bullhead) 16 — 0.17
Hybognathus nuchalis (silvery minnow) 15 — 0.16
Clupea harengus (Atlantic herring) — 12 0.13
Micropogonias undulatus (Atlantic croaker) — 10 0.10
Ictalurus punctatus (channel catÞsh) 4 4 0.08
Bairdiella chrysoura (silver perch) — 5 0.05
Fundulus majalis (striped killiÞsh) —40.04
Mugal cephalus (striped mullet) — 4 0.04
Dorosoma cepedianum (gizzard shad) 3 — 0.03
Menidia beryllina (inland silverside) 1 2 0.03
Centropristis striata (black sea bass) — 2 0.02
Pomatomus saltatrix (blueÞsh) — 2 0.02
Prionotus carolinus (northern searobin) — 2 0.02
Opsanus tau (oyster toadÞsh) — 2 0.02
Perca ßavescens (yellow perch) 2 — 0.02
Fundulus diaphanus (banded killiÞsh) — 1 0.01
Pomoxis nigromaculatus (black crappie) 1 — 0.01
Alosa aestivalis (blueback herring) 1 — 0.01
Lepomis macrochirus (bluegill) 1 — 0.01
Lepomis gibbosus (pumpkinseed) 1 — 0.01
Paralichthys dentatus (summer ßounder) — — 0.01
Note: Density = number/m
2
.
Source: Delaware Department of Natural Resources and Environmental Control. 1999. Delaware
National Estuarine Research Reserve: Estuarine ProÞles. Technical Report, Delaware Department
of Natural Resources and Environmental Control, Dover, DE.
1960_book.fm Page 139 Friday, August 15, 2003 1:37 PM
Copyright © 2004 CRC Press, LLC
140 Estuarine Research, Monitoring, and Resource Protection
oxyrhynchus), white perch (Morone americana), striped bass (M. saxatilis), weakÞsh
(Cynoscion regalis), blueÞsh (Pomatomus saltatrix), spot (Leiostomus xanthurus),
scup (Stenotomus versicolor), Atlantic croaker (Micropogonias undulatus), black
drum (Pogonias cromis), channel catÞsh (Ictalurus punctatus), white catÞsh (Ameiu-
rus catus), summer ßounder (Paralichthys dentatus), windowpane ßounder (Scoph-
thalmus aquosus), and carp (Cyprinus carpio). The bay anchovy (Anchoa mitchilli)
and Atlantic silverside (Menidia menidia) are important forage species in the system.
The species of commercial importance primarily include the weakÞsh (Cynoscion
regalis), blueÞsh (P. saltatrix), Atlantic menhaden (B. tyrannus), summer ßounder
(P. dentatus), and spot (L. xanthurus). They have largely replaced the prominent
upriver forms (alewife, A. pseudoharengus; American shad, A. sapidissima; blueback
herring, A. aestivalis; and Atlantic sturgeon, A. oxyrhynchus) in the Þshery (Price
and Beck, 1988; Kennish, 2000).
Amphibians and Reptiles
Frogs and salamanders are common in the DNERR, especially at the Upper Black-
bird Creek Reserve site. Among the most important frog species in the DNERR are
the green frog (Rana clamitans melanota), bullfrog (R. catesbeiana), wood frog (R.
sylvatica), northern spring peeper (Pseudacris crucifer crucifer), and southern leop-
ard frog (R. utricularia). Salamanders of signiÞcance include the northern two-lined
salamander (Eurycea bislineata) and red-backed salamander (Plethodon cinereus).
The greater areal coverage and diversity of wetland habitats along the Upper Black-
bird Creek provide more suitable conditions for amphibian populations than those
along the Lower St. Jones River.
Four species of turtles occupy wetland habitats of both DNERR component sites,
speciÞcally the snapping turtle (Chelydra serpentina), northern diamondback terra-
pin (Malaclemys terrapin terrapin), eastern mud turtle (Kinosternon subrubrum
subrubrum), and red-bellied turtle (Chrysemys rubriventris). Marine turtles observed
in Delaware Bay include the green sea turtle (Chelonia mydas), Kemp’s Ridley turtle
(Lepidochelys kempii), and loggerhead turtle (Caretta caretta).
Two species of snakes primarily inhabit the wetlands and uplands of the DNERR.
These are the black rat snake (Elaphe obsoleta) and northern water snake (Nerodia
sipedon). A few other species of snakes may range into reserve areas but are less
common than the aforementioned forms (DNERR, 1999).
Birds
The Delaware Estuary and surrounding areas are havens for rich and diverse
groups of avifauna. Waterbirds, raptors, and passerines are well represented in
the St. Jones River watershed. An extensive list of shorebirds, wading birds, and
waterfowl has been compiled for the reserve site based on surveys conducted
between May 1994 and June 1995 (Table 4.10). Among the common shorebird
species identiÞed in the St. Jones River survey are dunlin (Calidris alpina),
sanderling (C. alba), red knot (C. canutus), semipalmated sandpiper (C. pusilla),
least sandpiper (C. minutilla), western sandpiper (C. mauri), black-bellied plover
1960_book.fm Page 140 Friday, August 15, 2003 1:37 PM
Copyright © 2004 CRC Press, LLC
Delaware National Estuarine Research Reserve 141
TABLE 4.10
Bird Species Recorded in the Blackbird Creek
and St. Jones River DNERR Sites during Field
Surveys Conducted from May 1994 through
June 1995
Species
Blackbird
Creek
St. Jones
River
American black duck X
American coot X
American crow X X
American goldÞnch X X
American robin X X
Bald eagle X
Barn swallow X X
Belted kingÞsher X X
Black-bellied plover X
Black skimmer X
Black vulture X X
Blue jay X
Blue-winged teal X
Boat-tailed grackle X X
Canada goose X X
Carolina chickadee X
Carolina wren X X
Cattle egret X
Chimney swift X
Clapper rail X
Common grackle X X
Common rail X X
Common merganser X
Common snipe X
Common tern X X
Common yellowthroat X X
Double-crested cormorant X X
Downy woodpecker X X
Dunlin X
Eastern bluebird X
Eastern kingbird X X
Eastern meadowlark X
Eastern wood pewee X
Fish crow X X
Forster’s tern X X
Glossy ibis X X
Great black-backed gull X
Great blue heron X X
(continued)
1960_book.fm Page 141 Friday, August 15, 2003 1:37 PM
Copyright © 2004 CRC Press, LLC
142 Estuarine Research, Monitoring, and Resource Protection
Great crested ßycatcher X X
Great egret X X
Great horned owl X
Greater yellowlegs X X
Green-backed heron X X
Green-winged teal X X
Grey catbird X X
Hairy woodpecker X
Herring gull X X
House wren X
Indigo bunting X X
Killdeer X X
Laughing gull X X
Least tern X
Mallard X X
Marsh wren X X
Mockingbird X
Mourning dove X X
Night heron X
Northern bobwhite X X
Northern cardinal X X
Northern ßicker X X
Northern harrier X X
Northern pintail X
Northern shoveler X
Orchard oriole X
Peep X X
Pileated woodpecker X
Purple martin X
Red head X
Red knot X
Red-bellied woodpecker X X
Red-breasted merganser X
Red-eyed vireo X
Red-tailed hawk X X
Red-winged blackbird X X
Ring-billed gull X X
Ruby-throated hummingbird X
Ruddy duck X
TABLE 4.10 (CONTINUED)
Bird Species Recorded in the Blackbird Creek
and St. Jones River DNERR Sites during Field
Surveys Conducted from May 1994 through
June 1995
Species
Blackbird
Creek
St. Jones
River
1960_book.fm Page 142 Friday, August 15, 2003 1:37 PM
Copyright © 2004 CRC Press, LLC