GIS Based Studies in the Humanities and Social Sciences - Chpater 6 doc
Bạn đang xem bản rút gọn của tài liệu. Xem và tải ngay bản đầy đủ của tài liệu tại đây (889.34 KB, 13 trang )
85
6
Urban Employment Areas: Defining Japanese
Metropolitan Areas and Constructing
the Statistical Database for Them
Yoshitsugu Kanemoto and Reiji Kurima
CONTENTS
6.1 Introduction 85
6.2 The Need for a New Metropolitan-Area Definition 86
6.3 Metropolitan-Area Definitions in the U.S. 87
6.4 The Structure of Japanese Metropolitan Areas 89
6.5 Defining Urban-Employment Areas 89
6.5.1 Requirements for a Core 90
6.5.2 Requirements for an Outlying Area 91
6.5.3 The Iterative Procedure for Defining UEAs 91
6.5.3.1 The First Iteration 91
6.5.3.2 The Second Iteration 92
6.5.3.3 Other Iterations 92
6.6 Urban-Employment Areas for the 1995 Population 93
6.7 The Construction of the MEA Economic Database 94
6.8 Conclusion 97
Acknowledgment 97
References 97
6.1 Introduction
For those interested in analyzing urban activity, the first task should be to
define urban areas. The legal definition of a city is a natural starting point,
but many urban activities extend beyond jurisdictional boundaries. For
example, many workers in large metropolitan areas commute from suburban
2713_C006.fm Page 85 Monday, September 26, 2005 2:05 PM
Copyright © 2006 Taylor & Francis Group, LLC
86
GIS-based Studies in the Humanities and Social Sciences
jurisdictions to central cities. We therefore need a definition of an urban area
within which most everyday activities are undertaken. An urban area typi-
cally comprises a core area that has significant concentrations of employ-
ment, which is surrounded by densely settled areas that have close
commuting ties to the core.
In the United States, the federal government has defined metropolitan
areas since 1947 and provides a variety of statistical data relating to them.
There is no counterpart in Japan, and the only definitions of metropolitan
areas available are those proposed by a small number of researchers. Most
of these adopt standards similar to the Standard Metropolitan Statistical Area
(SMSA), which was in use in the 1960s and 1970s. However, in the U.S., two
major changes have occurred since then, which reflect changes in the pop-
ulation distribution and activity patterns. First, in the 1980s, the Consolidated
Metropolitan Statistical Area (CMSA) was introduced, which connects met-
ropolitan areas that have significant interactions. Second, a new definition
known as the Core-Based Statistical Area (CBSA) was introduced for the
2000 population census.
In Japan, changes in metropolitan areas motivated a revision of the first
generation of metropolitan-area definitions. Kanemoto and Tokuoka (2002)
proposed a new metropolitan-area definition to deal with complicated inter-
action patterns in Japanese metropolitan areas. The newly defined metro-
politan areas are known as
Urban-Employment Areas
(UEAs), because they
are based on employment patterns. The UEAs are divided between
Metro-
politan-Employment Areas
(MEAs) and
Micropolitan-Employment Areas
(McEAs) according to their sizes. Researchers affiliated with the Center for
Spatial Information Science at the University of Tokyo have been construct-
ing a database for UEAs. In this chapter, we explain the definition of the
UEA and a method of constructing an economic database for them.
6.2 The Need for a New Metropolitan-Area Definition
As noted above, a number of researchers have developed their own defini-
tions of metropolitan areas. Examples are the Regional Economic Cluster
(REC) of Glickman, the Functional Urban Core (FUC) of Kawashima, and
the Standard Metropolitan Employment Area (SMEA) of Yamada and
Tokuoka. These SMSA-type definitions apply different standards to central
cities and suburban areas. According to the SMEA, a central city requires a
population of at least 50,000, a percentage of nonagricultural workers of at
least 75 percent, at least as many daytime occupants as nighttime ones, no
more than 30 percent of the population commuting out, and no more than
15 percent commuting to another central city. A suburban municipality
requires a percentage of nonagricultural workers of at least 75 percent and
at least 10 percent of the population commuting to the central city.
2713_C006.fm Page 86 Monday, September 26, 2005 2:05 PM
Copyright © 2006 Taylor & Francis Group, LLC
Urban Employment Areas: Defining Japanese Metropolitan Areas
87
The idea of defining central cities and suburban areas separately is attrac-
tive because of its simplicity. It first defines central cities, and then finds
suburban areas for each of them, and the process does not involve iteration.
However, it has shortcomings. For example, a city with a high population
density may not be included in a metropolitan area. For example, Yamaguchi
city, which is the capital of the Yamaguchi prefecture, did not belong to an
SMEA until 1985. It was not classed as a central city because it had fewer
daytime occupants than nighttime occupants and at the same time did not
satisfy the conditions for being a suburb of another city.
Recently, this problem has become increasingly serious because of the
emergence of a large number of subcenters and because of increasingly
complex commuting patterns. If we use commuting ties to define a suburban
area in relation to a particular central city, a city that is close to more than
one central city may not belong to a metropolitan area. In the 1995 population
census, there were 441 cities with populations of at least 50,000, of which 60
could not be classed as either central cities or suburbs of an SMEA. Of these
60 cities, 16 have populations of at least 100,000. Given that a single city with
a population of 100,000 can itself be classed as an SMEA, excluding these
cities from metropolitan areas is not consistent. Many cities that do not
belong to an SMEA are suburban areas from which at least 30 percent of the
population commutes out. Typically, commuters have more than one city to
commute to. Almost 50 percent of these cities are located on the periphery
of the Tokyo SMEA.
To deal with these problems, we can relax either the requirements for
central cities or those for suburban areas. For example, the core of a metro-
politan area may include subcenters with sufficiently large concentrations
of employment even if they satisfy the requirements for classification as
suburban areas of a central city. In the Tokyo metropolitan area, Yokohama,
in which employment was about 1.4 million in 1995, could be included in
the core area. Another possibility is to modify the requirements for suburban
areas so that they take account of commuting to other suburban cities.
SMEAs have three types of requirement for central cities: namely, popu-
lation size, urban characteristics, and the employment core. Of these ele-
ments, the employment-core requirements should be reexamined first so that
areas with significant population concentrations are not excluded from met-
ropolitan areas. Another problem with SMEA relates to the requirements for
urban characteristics. The percentage of nonagricultural workers represents
this element, but it is no longer an effective index of urbanization.
6.3 Metropolitan-Area Definitions in the U.S.
In revising the Japanese metropolitan-area definition, it is useful to study
other countries that have experienced a similar trend of increasingly complex
2713_C006.fm Page 87 Monday, September 26, 2005 2:05 PM
Copyright © 2006 Taylor & Francis Group, LLC
88
GIS-based Studies in the Humanities and Social Sciences
metropolitan areas. In the U.S., there was a major revision in 2000 with the
introduction of a new metropolitan-area definition known the Core-Based
Statistical Area (CBSA). According to the Office of Management and Budget
(2000), a CBSA is a geographic entity associated with at least one core of
10,000 or more population, plus adjacent territory that has a high degree of
social and economic integration with the core as measured by commuting
ties. The standards designate and define two categories of CBSA: Metropol-
itan Statistical Areas and Micropolitan Statistical Areas (Office of Manage-
ment and Budget, 2000, p. 82, 236).
A Metropolitan Statistical Area is associated with at least one urbanized
area that has a population of at least 50,000, and a Micropolitan Statistical
Area is associated with at least one urban cluster that has a population of
at least 10,000 but less than 50,000.
A CBSA is identified in four steps. First, a CBSA must contain sufficiently
large urban (densely settled) areas. Specifically, it must have an urbanized
area, as defined by the Census Bureau, of at least 50,000 people, or an urban
cluster, as defined by the Census Bureau, of at least 10,000 people.
Second, the core of a CBSA comprises a central county or counties asso-
ciated with the urban areas. Specifically, a central county or counties must:
(a) have at least 50 percent of its population in urban areas of at least 10,000
people; or (b) have within its boundaries a population of at least 5,000 located
in a single urban area of at least 10,000 people.
Third, outlying counties of a CBSA must satisfy the commuting require-
ment that: (a) at least 25 percent of the employed residents of the county
work in the central county or counties of the CBSA; or (b) at least 25 percent
of the employment in the county is accounted for by workers who reside in
the central county or counties of the CBSA.
Fourth, closely connected CBSAs are merged into one CBSA. In particular,
two adjacent CBSAs merge into one CBSA if the central county or counties
(as a group) of one CBSA qualify as outlying counties to the central county
or counties (as a group) of the other CBSA using the measures and thresholds
stated in (a) and (b) above.
Because of institutional differences, we cannot apply the U.S. definitions
to Japanese cities. The most important difference is that the Japanese gov-
ernment does not define urban areas that extend beyond jurisdictional
boundaries. The nearest equivalent in Japan is a Densely Inhabited District
(DID) defined within a local municipality. The DID is defined by the Statistics
Bureau as an area that is a group of contiguous Basic Unit Blocks, each of
which has a population density of 4,000 inhabitants or more per square
kilometer, or which has public, industrial, educational, and recreational facil-
ities, and whose total population is 5,000 or more within a local municipality.
U.S. requirements for outlying areas have changed considerably. First, the
measures of settlement structure, such as population density, that had been
used to define outlying counties are no longer used; currently, commuting
data are used. The reason for this change is that “as changes in settlement
and commuting patterns as well as changes in communications technologies
2713_C006.fm Page 88 Monday, September 26, 2005 2:05 PM
Copyright © 2006 Taylor & Francis Group, LLC
Urban Employment Areas: Defining Japanese Metropolitan Areas
89
have occurred, settlement structure is no longer as reliable an indicator of
metropolitan character as was previously the case” (Office of Management
and Budget, 1999). In Japan, metropolitan areas have expanded into rural
areas, and the use of settlement structure may no longer be relevant. Second,
the percentage commuting out was raised from 15 percent to 25 percent,
because the percentage of workers in the U.S. who commute to work outside
their counties of residence increased from approximately 15 percent in 1960
to almost 25 percent in 1990. In Japan, we should also reconsider the com-
muting ratio. However, it is not clear whether the ratio should be raised,
because, as we explain later, commuting patterns in Japan are much more
complicated than in the U.S.
6.4 The Structure of Japanese Metropolitan Areas
According to the 1995 population census, 724 cities and towns have DID
populations of at least 10,000, of which 440 have total populations of at least
50,000. The number of cities with DID populations of at least 50,000 is 297.
Many urban areas are dormitory towns, and relatively few of these are
employment centers. Of the 724 (297) cities and towns with DID populations
of at least 10,000 (50,000), only 281 (120) have larger commuter inflows than
outflows. Some large cities, such as Yokohama, Chiba, and Kawasaki, have
larger outflows than inflows. However, the central wards of these cities are
employment centers that have larger commuter inflows than outflows and
DID populations of at least 50,000.
Consider commuting patterns. The average commuter-outflow proportion
is 32 percent, but employed residents commute to a wide variety of urban
areas. Some cities have highly concentrated commuting patterns: More than
50 percent of the employed residents of 16 cities and towns (Tomiya, Wako,
Urayasu, Fuchu, Komae, Hoya, Nagayo, Kokufu, Uchinada, Ichikawa,
Sanwa, Kouyagi, Ishikari, Musashino, Hashikami, and Yakumo) commute
to one city. Another extreme is Zama, where more than 5 percent of the
employed residents commute to one of six other municipalities.
6.5 Defining Urban-Employment Areas
Kanemoto and Tokuoka (2002) proposed a new metropolitan-area definition
known as the Urban Employment Area (UEA). UEAs are divided between
Metropolitan Employment Areas (MEAs) and Micropolitan Employment
Areas (McEAs) according to their sizes. These are similar to the CBSA for
U.S. cities, but there are substantial differences in specific requirements to
2713_C006.fm Page 89 Monday, September 26, 2005 2:05 PM
Copyright © 2006 Taylor & Francis Group, LLC
90
GIS-based Studies in the Humanities and Social Sciences
reflect the higher densities and more complicated commuting patterns in
Japanese cities.
In defining metropolitan areas for Japan, we must take the following four
conditions as given.
1. The building blocks of metropolitan areas are municipalities (cities,
towns, and villages), because most statistical data are only available
up to the municipality level.
2. The prevalence of commuting by car in smaller metropolitan areas
has increased the numbers commuting to cities from areas of low
population density. The use of population-density standards in
defining outlying areas is no longer practical.
3. In identifying densely inhabited urban areas, we use DID populations.
4. The inclusion of outlying suburban areas is determined by commut-
ing patterns between municipalities.
After examining many alternatives, Kanemoto and Tokuoka (2002) pro-
posed the following definition of a UEA. First, local municipalities (cities,
towns, and villages) are the building blocks of UEAs. The core of a UEA
is a collection of densely settled municipalities (i.e., those with DID pop-
ulations of at least 10,000) that do not constitute the “outlying municipal-
ities” (suburbs) of any other core. The outlying municipalities of a UEA
are defined mainly by the requirement that at least 10 percent of employed
workers commute to the core. An MEA is a UEA whose core has a DID
population of at least 50,000. An McEA is a UEA whose core has a DID
population of at least 10,000 and less than 50,000. More specifically, they
use the following standards.
6.5.1 Requirements for a Core
1. In the first round, potential cores are municipalities with DID pop-
ulations of at least 10,000.
2. A municipality that is an outlying area of another central city is
excluded from being a core.
3. For a pair of municipalities that each satisfy the requirement for being
in a core and also satisfy the commuting-ratio requirement for being
an outlying area of the other municipality, the one with the lowest
commuting ratio is in the core, and the other is its outlying area.
4. An outlying municipality is included in the core if the following two
requirements are satisfied. A “major” city (known as a
Seirei Shitei
Toshi
) for which data on its wards are available is included in the
core if at least one of its wards satisfies the following requirements.
2713_C006.fm Page 90 Monday, September 26, 2005 2:05 PM
Copyright © 2006 Taylor & Francis Group, LLC
Urban Employment Areas: Defining Japanese Metropolitan Areas
91
a. The employees-to-residents ratio (i.e., the ratio of the number of
employees to the number of residents) is at least unity.
b. The DID population is at least 100,000 or one-third of the core.
Condition 4 implies that a core may contain more than one municipality.
The reason for adding the condition on the size of the DID in 4b is that
the largest metropolitan areas, such as Tokyo and Osaka, have multiple
central cities, and some very small municipalities satisfy the employees-
to-residents ratio. It is inappropriate to include a municipality of 5,000 in
the core alongside the central city of Tokyo, which has more than 7 million
employees.
6.5.2 Requirements for an Outlying Area
1. A municipality is an outlying area of a core if at least 10 percent of
its employed residents work in the core.
2. If a municipality satisfies condition 1 for more than one core, it is
included in the outlying area of the core with which it has the
strongest commuting ties.
3. A second-order outlying municipality that is an outlying area of
another outlying municipality is included in a UEA. Higher-order
outlying municipalities (i.e., third-order, fourth-order, etc.) are also
included in UEAs. The criterion for a second-order municipality is
that, of all the target municipalities, its commuting ratio to a first-
order outlying municipality is the highest and satisfies the 10 per-
cent criterion. Higher-order outlying municipalities are defined
analogously.
4. If a municipality simultaneously satisfies the requirement for being
an outlying area of a core and the requirement for being another
outlying municipality, it is classified as an outlying area of the one
with which it has the highest commuting ratio. That is, if 16 percent
of the employed residents in city A work in core B and 17 percent
of them work in city C, which is an outlying municipality of core B,
then city A is an outlying area of city C.
6.5.3 The Iterative Procedure for Defining UEAs
UEAs are determined by the following iterative procedure.
6.5.3.1 The First Iteration
1. Choose municipalities with DID populations of at least 10,000 as
potential central cities.
2713_C006.fm Page 91 Monday, September 26, 2005 2:05 PM
Copyright © 2006 Taylor & Francis Group, LLC
92
GIS-based Studies in the Humanities and Social Sciences
2. Exclude as potential central cities defined by 1, those municipalities
that are outlying areas of other potential central cities.
3. Determine the outlying municipalities for the potential central cities
by using the following procedure.
a. Select municipalities for which the percentage of employed res-
idents who work in a central municipality is at least 10 percent;
and for each of them, determine the central municipality that has
the highest commuting ratio. This identifies potential first-order
outlying municipalities.
b. Determine potential second-order outlying municipalities by
choosing municipalities that satisfy the commuting-ratio criteri-
on.
c. Determine potential second-order outlying municipalities.
d. Determine potential third-order outlying municipalities.
e. Check for fourth-order outlying municipalities. (Currently, there
are none.)
f. If a municipality is simultaneously a first-order, second-order, or
third-order outlying area, identify the target municipality with
the highest commuting ratio.
g. List the outlying municipalities for each central city.
6.5.3.2 The Second Iteration
1. Of the potential outlying municipalities identified in the first itera-
tion, those that satisfy the following two requirements are included
in the cores of the UEAs to which they belong. If a candidate is a
“major” city, it is included in the core if at least one of its wards
satisfies the following requirements.
a. The employees-to-residents ratio is at least unity.
b. The DID population is at least 100,000 or at least one-third of
that of the central municipality.
2. Potential first-order outlying municipalities are those in which at
least 10 percent of employed residents work in the central munici-
pality. For each of these, choose the central municipality that has the
highest commuting ratio. The procedures applied in the first itera-
tion are applied to determine higher-order outlying municipalities.
6.5.3.3 Other Iterations
The procedures used in the second iteration are used for subsequent itera-
tions. Step 1b in the second iteration for adding an outlying municipality to
the core remains the same. In particular, the central municipality is the one
2713_C006.fm Page 92 Monday, September 26, 2005 2:05 PM
Copyright © 2006 Taylor & Francis Group, LLC
Urban Employment Areas: Defining Japanese Metropolitan Areas
93
identified in the first iteration and does not include those added in the second
iteration.
6.6 Urban-Employment Areas for the 1995 Population
For the 1995 population census, three iterations were needed to define the
UEAs. The total number of UEAs is 278, of which 118 are MEAs and 160 are
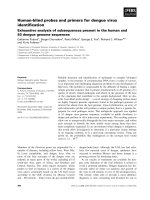
McEAs. Figure 6.1 maps Japan’s MEAs. Table 6.1 presents a rough outline
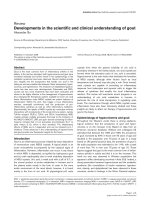
of the requirements of UEAs. Figure 6.2 shows MEAs, McEAs, DIDs, and
municipality boundaries in Ibaraki Prefecture. The darkest gray areas within
MEAs and McEAs are DIDs. The second-darkest areas are the cores of MEAs
and McEAs, and light-gray areas are their outlying areas. Light-gray curves
show boundaries of municipalities (cities, towns, and villages).
FIGURE 6.1
The Metropolitan Employment Areas for the 1995 population census.
Sapporo
Sendai
Tokyo
Nagoya
Osaka
Hiroshima
Fukuoka
2713_C006.fm Page 93 Monday, September 26, 2005 2:05 PM
Copyright © 2006 Taylor & Francis Group, LLC
94
GIS-based Studies in the Humanities and Social Sciences
6.7 The Construction of the MEA Economic Database
Since the building blocks of the UEAs are local municipalities, the UEA data
can be obtained by summing the municipality-level data. However, data on
many important economic indicators are not available at the municipality
level. For example, most production data are available only at the prefectural
level. Kurima and Ohkawara (2001) constructed MEA data for total produc-
tion (value added), private capital, and social-overhead capital.
TABLE 6.1
Requirements of Urban Employment Areas
Requirement Urban Employment Area
Categories Metropolitan Employment Area: The DID population of the core is
at least 50,000.
Micropolitan Employment Area: The DID population of the core is
at least 10,000 and less than 50,000.
Qualification of Areas City of at least 10,000 DID people.
Qualification of
Central
Municipalities
(Cores)
Municipalities that satisfy either of the following two requirements
are included in the core. (The core may include more than one
municipality.)
(a) The DID population is at least 10,000, and the municipality is
not an outlying area of another core.
(b) The requirements for an outlying area are satisfied, and the
following two requirements are also satisfied.
(i) The employees-to-residents ratio is at least unity.
(ii) The DID population is at least 100,000 or one-third of the
core.
For a pair of municipalities, each of which satisfies the requirement
for being in a core and also satisfies the commuting-ratio
requirement for being an outlying area of the other municipality,
the one with the lowest commuting ratio is in the core, and the
other is its outlying area.
Qualification of
Outlying
Municipalities
(a) A municipality is a first-order outlying area of a core if at least
10 percent of its employed residents work in the core.
(b) A municipality is a second-order outlying area of a core if at
least 10 percent of its employed residents work in an outlying
municipality and the commuting ratio to the municipality is
the highest among all target municipalities. Higher-order (i.e.,
third-order, fourth-order, etc.) outlying municipalities are
defined analogously.
(c) If a municipality satisfies requirement (a) for more than one
core, it is included in the outlying area of the core with which
it has the strongest commuting ties.
(d) If a municipality satisfies the requirement for an outlying area
of a core, as well as for another outlying municipality, it is an
outlying area of the one with which it has the highest
commuting ratio.
2713_C006.fm Page 94 Monday, September 26, 2005 2:05 PM
Copyright © 2006 Taylor & Francis Group, LLC
Urban Employment Areas: Defining Japanese Metropolitan Areas
95
The Annual Report on the Prefectural Accounts includes detailed produc-
tion data for 47 prefectures and major cities (11 cities up to 1988 and 12 from
1989). Private capital (for manufacturing and nonmanufacturing industries)
and social-overhead capital (for 12 industries) are available for prefectures
(but not for major cities). Kurima and Ohkawara (2001) construct MEA data
by combining these data with the employment data for local municipalities.
First, note that an MEA is a collection of local municipalities that may
belong to different prefectures. Kurima and Ohkawara (2001) allocate the
prefecture-level data to municipalities by using proportional allotment and
then aggregate them to obtain MEA data. In prefectures that include the
major cities, they construct the data for the remaining areas and allocate
them to municipalities outside those cities. The production data are available
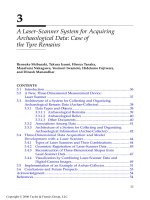
for 14 industrial categories (12 industries, the public sector, and others). The
output of each industry is allocated to municipalities on the basis of the
industry employment shares. For example, consider an MEA denoted by
A
.
Denote the number of workers in industry
i
in municipality
j
by , and
denote the total production and employment of the prefecture (denoted by
I
) that contains the MEA by and , respectively. Total production
in the MEA is then
Second, the private capital in each MEA is obtained by using proportional
allotment on the basis of the production shares in manufacturing and non-
manufacturing industries (rather than employment shares).
FIGURE 6.2
The relationship among MEAs, McEAs, DIDs, and municipalities: An example of Ibaraki Pre-
fecture.
Shimodate
Mitsukaido
Tokyo
Kashima
Mito
MEA
core
core
McEA
DID
Tsukuba
Nij(,)
YIi(,) NIi(,)
YA YIi
Nij
NIj
ij
() (,)
(,)
(,)
=
∑∑
2713_C006.fm Page 95 Monday, September 26, 2005 2:05 PM
Copyright © 2006 Taylor & Francis Group, LLC
96
GIS-based Studies in the Humanities and Social Sciences
Third, different allotment procedures are used for each of the four types
of social-overhead capital. In agriculture, forestry, and fishing, social-over-
head capital is allocated on the basis of production shares in the agricultural
sector. In industrial infrastructure, allocation is based on the production
shares in the manufacturing industry. In telecommunications and railways,
allocation is based on total production. Allocation of infrastructure for resi-
dents, such as parks and neighborhood streets, is based on population.
We have annual data on production and the capital stock, but census
population and employment data are collected only every five years. Annual
population data are available from the Basic Resident Registers, but their
definitions differ slightly from those of the more detailed census data. The
annual data are constructed by using the Resident Registers data to modify
the simple linear interpolations of the census data. Let
P
denote the census
population data and let
Q
denote the Resident Registers data. The annual
data that we use, , are then
where n is the census year, , and
The Annual Report on Prefecture Accounts contains annual employment
data for three industry categories — namely, primary, secondary, and tertiary
— but these are only available for prefectures and 12 large cities. We use
these data for
Q
in the procedure described above.
The original data sources for the MEA economic database are as follows.
Number of employees and population: Population Censuses of 1980,
1985, 1990, and 1995, and Basic Resident Registers (Jumin Kihon
Daicho) 1980–1995.
Production (Value Added): Annual Report on the Prefecture Accounts.
Private Capital Stock and Social Overhead Capital: Estimates by the
Central Research Institute of the Electric Power Industry (CRIEPI).
(The method of estimation is explained in Ohkawara et al., 1985.)
ˆ
P
ni+
ˆ
()
ˆ
PP
i
PP
Q
Q
ni n n n
ni
ni
++
+
+
=+ −
5
5
i = 1234,,,
ˆ
i
ni n n n++
=+ −
5
5
2713_C006.fm Page 96 Monday, September 26, 2005 2:05 PM
Copyright © 2006 Taylor & Francis Group, LLC
Urban Employment Areas: Defining Japanese Metropolitan Areas
97
6.8 Conclusion
We have developed an urban-area definition called the UEA for Japanese
cities. The UEAs are divided between MEAs (large UEAs) and McEAs (small
UEAs) according to their sizes. We have also constructed an economic data-
base for the MEAs. The UEAs for the population censuses of 1980, 1990,
1995, and 2000 and the MEA economic database for the 1995 definition can
be found on the UEA Web site (www.urban.e.u-tokyo.ac.jp/UEA/
index_e.htm). A number of researchers and government agencies have
already used the UEA. Chapter 8 of this book contains an example of empir-
ical studies that use the MEA economic database.
Acknowledgment
This research was supported by Grant-in-Aid for Scientific Research No.
10202202 and no.1661002 from the Ministry of Education, Culture, Sports,
Science, and Technology.
References
Kanemoto, Y. and K. Tokuoka, Proposal for the Standards of Metropolitan Areas of
Japan,
J. Appl. Region. Sci.,
7, 1–15, 2002 (in Japanese).
Kurima, R. and T. Ohkawara, Construction of MEA-based Economic Data, mimeo,
2001 (in Japanese).
Office of Management and Budget, Recommendations From the Metropolitan Area
Standards Review Committee to the Office of Management and Budget Con-
cerning Changes to the Standards for Defining Metropolitan Areas,
Federal
Register,
64(202), October 20, 1999.
Office of Management and Budget,
Standards for Defining Metropolitan and Micro-
politan Statistical Areas,
Federal Register,
65(249) December 27, 2000.
Ohkawara, T., Matsu-ura, Y., and Chuma, M., Chiiki Keizai Data no Kaihatsu Sono
1 — Seizougyou Shihon Sutokku to Shakai Shihon Sutokku no Suikei (Estima-
tion of Regional Economic Data Part 1: Manufacturing Capital and Social
Overhead Capital), Central Research Institute of Electric Power Industry, Re-
port No. 585005, 1985 (in Japanese).
2713_C006.fm Page 97 Monday, September 26, 2005 2:05 PM
Copyright © 2006 Taylor & Francis Group, LLC