Regional Scale Ecological Risk Assessment - Chapter 10 pdf
Bạn đang xem bản rút gọn của tài liệu. Xem và tải ngay bản đầy đủ của tài liệu tại đây (993.62 KB, 36 trang )
195
C
HAPTER
10
Using the Relative Risk Model for a
Regional-Scale Ecological
Risk Assessment of the
Squalicum Creek Watershed
Joy C. Chen and Wayne G. Landis
CONTENTS
Part I: Using the Relative Risk Model for a Regional-Scale Ecological
Risk Assessment of the Squalicum Creek Watershed 197
Introduction 197
Methods 197
Problem Formulation 198
Study Area 198
Ecological Endpoints Identification 199
Conceptual Model 200
Risk Analysis 201
Identifying and Ranking 201
Stressor Sources 201
Habitats 202
Possible Endpoint Locations 203
Filters 203
Integrating Ranks and Filters 206
Endpoint Risk Scores 206
Stressor Risk Scores 206
Stressor Sources Risk Scores 206
Habitat Risk Scores 206
Risk Region Risk Scores 206
Risk Characterization 206
L1655_C10.fm Page 195 Friday, October 1, 2004 10:35 AM
© 2005 by CRC Press LLC
196 REGIONAL SCALE ECOLOGICAL RISK ASSESSMENT
Risk Estimation Results 207
Stressor Sources 207
Stressors 207
Habitats 207
Endpoints 209
Risk Regions 209
Relative Risk in the Squalicum Creek Watershed 211
Uncertainty Analysis 211
Sensitivity Analysis Methodology 212
Sensitivity Analysis Results 213
Discussion 214
Application of the Relative Risk Model 214
Risk Management 215
Conclusion 216
Part II: Risk Prediction to Management Options in the Squalicum Creek
Watershed Using the Relative Risk Model Ecological Risk Assessment 216
Introduction 216
Methods 218
Risk Assessment 219
List of Decision Options 219
Option 1: Convert the Impassable Culverts to Passable Culverts 219
Option 2: Increase 25 and 50%, Respectively, of Forested Area
in Agricultural Land Riparian Corridor 219
Option 3: Eliminate Forestry Activities 220
Option 4: No Action — Resulting in 100% Development in Undeveloped
and Forested Land in Urban Growth Area 220
Option 5: Divert Storm Runoff from Industrial and Commercial Areas
to Treatment Facilities 220
Option 6: Eliminate Mining Activities 220
Uncertainty Analysis 220
Results 221
Risk Changes to Option 1: Convert the Impassable Culverts to Passable
Culverts 221
Risk Changes to Option 2: Increase 25 and 50% of Forested Area
in Agricultural Land Riparian Corridor 225
Risk Changes to Option 3: Eliminate Forestry Activites 225
Risk Changes to Option 4: No Action — Resulting a 100% Development
in Undeveloped and Forested Land in Urban Growth Area 225
Risk Changes to Option 5: Divert Storm Runoff from Industrial and
Commercial to Treatment Facilities 225
Risk Changes to Option 6: Eliminate Mining Activities 225
Sensitivity Analysis Results 226
Discussion 226
Conclusions 227
References 228
Appendix A 229
L1655_C10.fm Page 196 Friday, October 1, 2004 10:35 AM
© 2005 by CRC Press LLC
USING THE RELATIVE RISK MODEL 197
PART I: USING THE RELATIVE RISK MODEL
FOR A REGIONAL-SCALE ECOLOGICAL RISK ASSESSMENT
OF THE SQUALICUM CREEK WATERSHED
Introduction
Ecological risk assessment (EcoRA) methodologies are well established, and
general guidelines are listed in the “Guidelines for Ecological Risk Assessment”
(USEPA 1998). Most EcoRA methods follow the three-phase approach: problem
formulation, risk analysis, and risk characterization. These methods differ mostly in
the risk analysis and the risk characterization phases. While many risk analysis and
risk characterization methods are available (Landis et al. 1998), most of these
methods are exposure- and effect-based methods that cannot accurately convey risks
unless information is available for all exposure pathways for the risk components.
Uncertainty associated with these methods increases greatly when there is insuffi-
cient exposure and effect data. As in most regional-scale assessments, there is
insufficient information in this study to use the exposure- and effect-based methods.
Subsequently, we used the alternative method, the ranked-based method for this
study. The rank-based method is a probability-based method that determines the
relative risks associated with each stressor instead of determining the absolute effects
due to particular stressors. In cases where data are limited such as in this study, the
rank-based method can minimize the uncertainties associated with the insufficient
information on the characterization of exposure and ecological effects in the expo-
sure–effect methods.
In this study, we followed the traditional three-phase approach of the EcoRA.
We used the relative risk model (RRM), a ranked-based method, in the risk analysis
phase of this EcoRA. We performed an EcoRA of the Squalicum Creek watershed,
Bellingham, WA, using the RRM. The objective of our project is to determine the
relative contribution of risks of adverse impacts of stressors to the Squalicum Creek
watershed habitats, and to determine the utility of the RRM on a small-scale eco-
logical system relative to the studies mentioned above.
Methods
Methodology used in this study was similar to that used by Landis and Wiegers
(1997) and Wiegers et al.
(1998) with few deviations from the original RRM in the
risk analysis phase as stated below.
The risk analysis phase in the original methodology includes two steps: (1)
performing a comparative analysis to determine the relative risks in each risk region,
and (2) performing quantitative analyses to determine the severity of risk in the
study area and to confirm the results from the comparative analysis. In this study,
we only included the comparative analysis and left out the quantitative analysis.
This is due to the limited site-specific quantitative data available for our study area,
which is required by the quantitative analysis.
In addition to the risk components included in the original methodology, we
have also included an extra risk component, the stressor group. We included these
L1655_C10.fm Page 197 Friday, October 1, 2004 10:35 AM
© 2005 by CRC Press LLC
198 REGIONAL SCALE ECOLOGICAL RISK ASSESSMENT
groups of stressors in this study to indicate the possible types of stressors releasing
or resulting from the stressor sources.
Possible endpoint location is another extra risk component apart from those listed
in the original methodology. We included the possible endpoint location because we
included abiotic endpoint in our study. The geological information of the endpoints is
essential for a risk assessment. The location of biotic endpoints is normally defined by
the habitat of the biotic endpoints. However, the location of abiotic endpoints does not
necessarily correlate with any type of habitat and, therefore, using the habitat to define
these endpoint locations is improper. Therefore, we added a new risk component, the
possible endpoint location, to better represent the abiotic endpoint location. Extra filters
have also been added to this study in response to the additional risk components.
In the original methodology, risk scores for each risk region were calculated by
multiplying the risk ranks by the list of associated filters, called the weighting factor.
Risks resulting from a particular source and occurring in a particular habitat were
calculated by adding the related score for each risk region. In this study, we modified
the basic equations to account for the abiotic endpoints and the alterations in the
filters in this study.
PROBLEM FORMULATION
This section summarizes the physical and biological characteristics of the study
area, identifies the stressors and endpoints derived from stakeholders’ values, defines
risk regions, and includes the site conceptual model.
Study Area
The Squalicum Creek watershed lies within the city of Bellingham and extends
includes the entire Squalicum Creek watershed plus the portion of the Port of
Bellingham landfills into which the creek drains. The landfills were included for
two reasons: (1) the landfills could potentially act as a physical barrier to migratory
fish in and out of the creek, and (2) the stormwater from these landfills flows directly
into the mouth of the creek.
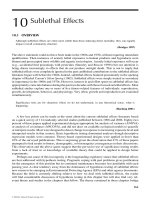
The study area is 62 km
2
and the creek measured 5.99 km from the longest
tributary to the outfall where it drains into the bay. The hydrology system is com-
prised of the main stream, Squalicum Creek, and a main tributary, Baker Creek
(Figure 10.1). The entire system generally flows from northeast to southwest. There
are two constructed lakes, Sunset Pond and Bug Lake, located in the middle section
of Squalicum Creek.
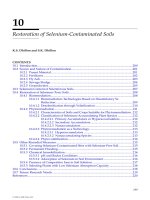
Region boundaries were defined by grouping parcels with similar landuse types, topog-
raphy (USGA 2000), and hydrology (Hoerauf 1999). In cases where these factors were
insufficient to determine the boundaries, the city boundary was followed.
Regions 1 and 3 are located within the city limits, regions 4, 5, and 6 are located
in the county, and region 2 is under the jurisdiction of both the City of Bellingham
L1655_C10.fm Page 198 Friday, October 1, 2004 10:35 AM
© 2005 by CRC Press LLC
into the unincorporated areas of Whatcom County (Figure 10.1). The study area
For this assessment, the study area was divided into six risk regions (Figure 10.2).
USING THE RELATIVE RISK MODEL 199
and Whatcom County. Region 1 consists of the Port of Bellingham, along with
mainly residential, mining, transportation, and park landuse. It contains the lower
portion of Squalicum Creek that receives water from all tributaries. Region 2 is
comprised mainly of commercial, mining, heavy industrial, agricultural, and unde-
veloped landuse. It contains one natural lake, two constructed lakes, and the middle
section of both Baker and Squalicum Creeks. Region 3 is comprised mainly of
commercial and residential landuse, along with a golf course and some undeveloped
land. It contains the middle portion of Baker Creek. Region 4 consists mainly of
forested, undeveloped, agricultural, and residential landuse. It contains two natural
lakes and a portion of the Squalicum Creek headwaters. Region 5 consists of mainly
agricultural, residential, and forested landuse. It also contains a portion of the
Squalicum Creek headwaters. Region 6 consists of mainly agricultural, residential,
forested, and undeveloped landuse. It contains the upstream sections of Baker Creek.
Ecological Endpoints Identification
The ecological endpoints were chosen by members of the Squalicum Creek Risk
Assessment Group that consists of stakeholders such as the City of Bellingham,
Whatcom County Conservation District, and the Nooksack Salmon Enhancement
Figure 10.1
Study area boundary for the Squalicum Creek watershed ecological risk
assessment.
City of
Bellingham
1
N
1 2 3 4 Km0
Legend
Creeks
City/County Boundary
Port of Bellingham
Bay and Lakes
Study Area Boundary
Washington
State
Squalicum
Creek
Whatcom
County
Baker
Creek
L1655_C10.fm Page 199 Friday, October 1, 2004 10:35 AM
© 2005 by CRC Press LLC
200 REGIONAL SCALE ECOLOGICAL RISK ASSESSMENT
Association. The USEPA Guidelines for Ecological Risk Assessment (USEPA 1998)
were followed in selecting the assessment endpoints. The criteria for endpoints are:
(1) ecological relevance, (2) susceptibility to known or potential stressors, and (3)
relevance to management goals. The first two endpoints are classified as abiotic
endpoints and the last four are classified as biotic endpoints. The assessment end-
points for this assessment are:
1. Abiotic endpoints
• Flood control
• Adequate land and ecological attributes for recreational uses
2. Biotic endpoints
• Viable nonmigratory coldwater fish populations
• Life cycle opportunities for salmonids
• Viable native terrestrial wildlife species populations
• Adequate wetland habitat to support wetland species populations
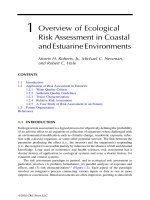
Conceptual Model
The assumed relationships among the stressor sources, stressors, habitats, and
This model serves as the basis for all risk assessment calculations discussed in the
following sections.
Figure 10.2
Legend
Residential
Light Industrial
Heavy Industrial
Commercial
Park
Mining
Forest
Undeveloped
Agricultural
Chemical Related
Water Areas
Forestry Activities
Transportation
Risk Region
Boundary
L1655_C10.fm Page 200 Friday, October 1, 2004 10:35 AM
© 2005 by CRC Press LLC
endpoints for the study area are summarized in the conceptual model (Figure 10.3).
Risk regions and landuses in the study area. (See color insert following page 178.)
USING THE RELATIVE RISK MODEL 201
RISK ANALYSIS
In general, we followed the risk analysis methodology used by Wiegers et
al.
(1998) with minor deviations as previously discussed.
Identifying and Ranking
We identified and ranked each stressor source, possible endpoint location, and
habitat. We divided each of these risk components into four groups: no, low, medium,
and high concentration and we assigned ranks 0, 2, 4, and 6 to each group, respec-
tively. The no concentration group equals 0% of the risk component in a risk region.
For example, if there were no warmwater habitat available in risk region 1, then a
risk rank of 0 would be assigned to the warmwater habitat in risk region 1. The
group intervals were categorized using Jenk’s Optimization in ArcView
GIS. This
ranking method was applied to all risk components except for coldwater fish habitat.
Stressor Sources
Eleven landuses were classified as the sources of stressors. They are: agricultural,
residential, light industrial, heavy industrial, mining, chemical industries, commer-
cial, park, transportation, forestry activities, and stream barrier construction. Stream
barrier construction landuse is defined as the construction of any physical object
such as a culvert that could inhibit the migration of aquatic species. Landuse cate-
gories were determined using the following sources: (1) the Whatcom County Code
(Whatcom County Council 2000) and the Whatcom County Land Use Codes (What-
com County Assessors Office 2000
)
provided by the Whatcom County Assessors’
Office, (2) assistance from the City of Bellingham Planning Office, (3) USEPA
WRIA BASINS database (USEPA 2000
)
, and (4) fish presence mapping project data
(Whatcom Conservation District 2000).
Figure 10.3
Conceptual model for the Squalicum Creek watershed ecological risk assess-
ment.
AbioticBiotic
Biotic
Stressor
Filter
Abiotic
Stressor
Filter
Sources of
Stressors Filter
Habitat
Filter
Habitats
Biotic
Effect
Filter
Endpoints Endpoints
Salmonids Terrestrial Wetland
Wildlife
Nonmigratory
Coldwater Fish
Flood
Control
Recreational
Uses
Stressors
Possible
Endpoint
Locations
Sources
Abiotic
Effect
Filter
L1655_C10.fm Page 201 Friday, October 1, 2004 10:35 AM
© 2005 by CRC Press LLC
202 REGIONAL SCALE ECOLOGICAL RISK ASSESSMENT
Eight stressor groups were chosen for this study because they could potentially
adversely affect the endpoints. These stressor groups are: increased runoff, increased
chemicals, altered stream flow, increased nutrients, altered forest, altered wetland,
increased sediments, and introduced terrestrial foreign species.
Increased runoff was considered a stressor because it can increase the peak flow
and soil erosion. It can also decrease the subsurface flow and, therefore, decrease
the amount of water available for the species. Increased chemicals were identified
as a stressor because they can lead to toxicity. An alteration of stream flow could
change the stream temperature, obstruct the migratory routes for aquatic species,
alter the water quality, and change the composition of the substrate, i.e., the aquatic
habitat. Increasing the amounts of nutrients such as fecal coliform, nitrogen, and
phosphorous compounds can lead to oxygen depletion in the aquatic habitat. Alter-
ations of the forests and wetlands were considered as stressors because they reduce
habitat availability to species. Alteration of wetlands could decrease the vegetation
cover along the streams and lakes and, therefore, increase the water temperature and
decrease the pool habitats and nutrients in the system. Altering the wetlands could
also change the soil and water chemistry in the watershed and in the adjacent marine
habitat. Increased sediment was identified as a stressor because it could reduce the
amount of sunlight penetrating through the water, thereby reducing the photosyn-
thesis process. Increased sediment could also disrupt the oxygen intake of some
aquatic species and threaten their survival. Bringing in terrestrial-introduced species
could lead to potential competition with the native species for resources and habitats.
A summary of the assumed relationships between the sources of stressors and the
All landuses but mining and stream barrier construction were ranked using the
percentage of land coverage of each landuse per region. The number of mines and
stream barriers was used to rank the mining and the stream barrier construction
landuse, respectively. Transportation landuse coverage was determined using two
sources: the landuse parcel GIS data that include the concentration of all transpor-
tation facilities except roads, and the City of Bellingham GIS street data that include
the area of the street coverage. Forestry activities were found only in region 4, and
a low rank was assigned due to the relatively small land coverage of these activities.
Habitats
For this assessment, all areas with saline water were included as coastal habitat.
Lakes with surface area greater than 139.5 m
2
defined the warmwater habitat.
Coldwater fish habitat included all streams plus lakes with surface area less than
139.5 m
2
. Riparian habitat included areas within 60.96 m from the streams and lakes
that were classified as the following landuses: forested, undeveloped, and park.
Terrestrial habitat included all areas other than the riparian habitat that were classified
as forested, undeveloped, or park landuse.
All but the coldwater fish habitat ranks were determined using the methodology
described in the identifying and ranking section. The coldwater fish habitats were
assumed to be of good quality and were assigned a high rank for all regions due to
L1655_C10.fm Page 202 Friday, October 1, 2004 10:35 AM
© 2005 by CRC Press LLC
stressor groups is indicated in Figure 10.4.
Table 10.1 provides a summary of the criteria for the stressor source ranks.
USING THE RELATIVE RISK MODEL 203
the following reasons: (1) there are insufficient water quality and habitat data for
the creek in all risk regions, (2) all regions include sections of the creek, and (3)
there are insufficient data to determine the land coverage of the creek. Coastal habitat
summary of the habitat ranks criteria.
Possible Endpoint Locations
Areas with park landuse defined possible recreational uses endpoint location for
this risk assessment
.
The 200-year floodplain for the Squalicum Creek watershed
defines the possible flood control endpoint location. The percentage of the possible
provides a summary of the criteria for possible endpoint location ranks.
FILTERS
Six filters were used in this assessment to represent the relationships among the
risk components. The sources-of-stressors filter indicates if a particular source
releases a certain stressor group. The biotic stressor filter indicates if a stressor would
occur and persist in and affect the habitat. The biotic effect filter indicates if an
alteration of the habitat could affect an endpoint. The habitat filter for salmonids
indicates if the streams in a particular risk region are located upstream of a physical
barrier to salmonid migration. The habitat filter is included because of the unique
Figure 10.4
Assumed relationships between stressor sources and stressor groups.
Landuse (Sources of Stressors)
Agricultural
Residential
Light Industrial
Mining
Chemical
Industries
Commercial
Park
Transportation
Forestry
Activities
Increased
Runoff
Increased
Sediments
Introduced
Terrestrial
Foreign
Species
Altered
Stream
Flow
Altered
Forest
Altered
Wetland
Increased
Chemicals
x
x
x
xxx
x
xx
xx
x
x
xxx
xxx
xxx
x
x
xx
xxx
x
xx
xxx
xxx
xx
xxx
xx
xxx
x
x
xxx
xxx
xx x
x
xx
xxx
Stressors
Legend
Pathway Exists
Pathway Absent
Heavy Industrial
Increased
Nutrients
(N/P/Fecal
Coliform)
L1655_C10.fm Page 203 Friday, October 1, 2004 10:35 AM
© 2005 by CRC Press LLC
was found only in region 1 and was assigned a high rank. Table 10.2 provides a
endpoint locations in each risk region was used to determine the ranks. Table 10.3
204 REGIONAL SCALE ECOLOGICAL RISK ASSESSMENT
Table 10.1
Ranking Criteria for Stressor Sources
Landuses Criteria Ranks
Agricultural % Agricultural
0 0 (No impact)
0.76–12.83 2 (Low)
12.84–22.37 4 (Medium)
22.38–34.93 6 (High)
Residential % Residential
0 0 (No impact)
21.82–24.72 2 (Low)
24.73–29.71 4 (Medium)
29.72–42.84 6 (High)
Light industrial % Light industrial
0 0 (No impact)
0.01–0.29 2 (Low)
0.30–0.67 4 (Medium)
Heavy industrial % Heavy industrial
0 0 (No impact)
0.01–0.37 2 (Low)
0.38–0.97 4 (Medium)
0.98–5.45 6 (High)
Mining Number of mines
0 0 (No impact)
1–2 2 (Low)
Chemical industrial % Chemical industrial
0 0 (No impact)
0.001–0.01 2 (Low)
0.011–0.50 4 (Medium)
Commercial % Commercial
0 0 (No impact)
0.31–0.41 2 (Low)
0.42–11.36 4 (Medium)
11.37–29.73 6 (High)
Park % Park
0 0 (No impact)
0.1–0.45 2 (Low)
0.46–0.92 4 (Medium)
0.93–10.4 6 (High)
Transportation % Transportation
0 0 (No impact)
0.73–1.1 2 (Low)
1.2–5.44 4 (Medium)
5.45–7.73 6 (High)
Forestry activities % Forestry activities
0 0 (No impact)
0.1–2.61 2 (Low)
Physical barrier construction Number of physical barriers
0 0 (No impact)
1 6 (High)
L1655_C10.fm Page 204 Friday, October 1, 2004 10:35 AM
© 2005 by CRC Press LLC
USING THE RELATIVE RISK MODEL 205
migratory behavior of salmonids. The habitat filter enables us to address the specific
portion of the habitat the salmonids utilize and assesses the impact of each physical
barrier to salmonids. The abiotic stressor filter indicates if a stressor would occur
and persist in the possible endpoint location. The abiotic effect filter indicates if the
stressor could affect an endpoint. For all but the habitat filter for salmonids, if the
answer to the questions is yes, which indicates the pathway exists, a rank of 1 is
assigned. In cases where the answer is no, a rank of 0 is assigned. For the habitat
filter for salmonids, a 1 is assigned if no stream in the region is located upstream
of a physical barrier, a 0.5 is assigned if only portions of the streams in the region
are located upstream of a barrier, and a 0 is assigned if all the streams in the region
are located upstream of a barrier.
Table 10.2
Ranking Criteria for Stressor Groups
Habitats Criteria Ranks
Warm water % Warm water
0 0 (No impact)
0.01–0.03 2 (Low)
Cold water Stream absent 0 (No impact)
Stream present 6 (High)
Riparian % Riparian
0 0 (No impact)
2.72–3.61 2 (Low)
3.62–5.11 4 (Medium)
5.12–7.2 6 (High)
Terrestrial % Terrestrial
0 0 (No impact)
10.85–14.74 2 (Low)
14.75–26.72 4 (Medium)
26.73–38.07 6 (High)
Coastal % Coastal
0 0 (No impact)
0.1–10.33 2 (Low)
Table 10.3
Ranking Criteria for Possible Endpoint Locations
Possible Endpoint Locations Criteria Ranks
Recreational uses % Park landuse
0 0 (No impact)
0.1–0.45 10 (Low)
0.46–0.92 20 (Medium)
0.93–10.4 30 (High)
Flood control % 200-year floodplain
0 0 (No impact)
0.1–2.5 10 (Low)
2.6–5.98 20 (Medium)
5.99–8.86 30 (High)
L1655_C10.fm Page 205 Friday, October 1, 2004 10:35 AM
© 2005 by CRC Press LLC
206 REGIONAL SCALE ECOLOGICAL RISK ASSESSMENT
INTEGRATING RANKS AND FILTERS
By following the original methodology described by Landis and Wiegers (1997
)
,
we integrated the risk ranks and filters to generate risk scores. All equations in this
study were derived from the basic equations used in their study as shown in Equations
10.1, 10.2, and 10.3 (Appendix A). Methodology used to calculate the risk scores
in this study is listed in the following sections.
Endpoint Risk Scores
Endpoint risk scores signify the relative risks to each endpoint. Each endpoint
risk score is a summation of all the risk scores contributing to the particular endpoint
in the entire study area (Equation 10.4 through Equation 10.6 in Appendix A).
Stressor Risk Scores
Stressor risk scores indicate the relative risks contributed by each of the stressors.
Each stressor risk score is a summation of all the risk scores contributed by the
particular stressor in the entire study area (Equation 10.7 in Appendix A).
Stressor Sources Risk Scores
The stressor sources risk scores represent the relative risks contributed by each
of the stressor sources. The risk score of each source is a summation of all the risk
scores contributed by the particular stressor source in the entire study area (Equation
10.8 in Appendix A).
Habitat Risk Scores
Habitat risk scores indicate the relative risks occurring within a particular habitat.
Each habitat risk score is a summation of all the risk scores contributed by the
particular habitat in the entire study area (Equation 10.9 in Appendix A).
Risk Region Risk Scores
Risk region risk scores represent the relative risks to each risk region. Each risk
region risk score is a summation of all the risk scores contributing to the particular
risk region (Equation 10.10 in Appendix A). Jenk’s Optimization was also performed
to cluster the risk regions into high, medium, and low risk categories.
Risk Characterization
This section summarizes the information in the problem formulation phase and in
the analysis phase to produce a list of risk estimation for the study area. This section
describes the significance of the risk estimation in terms of stakeholders’ values, deter-
mines the uncertainties, and lists the assumptions for this risk assessment. Assumptions
L1655_C10.fm Page 206 Friday, October 1, 2004 10:35 AM
© 2005 by CRC Press LLC
USING THE RELATIVE RISK MODEL 207
for this risk assessment are the same as those listed in Landis and Wiegers (1997)
and Wiegers et al. (1998).
RISK ESTIMATION RESULTS
We summarized the risk results from the risk analysis phase to generate a list
of risk estimations. In the following sections, we state the risk estimation results
associated with each risk component. At the end of these sections, we address the
relevance of the risk estimations to the entire watershed. The risk estimation results
only represent the relative probability of risks to each risk component and not the
actual magnitude of risks. Using these risk estimations directly to quantify the
magnitude of risks would be inaccurate due to the uncertainties associated with the
risk assessment. It is necessary to integrate the risk estimations with site-specific
quantitative data to accurately determine the magnitude of risks.
Stressor Sources
indicated that residential landuse contributed the most risks to the watershed,
whereas light and chemical industries, mining activities, forestry activities, and the
construction of stream barriers contributed relatively less risks to the watershed.
Results also showed that residential, mining, commercial, park, and transportation
landuses contributed the most risks to region 1, while agricultural, light, heavy, and
chemical industrial landuses contributed the most risks to region 2. Stream barrier
construction and commercial landuse contributed the most risk to region 3. Forestry
activities were observed only in region 4. The RRM results show that commercial
landuse contributed more risks to region 1 than to region 3; however, due to the
uncertainties associated with the model, the small risk differences between the two
regions were considered insignificant.
Stressors
stream flow alteration, altered forest, and altered wetland contributed the most risk
to the watershed. Increased nutrients and introduced terrestrial foreign species con-
tributed relatively less risks to the watershed. Results also showed that all stressors
except increased runoff and introduced terrestrial foreign species contributed the
most risks to region 1. Increased runoff and introduced terrestrial foreign species
contributed the most risks to region 2 and region 4, respectively.
Habitats
that the coldwater habitat is at most risk and the warmwater habitat and the coastal
habitat are at relatively small risk. Results also showed that warmwater habitat is
L1655_C10.fm Page 207 Friday, October 1, 2004 10:35 AM
© 2005 by CRC Press LLC
Table 10.4 shows a summary of the stressor sources results. The risk assessment
Table 10.5 shows a summary of the stressor results. The RRM indicated that
Table 10.6 shows a summary of the habitat results. The assessment indicated
208 REGIONAL SCALE ECOLOGICAL RISK ASSESSMENT
Table 10.4
Stressor Sources Ranks Result (numbers represent risk scores)
Sources
Risk Light Heavy Chemical Forestry Physical Barrier
Regions Agricultural Residential Industrial Industrial Mining Industrial Commercial Park Transportation Activities Construction
1 1168 3216 0 2064 1000 0 1784 3420 2676 0 0
2 1912 892 1688 2532 812 748 1496 908 1496
0 0
3 772 702 672 672
0 0 1764 1484 1176
0 744
4 762 1412 0 640 0 542 1084 696
542 696 588
5 1188 1080 0 0 0 0 284 0 284 0 0
6 632 876 0 264 0 456 228 0 228 0 0
Table 10.5
Stressor Group Ranks Result (numbers represent risk scores)
Stressors
Risk Increased Increased Stream Flow Increased Altered Altered Increased Introduced Terrestrial
Regions Runoff Chemical Alteration Nutrients Forest Wetland Sediments Foreign Species
1 2220 2208 3000 1260 2940 3000 540 160
2 2280 1680 2340 864 2580 2340 256 144
3 1100 1100 1736 504 1540 1736 210 60
4 1020 1220 1274 588 1220 1274 168 198
5 480 480 416 312 480 416 108 144
6 520 520 360 216 520 360 48 140
L1655_C10.fm Page 208 Friday, October 1, 2004 10:35 AM
© 2005 by CRC Press LLC
USING THE RELATIVE RISK MODEL 209
most at risk in region 2, and coastal habitat is only found in region 1. Coldwater
habitat is most at risk in regions 1 and 2; riparian habitat is most at risk in regions
1, 2, and 4; and terrestrial habitat is most at risk in regions 2 and 4.
Endpoints
that wetlands are the most at-risk endpoint in the watershed, and terrestrial wildlife
species are the least at-risk endpoint. Life cycle opportunity for salmonids is the
endpoint with the second lowest risk. Results also showed that nonmigratory cold-
water fish, salmonids, and flood control endpoints are most at risk in regions 1 and
2, while terrestrial wildlife species are most at risk in regions 1 and 4, and recreational
uses and wetlands are most at risk in region 1 and region 2, respectively.
Risk Regions
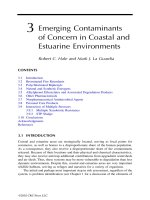
Figure 10.5 shows the risk results of risk regions as indicated by the RRM result.
The risk assessment indicated that there is a strong risk gradient in which the risk
decreases with the increasing risk regions number, i.e., the risk decreases as it moves
from the downstream regions located in the city limits to the upstream regions that
are located in the county area. Jenk’s Optimization categorized regions 1 and 2 as
high risks, regions 3 and 4 as medium risks, and regions 5 and 6 as low risks.
Table 10.6
Habitat Ranks Result (numbers represent risk scores)
Habitats
Risk Regions Warmwater Coldwater Riparian Terrestrial Coastal
1 0 3192 2816 392 888
2 704 3168 2784 768 0
3 0 2100 966 560 0
4 390 1950 2730 792 0
5 0 1764 832 240 0
6 0 1392 732 560 0
Figure 10.5
Sensitivity analysis: random component analysis result.
0
4000
8000
12000
16000
20000
1
Risk Regions
Risk Scores
Legend
RRM Result
20 Random
Iterations
Possible Range
23456
L1655_C10.fm Page 209 Friday, October 1, 2004 10:35 AM
© 2005 by CRC Press LLC
Table 10.7 shows a summary of the endpoint risk results. The RRM indicated
210 REGIONAL SCALE ECOLOGICAL RISK ASSESSMENT
Table 10.7
Endpoint Ranks Result (numbers represent risk scores)
Endpoints
Risk Nonmigratory Cold- Life Cycle Opportunities Flood Terrestrial Recreational
Regions Water Fish for salmonids Control Wildlife Species Uses Wetlands
1 1768 2064 3600 1196 4440 2260
2 1752 2104 3600 1080 1460 2488
3 1116 558 2000 556 2360 1396
4 1560 910 0 1176 1100 2216
5 796 796 0 328 0 916
6 940 0 0 524 0 1220
L1655_C10.fm Page 210 Friday, October 1, 2004 10:35 AM
© 2005 by CRC Press LLC
© 2005 by CRC Press LLC
USING THE RELATIVE RISK MODEL 211
Relative Risk in the Squalicum Creek Watershed
This risk assessment determined that residential landuse is the source that con-
tributes the most risks to the watershed. This result is not surprising knowing that
35% of the watershed consists of this landuse. The assessment also identified the
stream flow alteration, altered forest, and altered wetland stressors as contributing
the most risks to the watershed. This is due to the fact that these stressors could
affect the endpoints through more exposure pathways than other stressors. Coldwater
habitat was found to be most at risk in the Squalicum Creek watershed, especially
in regions 1 and 2. Riparian habitat is the second most at-risk habitat, and it is most
affected in regions 1, 2, and 4. Together these lead to the conclusion that the
remediation of coldwater and riparian habitats in regions 1 and 2 should reduce the
most risks to habitats in the watershed.
Wetland is the endpoint that is determined to be the most at risk. Wetlands are
affected by the alteration of all habitats and, therefore, more exposure pathways are
linked to this endpoint. Life cycle opportunity for salmonids receives relatively low
risk because in three of the six risk regions, the construction of physical barriers
prevented migration of salmonids to the upstream regions of these barriers. The
absence of salmonids in these upstream regions leads to incomplete exposure path-
ways; therefore, salmonids are not at risk in these regions. The predicted strong risk
gradient, increasing risk from upstream regions to downstream regions, is expected
because there is a greater combination of habitats and stressor sources in the down-
stream regions than in the upstream regions.
UNCERTAINTY ANALYSIS
As mentioned earlier, we included an uncertainty analysis in the risk character-
ization phase to address all the uncertainties associated with this risk assessment.
One of the sources of uncertainties in this risk assessment is stochasticity, which
refers to the random nature of the universe, such as the random variations of endpoint
responses to stressors. This type of uncertainty can only be estimated and usually
cannot be reduced. Most uncertainties for this study are due to the lack of data or
knowledge regarding the risk components and ecological pathways. Exposure path-
ways in this study were assigned based on professional judgment, which could
potentially lead to error in the model. Predetermined risk components such as
stressors and habitats could also lead to error in the risk predictions.
In this study, we assumed that risk in each region is discrete, but this assumption
could lead to uncertainties because most stressors flow from upstream to downstream,
and some risks from upstream regions could potentially enter into the downstream
regions. Due to the lack of data, coldwater habitat in all risk regions was assigned
a high rank for this study. There is a potential for variation in the coldwater habitat
that could lead to uncertainty in the RRM result. Uncertainties also arise from the
lack of information regarding the undeveloped land conditions. The undeveloped
land makes up a portion of the terrestrial habitat; therefore, variation in the unde-
veloped land data could lead to variation in the terrestrial habitat data input into the
L1655_C10.fm Page 211 Friday, October 1, 2004 10:35 AM
© 2005 by CRC Press LLC
212 REGIONAL SCALE ECOLOGICAL RISK ASSESSMENT
RRM. There are currently insufficient data for stressors, habitats, and possible
endpoint locations in the Squalicum Creek watershed, especially in regions 3, 5, and
6. Landuse data were used in this study as a substitute for the missing information.
The landuse data were not collected for use in the risk assessment; therefore, some
landuse categories contribute uncertainties to the model due to inadequate descrip-
tion of the landuse types. For example, the undeveloped landuse varies greatly from
forested land to open grasslands; this leads to potential variation in the habitat data
input into the model. As mentioned earlier, there are uncertainties regarding the
exposure pathways. For example, due to the increased use of retention ponds in
recent years and insufficient data regarding pond location and efficiency, the com-
pleteness of exposure pathways between increased runoff and the commercial and
industrial landuses is not clear. There are also uncertainties regarding the effects of
seasonal patterns due to insufficient temporal data. The process of calculating risk
estimates in the risk analysis phase also introduces uncertainties to the risk predic-
tions due to model variance and possible model bias.
Sensitivity Analysis Methodology
Most of the uncertainties mentioned above are quantifiable, and we quantified
them by performing a sensitivity analysis. In this study, we included six sensitivity
analyses. They are categorized into four types of analysis: geographical, single
component, exposure pathway, and random component. We first describe the meth-
odology we used for each of the sensitivity analyses and then list the results and the
significance of these sensitivity analyses. The purpose of the geographical analysis is
to test the sensitivity of the model to upstream–downstream effects. We assumed a
range of different percentages of risk from upstream regions to enter into the
downstream regions to determine how this added risk would change the relative risk
in the entire study area. We added 5 to 100% of the upstream regions’ risks to the
downstream regions at a 5% interval. For example, assuming that 10% of the risks
from upstream regions would add to the risks in the downstream regions, then the
total risk score for region 1 would equal region 1’s risk score plus 10% of region
3’s risk score plus 10% of region 2’s risk score, where the total risk score for region
3 would equal region 3’s risk score plus 10% of region 2’s risk score plus 10% of
region 6’s risk score.
There are two separate analyses in the single-component analysis. In each of
these analyses, a single risk component was altered in the RRM, and the risk results
were compared to the original RRM result. The two risk components were coldwater
habitat and terrestrial habitat. The single-component analysis removes the coldwater
habitat from the RRM and the undeveloped landuse from the terrestrial habitat data
to assess the sensitivity of the model to these habitats.
The exposure pathway analysis consists of two separate analyses. In both anal-
yses, one or more exposure pathways were altered, and the risk results were com-
pared to the original RRM result. The exposure pathway analysis removes the
exposure pathways between increased runoff and the commercial and industrial
landuses to assess the sensitivity of the RRM to these pathway uncertainties. The
L1655_C10.fm Page 212 Friday, October 1, 2004 10:35 AM
© 2005 by CRC Press LLC
USING THE RELATIVE RISK MODEL 213
exposure pathway analysis also tested the model sensitivity to other exposure path-
ways by assuming all pathways to be complete.
The random component analysis randomized the possible ranges of stressor
sources, habitats, and abiotic endpoint locations in 20 simulations to evaluate model
bias. The possible ranges are defined by +/– 10% of the value of the risk components
from the risk criterion breakpoint. For example, if the percentage of terrestrial habitat
in region 5 is 14.74%, which is within 10% of the low and the medium risk criterion
in region 5 would equal 2 and 4. The random component analysis results allow us
to determine the model sensitivity. The sensitivity of the model involves two things:
(1) ability of the model to differentiate the relative risks – high, medium, and low
risk for the risk regions, and (2) ability of the model to generate nonbiased data,
while the output data would correlate with the input data. For example, could the
model produce random output data with random data input and discriminate high-
risk regions when risk-related data are used?
The possible conditions of the risk regions are determined using similar methodol-
ogy as in the random component analysis. Instead of randomizing the risk components
within their possible ranges, the highest and the lowest possible risk combination of
the risk components is used to represent the possible conditions of the regions.
Sensitivity Analysis Results
The geographical analysis indicated that the risk model is not sensitive to
upstream–downstream effect below 20%. If 20% or more risk of the upstream regions
was added to that of the downstream regions, risk region 2 would change from a
high risk to a medium risk, while risks in all other regions remained the same. The
single-component analysis shows that the alteration of a single component, the
coldwater habitat and the terrestrial habitat, did not change the risk results of the
regions. This indicates that variation of a single component is not likely to change
the results of the risk regions; instead, the model is more sensitive to the combined
effects from variations of multiple components. Both exposure pathway analyses
indicated that pathway alteration does not change the risk results of the regions,
showing that the model is less sensitive to the filters than to the other risk compo-
nents. The random component analysis results did not show a risk pattern; random-
ized values in the model produced randomized results within the possible range
ditions of the possible risk regions are also shown in Figure 10.5. Taking conditions
of the possible risk regions into account, there is still a clear risk trend. This is due
to the fact that the possible risk range is limited by the data input into the RRM.
Results indicated that region 3 has the greatest potential for variations, and regions
5 and 6 have the least potential. It also indicated that the RRM results for all regions
except region 1 might be underestimated. Using Jenk’s Optimization to rank all the
possible combinations of the highest and lowest possible risk ranks reveals that
region 2 can potentially change from a high risk to a medium risk. This result is
consistent with the geographical analysis result. The Jenk’s Optimization results also
L1655_C10.fm Page 213 Friday, October 1, 2004 10:35 AM
© 2005 by CRC Press LLC
(Figure 10.5). This indicates that the model does not produce biased results. Con-
breakpoint (Table 10.2), then the possible range of risk score for the terrestrial habitat
214 REGIONAL SCALE ECOLOGICAL RISK ASSESSMENT
indicated that region 3 can potentially change from a medium risk to a high risk.
Taking all the possible variations into consideration, risks in regions 1, 2, and 3 are
consistently higher than regions 4, 5, and 6. In conclusion, the sensitivity results
demonstrate the ability of RRM to differentiate the relative risks for the risk regions
without producing biased results. The sensitivity results also show that the RRM is
most sensitive to the input data.
DISCUSSION
In recent years, the level of concern for the Squalicum Creek watershed has
elevated due to the increased adverse impacts of anthropogenic activities on the
watershed. Various organizations have conducted studies in an attempt to assess the
effects of these activities to the Squalicum Creek watershed. Although these studies
can detect some of the adverse effects, most of these studies are only descriptions
of the existing conditions, and they do not explain the relationship between these
conditions and their sources. This assessment fills this information gap by integrating
the effects of multiple individual decisions on a regional-scale ecosystem. It dem-
onstrates our ability to determine the relative contributions of risks of adverse
impacts of multiple (biological, chemical, and physical) stressors on the Squalicum
Creek watershed and shows the suitability of the application of the RRM to the
watershed management process. This assessment also demonstrates the applicability
of the RRM to a relatively small-scale ecological system and illustrates its potential
in assessing risks in similar ecosystems.
Application of the Relative Risk Model
The application of the RRM to the Squalicum Creek watershed was successful;
only a few modifications to the model were necessary. As in the original RRM,
stakeholders were involved in the Squalicum Creek watershed risk assessment pro-
cess, and assessment endpoints were defined according to their values. The original
RRM methodology for defining risk regions was successfully applied to this study.
A conceptual model was developed and used as a basis for the risk calculations, and
the basic RRM ranking concept was followed in this assessment. Sources and
habitats were identified and ranked, and filters were incorporated into the risk
calculations to determine the final risks for endpoints and risk regions.
The terminology in this study differs slightly from the original RRM. An addi-
tional risk component, the groups of stressors, was added to this risk assessment;
this new risk component is equivalent to the sources in the original RRM. This
change was made because there were insufficient stressor data for the Squalicum
Creek watershed. As a result, landuse data were used to replace the stressors data.
Another change made to the model was the addition of filters. To accommodate the
addition of the abiotic endpoints and the extra risk component, the stressor groups,
the original exposure and effect filters were split into five separate filters: the sources
of stressors filter, the biotic stressor filter, the abiotic stressor filter, the biotic effect
L1655_C10.fm Page 214 Friday, October 1, 2004 10:35 AM
© 2005 by CRC Press LLC
USING THE RELATIVE RISK MODEL 215
filter, and the abiotic effect filter. The habitat filter was also added to account for
the effects of the physical stressors on the exposure to migratory species. The
addition of the risk component, possible endpoint locations, was also necessary to
address the geographical information of the abiotic endpoints. The abiotic filter rank
numbers also differ from the original RRM so the abiotic endpoint risk ranks are
comparable to the biotic endpoint risk ranks. The ranking method differs slightly
from the original RRM; instead of breaking the stressors and habitats categories into
equal divisions, this model divided them using natural breaks. In summary, most
changes to the original RRM were due to the addition of the abiotic endpoints and
the lack of stressors information for the Squalicum Creek watershed.
Risk Management
In all cases, the results from this assessment show that the risk to the watershed
can be minimized by lowering the number
of stressors and isolating the habitats
from these stressors instead of just increasing habitats in these regions. Increasing
habitats in these regions without reducing the amount of stressors would only lead
to greater risks in these habitats, because exposure would be increased. As in any
other regional-scale assessment, there is a large degree of uncertainty associated
with this study. However, this should not discourage risk managers from utilizing
this assessment. We acknowledged the high degree of uncertainties associated with
this risk assessment and, therefore, only broad risk categories: high, medium, low,
and no risk were concluded from this study. Uncertainty for the risk assessment can
be greatly reduced if additional stressors, habitats, and exposure pathways data are
available, especially in regions 3, 5, and 6. Management decisions within the Squal-
icum Creek watershed are currently made on a case-by-case basis that only addresses
the ecological effects of individual parcel development. These assessments ignore
any effects resulting from the interactions between sources and receptors from
different parcels. Various uncertainties are associated with these decisions due to
the potential of combined effects of sources from separate parcels. This assessment
can integrate the effects of multiple individual decisions and, therefore, risk managers
can make decisions that would minimize the adverse impacts to the watershed. It
also allows the risk managers to prioritize the importance to the watershed of the
parcels according to their rankings. This is particularly important for the Squalicum
Creek watershed because of its unique position in which the port, the city, and the
county all have jurisdiction over the area. The rankings can enable these authorities
to have a common set of priorities for the parcels and, therefore, make decisions
that would minimize the adverse impacts to the watershed.
This assessment also serves as a framework to organize the existing data and
point out where data are lacking. The uncertainty analysis can help the risk managers
identify areas of research that could minimize the most model uncertainties. Another
benefit of the assessment to the management process is that it enables the stakehold-
ers to estimate the effects of different management options to the watershed. The
RRM was designed in a format that is easy to use and understand, so stakeholders can
utilize the results of the model to conduct cost–benefit analyses. With acknowledgment
L1655_C10.fm Page 215 Friday, October 1, 2004 10:35 AM
© 2005 by CRC Press LLC
216 REGIONAL SCALE ECOLOGICAL RISK ASSESSMENT
of uncertainties and suggestions for future improvements, this assessment can pro-
vide risk managers with a comprehensive tool to aid in future decisions in the
Squalicum Creek watershed.
CONCLUSION
The application of the RRM to the Squalicum Creek watershed risk assessment
was successful. A few modifications to the model were made due to the addition of
risk components. The sensitivity analysis results demonstrate that the model pro-
duces nonbiased results. We also found that the model is more sensitive to combined
effects from variation of multiple components and that the model is less sensitive
to variations to filters. The risk assessment results indicate that residential landuse
contributed most risk to the watershed. The results also show that the coldwater
habitat and wetland endpoint are most at risk in the study area. The salmonids
endpoint was found to be at relatively low risk because of the limited access to
habitats due to physical barriers. We also found that there is a strong risk gradient
in the study area in which risk increases from upstream regions to downstream
regions. The risk assessment shows that lowering the number of stressors and
isolating the habitats can reduce more risk than increasing the number of habitats.
Uncertainties for this study mostly come from the lack of data regarding the sources
and habitats, especially in regions 3, 5, and 6. Despite all the uncertainties for this
study, risk assessment can have application to the management of the Squalicum
Creek watershed. By acknowledging the uncertainties for this risk assessment, the
authorities in the watershed can better understand where and what data are needed
most in the watershed. The authorities can also use the risk assessment result to set
a common priority for the parcels. This can enable them to utilize the best existing
data to make decisions that would minimize the adverse impacts to the watershed.
PART II: RISK PREDICTION TO MANAGEMENT OPTIONS
IN THE SQUALICUM CREEK WATERSHED USING THE RELATIVE
RISK MODEL ECOLOGICAL RISK ASSESSMENT
Introduction
Management of regional-scale ecosystems is challenging to many risk managers
due to the limitations in current resource management methodologies. The objective
of most resource managers is to identify the management option that would produce
results closest to the management goal. Resource managers need to define the
management goal, determine the current state of the ecosystem, and predict the
future conditions of the system and the effects of management decisions on the
system.
One of the difficulties in resource management is defining the management goal.
Many attempts by risk managers are unsuccessful due to the use of vague terms
such as “ecological health,” “ecological integrity,” and “recovery.” These terms have
L1655_C10.fm Page 216 Friday, October 1, 2004 10:35 AM
© 2005 by CRC Press LLC
USING THE RELATIVE RISK MODEL 217
many definitions and, therefore, managers do not have a uniform perception of them.
Application of these terms to the management process is also difficult because they
are not parameters that can be measured directly (Landis and McLaughlin 2000a,
2000b). All of these terms require the use of surrogate variables that might lead to
uncertainties. For example, the use of a single species or biological index number
to indicate an ecosystem is insufficient because these parameters oversimplify the
complexity of the system (Landis and McLaughlin 2000a).The definitions of these
vague terms could also lead to impractical goals. For example, many managers define
their management goal as recovery to a preexisting condition prior to human impact,
or recovery to a condition of a reference site. These are often unachievable goals
because ecosystems inherit ecological effects from the past (Landis et al. 1993a
;
1993b
)
and, therefore, returning to those conditions might not be possible. Also,
reference sites as strictly defined do not exist since no two sites are identical.
Recovery to the condition of a reference site is irrational because the two sites were
not the same and never will be the same due to inherent differences.
Another difficulty in resource management is the limited predictability of man-
agement methods to future conditions. Most of the current management techniques
only allow the risk managers to describe the current ecosystem condition; very few
techniques allow for prediction of future ecosystem changes. One of the most
commonly used is adaptive management. It is a technique accepted by many risk
managers and involves experimenting with the response of the ecosystem to human
behavior changes in the systems (Lee 1999). Although the concept of adaptive
management is widely accepted, there are currently insufficient case studies to prove
the utility of this management method. Very few cases have utilized this method,
many of which have not obtained results due to the slow response of the ecosystems.
Other cases do not meet all the requirements of the management method. One of
the drawbacks of adaptive management is that it is often costly and time consuming
because a large amount of data is needed to test each hypothesis. The methodology
does not allow the managers to compare the effects of the decision to those of
alternative decision options. The methodology is also difficult to apply to regional-
scale ecosystems due to system dynamics (Lee 1999).
Table 10.8 Percentage Risk Change for Each Endpoint in Each Risk Region for Decision
Option 1 (numbers represent percentages and negative numbers indicate
reduced risk to endpoint)
Risk
Region
Nonmigratory
Cold-
Water Fish
Life Cycle
Opportunities
for Salmonids
Flood
Control
Wildlife
Species
Recreational
Uses Wetland
10 0 000 0
20 0 000 0
3 –8.6 82.8 –12.0 –4.3 –10.2 –6.9
4 –9.2 81.5 0 –6.1 –10.9 –7.6
50 0 000 0
60 * 00 0 0
* Changed from no risk to approximately the risk of the current condition of the salmonids in
region 4.
L1655_C10.fm Page 217 Friday, October 1, 2004 10:35 AM
© 2005 by CRC Press LLC
218 REGIONAL SCALE ECOLOGICAL RISK ASSESSMENT
Subsequently, we have chosen an alternative approach to risk management, the
RRM. The RRM was successfully applied to a number of other risk assessments of
ecosystems with various scales, stressors, and endpoints (Landis and Wiegers 1997;
Obery and Landis 2002; Walker et al. 2001). The study conducted by Thomas et al.
(2001) further confirmed the utility of the RRM as a tool to analyze alternative
decisions. The RRM follows the management concept established by Landis and
McLaughlin (2000b) in which the management goal is defined by the movement of
endpoints in relation to the stakeholders’ set limits over time. The RRM incorporates
stakeholders’ values and defines the management goal using measurable endpoints.
The model allows the risk managers to determine the current condition of the
endpoints, predict future conditions, and predict the effects of management decision
options on these endpoints. Unlike many other management techniques, the RRM
requires minimal cost and time because the model utilizes existing data. It also
requires relatively few data to confirm the model results. The model can be applied
to various-scale ecosystems, and it can incorporate the effects of multiple (biological,
chemical, and physical) stressors to multiple endpoints. The model is also set up in
a way that is easy to use and understand by the managers, and the model is very
flexible so it can be modified easily in response to changes in model variables.
The objective of this study was to test the utility of the RRM as a tool for
analyzing decision options. Among the studies that used the RRM method, we chose
to analyze the Squalicum Creek watershed RRM because the watershed is developing
rapidly and the level of concern has increased considerately in recent years. The
Squalicum Creek watershed is also the smallest ecosystem that has been analyzed
using the RRM. This watershed serves as a good example for a typical urbanized
watershed in the Pacific Northwest, and can demonstrate the potential of the appli-
cation of the RRM to similar ecosystems in the area. In this study, we first developed
a list of possible decision options for the Squalicum Creek watershed. We then
determined the relative risks to the watershed due to various decision options. Last,
we compared these risk predictions to the risk results of the current Squalicum Creek
watershed as determined in Part I of this project.
METHODS
The methodology of using the RRM to predict the impact of decision options
to an ecosystem varies slightly for individual ecosystems due to differences in the
RRM. In all cases, the researchers need to:
• Conduct studies to include an EcoRA for the study area using the RRM to
determine the current condition of the area
• Define a list of decision options
• Recalculate the input data such as habitat and sources of stressors data according
to the decision options
• Rerank the new input data from step 3 using the ranking criteria in the RRM in step 1
• Alter the exposure pathways in the model according to the decision options and
enter the subsequent data from step 4 into the model to generate risk scores
L1655_C10.fm Page 218 Friday, October 1, 2004 10:35 AM
© 2005 by CRC Press LLC
USING THE RELATIVE RISK MODEL 219
• Calculate the change in risk scores from step 1 results to step 5 results
• Analyze and compare the results from step 6 for different decision options
RISK ASSESSMENT
Step 1 is included in Part I of this project.
LIST OF DECISION OPTIONS
We selected the following six decision options based on proposed action in the
study area and stakeholders’ values. These six options are not real decision options
that the resource managers are currently undertaking; instead, they are potential
decision options that are likely to be achievable based on the current condition and
developmental trends in the Squalicum Creek watershed.
Option 1: Convert the Impassable Culverts to Passable Culverts
The stakeholders have expressed their concern about the impact of impassable
culverts on migratory aquatic species such as the salmonids. Many stakeholders have
a misconception that the removal of impassable culverts would decrease risks to species
affected by these culverts. We included this decision option to help the stakeholders
better understand and predict the possible risk changes resulting from this option.
Option 2: Increase 25 and 50%, Respectively, of Forested Area
in Agricultural Land Riparian Corridor
Since October 1998, the Conservation Reserve Enhancement Program (CREP)
has become available to landowners in Whatcom County. The intention of the
program is to help restore the riparian buffers along salmon- and steelhead-support-
ing streams to help improve the habitats of these species. It is a voluntary program
in which landowners of agricultural land that meets specific requirements are qual-
ified to participate in the program. Some of these requirements include cropping
history, stream designations, and riparian buffer width in the property. Program
participants are required to stop any agricultural activities in the designated CREP
area on their property for a period of 10 to 15 years. They are also required to plant
and maintain native vegetations in those designated areas. In return, the Farm
Services Agency and the Conservation Commission pay the program participants
an annual rent for their property and also cover the other expenses needed for the
habitat restoration process. Since CREP became available in Whatcom County,
various landowners have signed up for the program. With the growing concern for
the salmon habitats in the county, we assumed there would be a continuous growth
in the number of CREP participants in the Squalicum Creek watershed. In this
decision option, we assumed a 25 to 50% CREP participation for all the agricultural
landowners who are within the Squalicum Creek watershed, including sections of
the 60.96-m riparian buffer. This leads to a 25 to 50% increase of forested area in
L1655_C10.fm Page 219 Friday, October 1, 2004 10:35 AM
© 2005 by CRC Press LLC