Regional Scale Ecological Risk Assessment - Chapter 12 pot
Bạn đang xem bản rút gọn của tài liệu. Xem và tải ngay bản đầy đủ của tài liệu tại đây (794.46 KB, 12 trang )
245
C
HAPTER
12
Retrospective Regional Risk Assessment
Predictions and the Application of a Monte
Carlo Analysis for the Decline of the
Cherry Point Herring Stock
Wayne G. Landis, Emily Hart Hayes, and April M. Markiewicz
CONTENTS
Introduction 245
Retrospective RRM and WoE Synthesis 246
Weight of Evidence 247
Relative Risk Model and the WoE Approach 247
Source–Habitat–Impact 247
Use of Ranks and Filters to Quantify Relative Risk 247
Spatially Explicit 248
Use in a Prospective and Retrospective Approach 248
Common Ranking Methodology 248
Retrospective WoE Analysis for Cherry Point Pacific Herring 248
Conclusions and Recommendations 255
Acknowledgments 255
References 255
INTRODUCTION
The history of the Pacific herring stock at Cherry Point, Washington and a series
et al. 2004
)
conducted a regional ecological risk assessment using the relative risk
model (RRM) to investigate the causes of the current decline, current risks to the
L1655_book.fm Page 245 Wednesday, September 22, 2004 10:18 AM
© 2005 by CRC Press LLC
of alternative hypotheses for its decline were presented in Chapter 11. We (Landis
246 REGIONAL SCALE ECOLOGICAL RISK ASSESSMENT
population, and the outcomes of future management options. The population decline
of the herring corresponds to a collapse of the age structure, although survivorship
of eggs to the age 2 class has not diminished. The range of spawning areas has also
declined, with the area of Point Whitehorn as the principal location.
The retrospective risk assessment identified climate change, as expressed by the
warmer sea surface temperatures associated with a warm Pacific decadal oscillation
(PDO) and exploitation as important risk factors. The warmer water also changes
patterns in food resources, predators, and water quality. Contaminants have the
potential for impact, but exposure to the eggs, hatchlings, and fry has not been
demonstrated at Cherry Point (CP). Exposure of adults to contaminants during
migration may occur and has been included into our assessment. Modeling of the
population age vs. fecundity curves and survivorship data indicate that the current
population of ages 2 and 3 fish cannot be self-sustaining without the survivorship
or immigration of age 4 and older fish.
Because of the limitations on the available data for a large number of the stressors
and the stressor–habitat–impact relationship, there is a great deal of uncertainty
associated with this assessment. Data at a comparable regional scale to that for the
PDO are not available for contaminants, fishing pressure, disease, and other potential
causative agents. This leads to a great deal of uncertainty. As we began to analyze
this uncertainty by applying Monte Carlo techniques it readily became apparent that
the retrospective RRM–Monte Carlo synthesis is essentially a quantitative weight-
of-evidence (WoE) approach.
The approach described below combines WoE and causality criteria with a multitude
of stressors at a regional scale. The difficulties include how to deal with differences in
the magnitude of effects and how to express the uncertainty as distributions.
We applied a WoE and path analysis approach based upon our RRM in order to
estimate the cause of the decline of the CP Pacific herring. This WoE approach is
based upon a risk assessment type conceptual model in order to link the paths of
potential sources of stressors to the effects seen in the population. Ranking criteria
and regressions are used to assign weights to the potential sources and stressors. A
Monte Carlo analysis is applied to represent the uncertainty in each of the ranks,
correlations, and filters and to estimate the uncertainty of the analysis. This technique
results in a series of multinomial distributions representing the likelihood of a stressor
causing an impact. In the case of the CP herring, climate change, habitat alteration,
and contamination at a landscape scale were identified as important stressors. This
case study demonstrates that a clearly derived and quantified WoE and path analysis
approach is useful to investigating casual links at regional scales.
RETROSPECTIVE RRM AND WOE SYNTHESIS
The difficulty with the retrospective analysis is that it is very difficult to quantify
the uncertainty with this type of procedure. In order to better describe the uncertainty
with the assignment of probable cause it is important to investigate other methods.
The WoE approach as outlined by Menzie et al. (1996) is a promising approach.
L1655_book.fm Page 246 Wednesday, September 22, 2004 10:18 AM
© 2005 by CRC Press LLC
RETROSPECTIVE REGIONAL RISK ASSESSMENT PREDICTIONS 247
Weight of Evidence
Classic methodologies such as Hume’s criteria and Koch’s postulates do not
work well for open systems with diverse symptoms. The open system and the large
scale associated with sites such as Cherry Point preclude experimentation. Large-
scale factors such as the PDO are not possible to manipulate and must be incorpo-
rated into any causal framework. Ecoepidemiological approaches such as those of
Suter et al. (2002) are not inherently quantitative, but rely or scoring schemes that
are not easily manipulated mathematically and that do not incorporate uncertainty.
The quantification of the scoring scheme and the express statement of uncertainty
are both important factors in a useful means of assigning causality.
A retrospective assessment coupled with a modern idea of scale, WoE approach
and uncertainty analysis can produce a quantitative framework for ranking risk
factors. The next paragraphs describe how the RRM was modified for a retrospective
assessment incorporating Monte Carlo analysis to describe uncertainty.
RELATIVE RISK MODEL AND THE WOE APPROACH
The RRM was developed during our ecological risk assessment of Port Valdez,
Alaska. Like this study area, Port Valdez has a variety of anthropogenic stressors
including fish hatcheries, fish processing wastes, petroleum-based effluents from the
pipelines, municipal effluents, and tanker traffic (Landis and Wiegers 1997; Wiegers
et al. 1998). The variety of stressors and endpoints led Wiegers and colleagues to
the source–habitat–impact model for conceptual model development. This approach
SOURCE–HABITAT–IMPACT
In a regional multiple-stressor assessment, the number of possible interactions
increases exponentially. Stressors arise from diverse sources, receptors are associated
with a variety of habitats, and one impact may lead to additional direct and indirect
effects. The approach of our current regional assessment model is to identify the
sources and habitats in different locations (risk regions) of the Cherry Point coastal
system, rank their importance in each location, and combine this information to
predict relative levels of risk. The number of possible risk combinations resulting
from this approach depends on the number of groups identified in each risk region.
For example, if two source types and two habitat types are identified, then four
possible combinations of these components can lead to an impact. If we are con-
cerned about two different impacts, eight possible combinations exist.
Use of Ranks and Filters to Quantify Relative Risk
Our regional approach incorporates a system of numerical ranks and weighting
factors to address the difficulties encountered when attempting to combine different
L1655_book.fm Page 247 Wednesday, September 22, 2004 10:18 AM
© 2005 by CRC Press LLC
is as described in Chapter 2 and is briefly summarized in the following paragraphs.
248 REGIONAL SCALE ECOLOGICAL RISK ASSESSMENT
kinds of risks. Ranks and weighting factors are unitless measures that operate under
different limitations than measurements with units (e.g., mg/L, individuals/cm
2
). We
link these
ranks to specific
locations within a landscape, providing a map of risks
with the sources of risk clearly identified.
Spatially Explicit
Sources and habitats are specifically included in the risk assessment, making it
spatially explicit. Risks can be defined for specific areas, within the context of the
entire region. Gradients of risk may exist due to the presence of a variety of stressors
generated by a variety of sources. The relative risks can be mapped and decisions
made at a regional level.
Use in a Prospective and Retrospective Approach
Previously published studies include examples of prospective risk assessments
where future impacts are calculated. In a retrospective risk assessment the goal is
to identify stressors and the sources that have contributed to an observed historical
impact in that environment. The process reverses the normal order of consideration
from source–habitat–impact to impact–habitat–source.
Common Ranking Methodology
The numerical scores that are obtained in the ranking process are unique to the
set of decisions and ranking criteria derived for that specific region. The numerical
scores cannot be compared directly to other studies or regions unless a set of newly
derived scoring procedures is derived. If several areas are being compared in order
to set remediation or management priorities, then each area needs to be combined
into a single RRM setting. This approach provides the setting for the analysis of the
cause of the decline of the Pacific herring stock at Cherry Point.
RETROSPECTIVE WOE ANALYSIS
FOR CHERRY POINT PACIFIC HERRING
The basic conceptual model for the CP Pacific herring has been adapted for this
sources providing the stressors linked to the observed impacts in the population. A
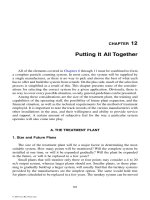
simplified model that deals only with the source climate change is presented in
The source of the change in temperature within the northeastern Pacific Ocean
is known as the PDO. Climate change is also a source of habitat alteration as species
migrate because of alterations in conditions. Predators may increase or decrease in
number, nutrient fluxes can be altered, and the distribution of prey items changed.
Disease may also be an important issue as new pathogens may be brought in by the
L1655_book.fm Page 248 Wednesday, September 22, 2004 10:18 AM
© 2005 by CRC Press LLC
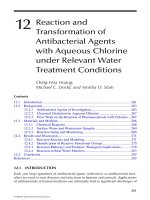
retrospective analysis (Figure 12.1). The conceptual model incorporates each of the
Figure 12.2.
RETROSPECTIVE REGIONAL RISK ASSESSMENT PREDICTIONS 249
change in conditions. In the simplified model there are a total of 13 interactions that
must be considered.
The next stage is that the evidence for each source, stressor, and potential linkage
is examined and provided a rank with a description of the associated uncertainty.
current example, all the ranks and descriptions are based upon Landis et al. (2004).
In the next step the available information is used to assign a distribution to each
rank depending upon the uncertainty associated with each factor.
Figure 12.1
Conceptual model for the WoE approach to determining the likely cause of the
stock decline at Cherry Point.
Sources
Fishing Fleets
Climate
Change
Industrial
Sites
Effluents
Nonpoint
Sources
from Landuse
Construction
Hatcheries
Invasive
Nonnative
Species
Exposure to
Contaminants
Outside of the
CP Area
Stressors
Exploitation
Temperature
(Pacific Decadel
Oscillation)
Contaminants
Habitat
Alteration
Hatchery
Fisheries
Disease
Observed
Impacts
Stock Decline
Change in Age
Structure
Alteration of
Reproductive
Success
Baseline Conceptual Model for the Cherry Point
Pacific Herring
Effects
L1655_book.fm Page 249 Wednesday, September 22, 2004 10:18 AM
© 2005 by CRC Press LLC
Table 12.1 provides examples of such a process with three example sources. In the
250 REGIONAL SCALE ECOLOGICAL RISK ASSESSMENT
After the assigning of distributions, a Monte Carlo analysis is performed using
Crystal Ball
2000 software as a macro in Microsoft® Excel 2002. The Monte
Carlo simulations were run for 1000 iterations, and output distributions for each
subregion, source, habitat, and endpoint risk prediction were derived. The distribu-
tions depict a range of probable risk estimates associated with each point estimate.
After running preliminary simulations of up to 10,000 iterations, 1000 iterations
appeared sufficient and resulted in similar results. This procedure allows us to
estimate the resultant uncertainty in the retrospective analysis.
three variables. In the case of fishing fleets as a source, there is a great deal of
documentation that fishing of Pacific herring
,
both at large scales and upon the
spawning fish, has occurred. The uncertainty is in the fact that it is not clear what
amount of offshore fishing has directly affected the Cherry Point Pacific herring and
how much has been on stocks that are not related. In this case a rank of 6 is the
Figure 12.2
Simplified conceptual model identifying the links due to climate change and
invasive nonnative species as the source of the stressors.
Climate
Change
Sources
Invasive
Nonnative
Species
Stressors
Temperature
(Pacific Decadel
Oscillation)
Habitat
Alteration
Disease
Observed
Impacts
Stock Decline
Change in Age
Structure
Alteration of
Reproductive
Success
Baseline Conceptual Model for the Cherry Point
Pacific Herring
Effects
L1655_book.fm Page 250 Wednesday, September 22, 2004 10:18 AM
© 2005 by CRC Press LLC
Figure 12.3 illustrates the distribution selected to represent the uncertainty for
RETROSPECTIVE REGIONAL RISK ASSESSMENT PREDICTIONS 251
preferred input, with a probability of 0.80, but a rank of 4 is also given a set
probability (0.20).
An intermediate case is effluents. Effluents are common throughout the Georgia
Straits and Puget Sound region, but toxicity is not generally high and rapid dilution
occurs because of the magnitude of the currents in the region. However, local high
concentrations from industrial sources or untreated stormwater runoff could be
damaging. In this instance the most common rank is a 4, with ranks of 2 and 6 given
a lower probability.
Invasive species provide a case with a low rank. Although invasive species do
exist in the broad geographic region, they are not particularly prevalent in the habitat
used by Pacific herring. However, lack of evidence may also be because there has
not been an extensive survey with the region for these types of organisms. So, the
initial ranking and the rank given the source are a 2, but a rank of 0 and a rank of
4 are given equal probabilities.
Table 12.1
Examples of Source Ranks, Notes, and Uncertainty Description
Source Rank
Notes on
Initial Ranking
Uncertainty
Description Uncertainty
Fishing fleets
and
nearshore
fisheries
6 Fishing fleets are well
documented within
U.S. waters until the
1980s and currently
exist in Canadian
waters.
It is clear that CP Pacific
herring have been
fished in the past, but
no fishing is currently
allowed in Washington
waters. Take in
Canadian waters is
possible, and Pacific
herring from Puget
Sound have been
recovered in Canadian
waters.
Low
Nonpoint
sources from
landuse
2 Nonpoint sources do
occur but much of the
land is forested or
otherwise covered.
Areas in the Point
Whitehorn region
have become
residential.
Nonpoint sources are
more difficult to map
and uncertainty exists
in the landuse
classifications for the
CP region.
Moderate
Exposure to
contaminants
outside of the
CP area
4 Contaminants outside
of the Cherry Point
region are known to
exist from numerous
examinations of heron
eggs, marine
mammal blubber, and
fish. Many of the
compounds are
legacy pollutants such
as derivatives of DDT,
PCBs, and members
of the dioxin and furan
classes
High uncertainty
because CP Pacific
herring and other fish
species in the area
have not been sampled
before coming to the
CP area. Many
potentially toxic
materials have not
been analyzed,
especially the
halogenated organics
or other estrogen
disruptors.
High
L1655_book.fm Page 251 Wednesday, September 22, 2004 10:18 AM
© 2005 by CRC Press LLC
252 REGIONAL SCALE ECOLOGICAL RISK ASSESSMENT
The linkages (filters) between the source–habitat–impact pathways are also
assigned a probability. A value of 1.0 means that such exposure or a causal pathway
exists. A value of 0.0 means that no exposure or mechanism of impact exists for
that group of relationships. An intermediate case 0.5 can be assigned with a prob-
ability distribution if it is not clear if a particular pair of interactions is linked.
When possible the causal criteria as described by Adams (2003
)
were used to
these criteria over the scales relevant to the biology and life history of the Pacific
herring in an environment such as the Straits of Georgia with large-scale spatial and
temporal relationships. Because it is not clear what the migration paths of the Cherry
Point herring are, nor the genetic relationships to other stocks, or even how the
current stock is representative of that of the early 1970s, there is a lot of room for
uncertainty.
After the ranks are assigned for each source and stressor and the linkages are
assigned an uncertainty, then the Monte Carlo computation is performed. The output
In these figures the calculated value for the retrospective assessment is marked
Figure 12.3
Example of how distributions are established for the various ranks in the
conceptual model
Source
Ranks
Fishing Fleets
and Nearshore
Fisheries
6
Climate Change 6
Industrial Sites
2
Effluents 4
Nonpoint
Sources from
Landuse
2
Construction
2
Hatcheries 2
Invasive Non-
native Species
2
Exposure to
Contaminants
Outside of the
Cherry Point Area
4
Effluents
Invasive Nonnative Species
Distributions
Fishing Fleets and Nearshore Fisheries
L1655_book.fm Page 252 Wednesday, September 22, 2004 10:18 AM
© 2005 by CRC Press LLC
evaluate the values of the filters (Table 12.2). Unfortunately, it is difficult to meet
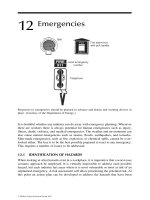
is a distribution as portrayed in Figure 12.4.
as a solid line. In Figure 12.4a it can be seen that the distribution is generally below
RETROSPECTIVE REGIONAL RISK ASSESSMENT PREDICTIONS 253
Table 12.2
Criteria for Causality
Causal Criteria Description
1. Strength of association Cause and effect coincide.
2. Consistency of association The association between a particular stressor or stressors and
an effect has been observed by other investigators in similar
studies and at other times and places.
3. Specificity of association The effect is diagnostic of exposure.
4. Time order or temporality The cause precedes the effect in time, and also the effect
decreases when the cause is decreased or removed.
5. Biological gradient There is a dose–response relationship either spatially or
temporally within the system. The risk of an effect is a function
of magnitude of exposure.
6. Experimental evidence Valid experimental studies support the proposed cause–effect
relationship.
7. Biological plausibility There is credible or reasonable biological or toxicological basis
for the proposed mechanism linking the proposed cause and
effect.
Source:
Data from Adams, S.M.,
Hum. Ecol. Risk Assess.,
9, 17–35, 2003.
Figure 12.4
Distributions for the forecast of two of the observed effects, alteration of repro-
ductive success, and change in age structure
ProbabilityProbability
.029 29
30
15
7.5
0
.022
.030
.023
.015
.008
.000
.015
.007
.000 0
Frequency
Frequency
21.57
22.5
14.5
7.25
200.00 287.00 375.00 462.50 550.00
Forecast: Alteration of Reprod. Success
Frequency Chart
Forecast: Change in Age Structure
Frequency Chart
50.00 118.75 187.50 256.25 325.00
(a)
(b)
L1655_book.fm Page 253 Wednesday, September 22, 2004 10:18 AM
© 2005 by CRC Press LLC
254 REGIONAL SCALE ECOLOGICAL RISK ASSESSMENT
the original estimate, indicating that the original may have been an overestimate of
age structure to the distribution, and the original seems to be an underestimate of
the degree of risk involved. Note that the risk scores for decline of the population
are higher than those of age structure. This is because a change in age structure is
one of the factors incorporated into the overall population decline.
One of the advantages of the WoE approach using Monte Carlo is that the process
allows the examination of what factors within the model drive the final distribution
of results. An improvement in the uncertainty associated with these factors should
reduce the overall uncertainty of the estimates.
Figure 12.5
The sensitivity analysis points to the importance of better understanding the
causal relationships connecting contamination and climate change to a change
in the occurrence of disease and a change in the age structure of the popu-
lation.
L1655_book.fm Page 254 Wednesday, September 22, 2004 10:18 AM
© 2005 by CRC Press LLC
the true risk. Figure 12.4b compares the original estimate for risk to the change in
RETROSPECTIVE REGIONAL RISK ASSESSMENT PREDICTIONS 255
habitat loss and change in vegetation lead the sensitivity scores. Both factors have
high ranks, but also have a great deal of associated uncertainty. Note that climate
change received a relatively low sensitivity score although it has a high rank. This
is because there is little doubt that the PDO occurs and can have important effects
so that the input distribution was very narrow. Input factors with low uncertainty
are essentially constants and are not a cause of variability in the output.
In the chart ranking sensitivity for the change in age structure, two of the linkages
between stressors and effects, P7 and P6, have a high sensitivity. This sensitivity is
because many of the mechanisms tying the impacts of contaminants to alterations
in age structure are unclear. These linkages were given equal probability of tying a
stressor to an effect and have a resultant high sensitivity score.
CONCLUSIONS AND RECOMMENDATIONS
The WoE approach coupled with a Monte Carlo analysis of the uncertainty
proved useful and led to a series of conclusions:
• The declines observed at Cherry Point and the age structure common to Puget
Sound stocks are due to large-scale events, such as habitat loss and the PDO.
• Contaminants are possibly an important stressor, but there is considerable uncer-
tainty in the linkage of toxicity to changes in age structure and population decline
at large scales.
•A WoE approach can incorporate a variety of stressors and pathways and is based
upon the diagnostic symptoms observed in the spawning stocks.
• It is possible to incorporate uncertainty in the rankings and linkages into the
description of the WoE estimate.
• The WoE combined with the uncertainty analysis approach is flexible, and new
stressors and linkages can be easily added or subtracted as evidence is accumu-
lated.
ACKNOWLEDGMENTS
The research was funded by the Washington State Department of Natural
Resources.
REFERENCES
Adams, S.M. 2003. Establishing causality between environmental stressors and effects on
aquatic systems,
Hum. Ecol. Risk Assess
., 9, 17–35.
Landis, W.G. and McLaughlin, J.F. 2000. Design criteria and derivation of indicators for
ecological position, direction and risk,
Environ. Toxicol. Chem
., 19, 1059–1065.
Landis, W.G. and Wiegers, J.A. 1997. Design considerations and a suggested approach for
regional and comparative ecological risk assessment,
Hum. Ecol. Risk Assess
,
3,
287–297.
L1655_book.fm Page 255 Wednesday, September 22, 2004 10:18 AM
© 2005 by CRC Press LLC
Two examples are found in Figure 12.5. In the sensitivity chart for stock decline,
256 REGIONAL SCALE ECOLOGICAL RISK ASSESSMENT
Landis, W.G., Duncan, P.B., Hart Hayes, E., Markiewicz, A.J., and Thomas, J.F. 2004
.
A
regional assessment of the potential stressors causing the decline of the Cherry Point
Pacific herring run and alternative management endpoints for the Cherry Point
Reserve (Washington, USA).
Hum. Ecol. Risk Assess
., 10, 271–297.
Landis, W.G., Markiewicz, A.J., Thomas, J.F., and Hart Hayes, E. 2002. Regional risk assess-
ment predictions for the decline and future management of the Cherry Point herring
stock and region, Proceedings of the 2001 Puget Sound Research Conference.
Droscher, T., Ed., Puget Sound Water Quality Action Team, Olympia, Washington.
Menzie, C., Henning, M.H., Cura, J., Finkelstein, K., Gentile, J., Maughn, J., Mitchell, D.,
Petron, S., Potocki, B., Svirsky, S., and Tyler, P. 1996. A weight-of-evidence approach
for evaluating ecological risks: report of the Massachusetts Weight-of-Evidence Work
Group,
Hum. Ecol. Risk Assess.,
2(2), 277–304.
Suter, G., Jr., Norton, S., and Cormier, S. 2002. A methodology for inferring the causes of
observed impairments in aquatic ecosystems,
Environ. Toxicol. Chem.
, 21,
1101–1111.
Wiegers, J.K., Feder, H.M., Mortensen, L.S., Shaw, D.G., Wilson, V.J., and Landis, W.G.
1998. A regional multiple stressor rank-based ecological risk assessment for the fjord
of Port Valdez, AK,
Hum. Ecol. Risk Assess.,
4, 1125–1173.
L1655_book.fm Page 256 Wednesday, September 22, 2004 10:18 AM
© 2005 by CRC Press LLC
Available at: />