The Materials Science of Thin Films 2011 Part 2 ppsx
Bạn đang xem bản rút gọn của tài liệu. Xem và tải ngay bản đầy đủ của tài liệu tại đây (1.68 MB, 50 trang )
28
A
Review
of
Materials Science
WEIGHT PER CENT SILICON
Ge
ATOMIC PER GENT
SILICON
Si
Figure
1-1
2.
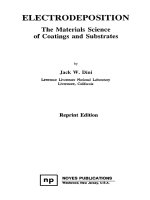
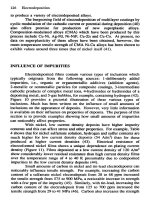
Ge-Si equilibrium phase diagram. (Reprinted
with
permission
from
M.
Hansen,
Constitution
of
Binary Alloys,
McGraw-Hill, Inc.
1958).
wise, these diagrams hold at atmospheric pressure, in which case the variance
is
reduced by
1.
The Gibbs phase rule now states
f
=
n
+
1
-
J/
or
f
=
3
-
II/.
Thus, at most three phases can coexist in equilibrium.
To learn how to interpret binary phase diagrams, let
us
first consider the
Ge-Si system shown in
Fig.
1-12.
Such a system is interesting because
of
the
possibility
of
creating semiconductors having properties intermediate
to
those
of
Ge and Si. On the horizontal axis, the overall composition is indicated. Pure
Ge and Si components are represented at the extreme
left
and right axes,
respectively, and compositions
of
initial mixtures
of
Ge and Si are located in
between. Such compositions are given in either weight or atomic percent. The
following set
of
rules will enable a complete equilibrium phase analysis
for
an
initial alloy composition
X,
heated to temperature
To.
1.
Draw a vertical line at composition
X,
.
Any point on this line represents a
state
of
this system at the temperature indicated on the left-hand scale.
2.
The
chemical
compositions
of
the resulting phases depend on whether the
point lies (a) in a one-phase field,
(b)
in a two-phase field, or (c) on a
sloping or horizontal (isothermal) boundary between phase fields.
a.
For
states within a single-phase field., i.e.,
L
(liquid),
S
(solid),
or
a
compound, the phase composition or chemical analysis is always the
same as the initial composition.
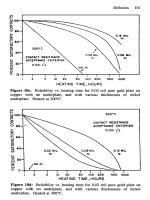
1.5.
Thermodynamics
of
Materials
29
b. In a two-phase region, i.e.,
L
+
S,
CY
+
0,
etc., a horizontal tie line is
first drawn through the state point extending from one end of the
two-phase field to the other as shown in Fig.
1-12.
On either side of the
two-phase field are the indicated single-phase fields
(L
and
S).
The
compositions of the two phases in question are given by projecting the
ends of the tie line vertically down and reading off the values. For
example, if
Xo
=
40
at% Si and
To
=
1200
"C,
X,
=
34
at% Si and
X,
=
67
at% Si.
c. State points located on either a sloping or a horizontal boundary cannot
be analyzed; phase analyses can only
be
made above or below the
boundary lines according to rules a and
b.
Sloping boundaries are known
as liquidus or solidus lines when
L/L
+
S
or
L
+
S/S
phase field
combinations are respectively involved. Such lines
also
represent solu-
bility limits and are, therefore, associated with the processes
of
solution
or rejection of phases (precipitation) from solution. The horizontal
isothermal boundaries indicate the existence
of
phase transformations
involving three phases. The following common reactions occur at these
critical isotherms, where
CY,
0
and
y
are solid phases:
1.
Eutectic:
L
+
Q!
+
0
2.
Eutectoid:
y
+
CY
+
/3
3.
Peritectic:
L
+
CY
+
y
3.
The relative amount of phases present depends on whether
the
state point
lies in (a) a one-phase field or
(b)
a two-phase field.
a. Here the one phase in question
is
homogeneous and present exclusively.
Therefore, the relative amount of this phase is
100%.
b. In the two-phase field the lever rule must
be
applied to obtain the
relative phase amounts. From Fig.
1-12,
state
Xo,
To, and
the
corre-
sponding tie line, the relative amounts of
L
and
S
phases are given by
x
100,
(1-19)
Xo
-X,
x
100;
%S
=
XS
-Xo
xs
-x,
xs
-x,
%L
=
where
%L
plus
%S
=
100.
(Substitution gives
%L
=
(67
-
40)/(67
-
34)
x
100
=
81.8,
and
%S
=
(40
-
34)/(67
-
34)
x
100
=
18.2.)
Equation
1-19
represents a definition
of
the lever rule that essentially ensures conservation
of
mass in the system. The tie line and lever rule can
be
applied only in a
two-phase region; they make no sense in a one-phase region. Such analyses do
reveal information on phase compositions and amounts, yet they say nothing
about the physical appearance or shape that phases actually take. Phase
morphology is dependent on issues related to nucleation and growth.
30
A
Review
of
Materials Science
AI
ATOMIC
PER
CENT SILICON
SI
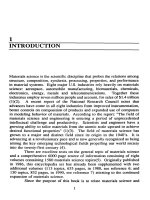
Figure
1-1
3.
M.
Hansen,
Consfitution
of
Binary Alloys,
McGraw-Hill.
Inc.
1958).
AI-Si equilibrium phase diagram. (Reprinted with permission
from
Before leaving the Ge-Si system, note that
L
represents a broad liquid
solution field where Ge and Si atoms mix in all proportions. Similarly, at
lower temperatures, Ge and Si atoms mix randomly but on the atomic sites
of
a
diamond cubic lattice to form a substitutional solid solution. The lens-shaped
L
-!-
S
region separating the single-phase liquid and solid fields occurs in many
binary systems, including Cu-Ni, Ag-Au, Pt-Rh, Ti-W, and Al,O,-Cr,O,.
A very common feature
on
binary phase diagrams is the eutectic isotherm.
The
AI-Si
system shown in Fig.
1-13
is an example of a system undergoing
a
eutectic transformation at 577
"C.
Alloy films containing about
1
at% Si are
used to make contacts
to
silicon in integrated circuits. The insert in Fig.
1-13
indicates the solid-state reactions for this alloy involve either the formation
of
an
Al-rich solid solution above 520
"C
or the rejection of Si below this
temperature in order to satisfy solubility requirements. Although this particu-
1.5.
Thermodynamics
of
Materials
31
1000
I
800
!
i
600
1
lar alloy cannot undergo a eutectic transformation, all alloys containing more
than
1.59
at% Si can. When crossing the critical isotherm from high tempera-
ture, the reaction
/
.
I
/
/
/
I
-
577
"C
L(11.3at% Si) A1(1.59at% Si)
+
Si
(
1-20)
!
400
200
29.5'
n
occurs. Three phases coexist at the eutectic temperature, and therefore
f
=
0.
Any change in temperature and/or phase composition will drive this very
special three-phase equilibrium into single- (i.e., L) or two-phase fields (i.e.,
L
+
Al, L
+
Si, A1
+
Si), depending on composition and temperature.
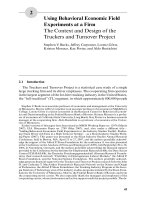
The important GaAs system shown in Fig. 1-14 contains two independent
side-by-side eutectic reactions at 29.5 and 810
"C.
For the purpose of analysis
one can consider that there are two separate eutectic subsystems, Ga-GaAs
and GaAs-As. In this way complex diagrams can be decomposed into simpler
units. The critical eutectic compositions occur
so
close to either pure compo-
nent that they cannot be resolved on the scale
of
this figure. The prominent
central vertical line represents the stoichiometric GaAs compound, which melts
at 1238
"C.
Phase diagrams for several other important
3-5
semiconductors,
14001T
1200
WEIGHT PERCENT ARSENIC
810"
"0
10
20
30
40
50
60
70
80
90 100
ATOMIC PERCENT ARSENIC
AS
Ga-As equilibrium phase diagram. (Reprinted with permission from
Ga
Figure
1-1
4.
M.
Hansen,
Constitution
of
Binary
Alloys,
McGraw-Hill, Inc.
1958).
32
A
Review
of
Materials
Science
(e.g., InP, GaP, and InAs) have very similar appearances. These compound
semiconductors are common in other ways. For example, one of the compo-
nents (e.g., Ga, In) has a low melting point coupled with a rather low vapor
pressure, whereas the other component (e.g., As,
P)
has a higher melting point
and a high vapor pressure. These properties complicate both bulk and thin-film
single-crystal growth processes.
We end this section on phase diagrams by reflecting on some distinctions in
their applicability to bulk and thin-film materials. High-temperature phase
diagrams were first determined in a systematic way for binary metal alloys.
The traditional processing route for bulk metals generally involves melting at a
high temperature followed by solidification and subsequent cooling to the
ambient. It is a reasonable assumption that thermodynamic equilibrium is
attained in these systems, especially at elevated temperatures. Atoms in metals
have sufficient mobility to enable stable phases to nucleate and grow within
reasonably short reaction times. This is not generally the case in metal oxide
systems, however, because of the tendency of melts to form metastable glasses
due to sluggish atomic motion.
In contrast, thin films do not generally pass from a liquid phase through a
vertical succession of phase fields. For the most
part,
thin-film science and
technology is characterized by low-temperature processing where equilibrium
is difficult to achieve. Depending on what is being deposited and the conditions
of deposition, thin films possessing varying degrees of thermodynamic stability
can be readily produced. For example, single-crystal silicon is the most stable
form
of this element below the melting point. Nevertheless, chemical vapor
deposition of Si from chlorinated silanes at
1200
“C will yield single-crystal
films, and amorphous films can be produced below
600
“C.
In between,
polycrystalline Si films of varying grain size can
be
deposited. Since films are
laid down an atomic layer at a time, the thermal energy of individual atoms
impinging on a massive cool substrate heat
sink
can be transferred
to
the latter
at an extremely rapid rate. Deprived of energy, the atoms are relatively
immobile. It is not surprising, therefore, that metastable and even amorphous
semiconductor and alloy films can be evaporated or sputtered onto cool
substrates. When such films are heated, they crystallize and revert to the more
stable phases indicated by the phase diagram.
Interesting issues related to binary phase diagrams arise with multicompo-
nent thin films that are deposited in layered structures through sequential
deposition from multiple sources. For example, ‘‘strained layer superlattices’
’
of
Ge-Si have been grown by molecular
beam
epitaxy
(MBE)
techniques (see
Chapter
7).
Films of Si and Si
+
Ge solid-solution alloy, typically tens of
angstroms thick, have been sequentially deposited such that the resultant
1.6.
Kinetics
33
composite film is a single crystal with strained lattice bonds. The resolution
of
distinct layers as revealed by the transmission electron micrograph of Fig.
14-17 is suggestive
of
a two-phase mixture. On the other hand, a single crystal
implies a single phase even if it possesses a modulated chemical composition.
Either way, the superlattice is not in thermodynamic equilibrium because the
Ge-Si phase diagram unambiguously predicts a stable solid solution at low
temperature. Equilibrium can be accelerated by heating, which results in film
homogenization by interatomic diffusion. In thin films, phases such as solid
solutions and compounds are frequently accessed
horizontally
across the
phase diagram during an isothermal anneal. This should be contrasted with
bulk materials, where equilibrium phase changes commonly proceed
vertically
downward from elevated temperatures.
1.6.
KINETICS
1.6.1.
Macroscopic Transport
Whenever a material system is not in thermodynamic equilibrium, driving
forces arise naturally to push it toward equilibrium. Such a situation can occur,
for example, when the free energy of a microscopic system varies from point
to point because of compositional inhomogeneities. The resulting atomic
concentration gradients generate time-dependent, mass-transport effects that
reduce free-energy variations in the system. Manifestations
of
such processes
include phase transformations, recrystallization, compound growth, and degra-
dation phenomena in both bulk and thin-film systems. In solids, mass transport
is accomplished by diffusion, which may be defined as the migration
of
an
atomic
or
molecular species within a given matrix under the influence
of
a
concentration gradient. Fick established the phenomenological connection
between concentration gradients and the resultant diffusional transport through
the equation
dC
dx
J=
-D-
(1-21)
The minus sign occurs because the vectors representing the concentration
gradient
dC/&
and atomic flux
J
are oppositely directed. Thus an increasing
concentration in the positive
x
direction induces mass
flow
in the negative
x
direction, and vice versa. The units
of
C
are typically atoms/cm3.
The
diffusion coefficient
D,
which has units
of
cm2/sec, is characteristic
of
both
the diffusing species and the matrix in which transport occurs. The extent
of
34
A
Review
of
Materials Science
observable diffusion effects depends on the magnitude of
D.
As
we shall later
note,
D
increases in exponential fashion with temperature according to a
Maxwell-Boltzmann relation; Le.,
D
=
Doexp
-
E,/RT,
(
1-22)
where
Do
is a constant and
RT
has the usual meaning. The activation energy
for diffusion
is
ED (cal/mole) .
Solid-state diffusion is generally a slow process, and concentration changes
occur over long periods
of
time; the steady-state condition in which concentra-
tions are time-independent rarely occurs in bulk solids. Therefore, during
one-dimensional diffusion, the mass flux across plane
x
of area
A
exceeds
that which flows across plane
x
+
dx.
Atoms will accumulate with time in the
volume
A
dx,
and this is expressed by
dJ dJ dc
(
dx
)
dx dt
JA- J+-dx A= Adx=-Adx.
(1-23)
Substituting
Eq.
1-21 and assuming that
D
is a constant independent of
C
or
x
gives
ac(
X,
t)
a2c(
X,
t)
=D
at
a
x2
(
1-24)
The non-steady-state heat conduction equation is identical if temperature is
substituted for
C
and the thermal diffusivity for
D.
Many solutions for both
diffusion and heat conduction problems exist for media of varying geometries,
constrained by assorted initial and boundary conditions. They can be found in
the books by Carslaw and Jaeger, and by Crank, listed in the bibliography.
Since complex solutions to Eq. 1-24 will be discussed on several occasions
(e.g., in Chapters
8,
9,
and
13),
we introduce simpler applications here.
Consider an initially pure thick film into which some solute diffuses from
the surface. If the film dimensions are very large compared with the extent of
diffusion, the situation can be physically modeled by the following conditions:
C(x,O)
=
0
at
t
=
0
(
1 -25a)
C(o0,
t)
=
0
at
x
=
03
for
t
>
0.
(1-25b)
The second boundary condition that must be specified has to do with the nature
of the diffusant distribution maintained at the film surface
x
=
0.
Two simple
cases can be distinguished. In the first, a thick layer of diffusant provides an
essentially limitless supply of atoms maintaining a
constant
surface concentra-
tion
Co
for all time. In the second case, a very thin layer of diffusant provides
an
instantaneous
source
So
of surface atoms per unit area. Here the surface
for
03
>
x
>
0,
1.6.
Kinetics
35
concentration diminishes with time as atoms diffuse into the underlying film.
These two cases are respectively described by
c(0,
t)
=
c,
lmc(
x,
t)
dx
=
so
Expressions for
C(
x,
t)
satisfying these conditions are respectively
(1
-26a)
(
1
-26b)
X
C(x,
t)
=
C0erfc-
=
c,,
rn
SO
X2
c(x,
t)
=
~
exp
-
-
4Dt'
(1-27b)
and these represent the simplest mathematical solutions to the diffusion equa-
tion. They have been employed to determine doping profiles and junction
1
10.'
10
10
-31
t\\
F-Gt
\\GAUSSIAN
j-
Figure
1-15.
Normalized Gaussian and Erfc curves
of
C/C,
vs.
x/m.
Both
logarithmic and linear scales are
shown.
(Reprinted with permission from John Wiley
and Sons, from
W.
E. Beadle,
J.
C. C.
Tsai, and
R.
D.
Plummer,
Quick Reference Manual
for Silicon Integrated Circuit
Technology,
Copyright
0
1985,
Bell
Telephone Laboratories
Inc. Published
by
J.
Wiley and
Sons).
36
A
Review
of
Materials Science
depths in semiconductors. The error function erf x/2a, defined by
(1-28)
is a tabulated function of only the upper limit or argument x/2fi.
Normalized concentration profiles for the Gaussian and Erfc solutions
are shown in Fig. 1-15.
It
is of interest to calculate how these distributions
spread with time. For the erfc solution, the diffusion front at the arbitrary
concentration of
C(x,
t)/C,
=
1/2 moves parabolically with time as
x
=
2merfc-'(1/2) or
x
=
0.96m.
When becomes large compared
with the film dimensions, the assumption of an infinite matrix is not valid and
the
solutions do not strictly hold. The film properties may also change
appreciably due to interdiffusion.
To
limit the latter and ensure the integrity of
films,
D
should
be
kept small, which in effect means the maintenance of low
temperatures. This subject will
be
discussed further in Chapter
8.
1.6.2.
Atomistic Considerations
Macroscopic changes in composition during diffusion are the result of the
random motion of countless individual atoms unaware of the concentration
gradient they have helped establish. On a microscopic level, it is sufficient to
explain how atoms execute individual jumps from one lattice site to another,
for through countless repetitions of unit jumps macroscopic changes occur.
Consider Fig. 1-16a, showing neighboring lattice planes spaced a distance
a,
apart within a region where an atomic concentration gradient exists. If there
are
n,
atoms per unit area of plane 1, then at plane 2,
n2
=
n,
+
(dn
/dx)
a,,
a
b.
ooo
0
000
OE0
00
0
0-0
0
ouo
Figure
1-16.
Atomistic view
of
atom jumping into a neighboring vacancy.
(a) Atomic diffusion fluxes between neighboring crystal planes.
1.6.
Kinetics
37
where we have taken the liberty of assigning a continuum behavior at discrete
planes. Each atom vibrates about its equilibrium position with a characteristic
lattice frequency
v,
typically
lOI3
sec
-’.
Very few vibrational cycles have
sufficient amplitude
to
cause the atom to actually jump into an adjoining lattice
position, thus executing a direct atomic interchange. This process would be
greatly encouraged, however, if there were neighboring vacant sites. The
fraction of vacant lattice sites was previously given by
eCEflkT
(see Eq. 1-3).
In addition, the diffusing atom must acquire sufficient energy to push the
surrounding atoms apart
so
that it can squeeze past and land in the so-called
activated state shown in Fig. 1-16b. This step is the precursor to the downhill
jump of the atom into the vacancy. The number of times per second that an
atom successfully reaches the activated state is
ve-‘JIkT,
where
ci
is the
vacancy jump or migration energy per atom. Here the Boltzmann factor may
be
interpreted as the fraction of all sites in the crystal that have an activated
state configuration. The atom fluxes from plane 1 to
2
and from plane
2
to
1
are then, respectively, given as
J,,,
=
-vexp
1
-
-exp
Ef
-
-(Ca,),
‘i
6
kT kT
(
1 -29a)
1
&f
‘i
dC
6
kT kT
J2+1
=
-vexp
-
-exp
-
-
where we have substituted
Ca,
for
n
and used the factor of 116 to account for
bidirectional jumping in each
of
the three coordinate directions. The net flux
JN
is the difference or
1
‘f
JN
=
-
-aivexp
-
-exp
-
6
kT
(
1-30)
By association with Fick’s law,
D
can be expressed as
D
=
D,exp
-
ED/RT
(1-31)
with
Do
=
(1/6)aiv and
ED
=
(E~
+
€/.)NA,
where
NA
is Avogadro’s num-
ber.
Although the above model is intended for atomistic diffusion in the bulk
lattice, a similar expression for
D
would hold for transport through grain
boundaries or along surfaces and interfaces of films. At such nonlattice sites,
energies for defect formation and motion are expected to be less, leading to
higher diffusivities. Dominating microscopic mass transport is the Boltzmann
factor exp
-
E,/RT,
which is ubiquitous when describing the temperature
dependence of the rate of many processes in thin films. In such cases the
kinetics can
be
described graphically by an Arrhenius plot in which the
38
A
Review
of
Materials
Science
a.
APPLIED FIELD
FREE
ENERGY
Figure
1-17.
(a)
Free-energy variation
with
atomic
distance
in
the
absence
of
an
applied field.
(b)
Free-energy variation with atomic distance
in
the
presence
of
an
applied field.
logarithm of the rate is plotted on the ordinate and the reciprocal of the
absolute temperature is plotted along the abscissa. The slope of the resulting
line is then equal to
-
ED
/R,
from which the characteristic activation energy
can be extracted.
The discussion to this point is applicable to motion of both impurity and
matrix atoms. In the latter case we speak of self-diffusion.
For matrix atoms
there are driving forces other than concentration gradients that often result in
transport of matter. Examples are forces due to stress fields, electric fields,
and interfacial energy gradients. To visualize their effect, consider neighboring
atomic positions in a crystalline solid where no fields are applied. The free
energy of the system has the periodicity of the lattice and varies schematically,
as shown in Fig. 1-17a. Imposition of an external field now biases the system
such that the free energy is lower in site 2 relative to
1
by an amount 2
AG.
A
free-energy gradient exists in the system that lowers the energy barrier to
motion from
1
-+
2 and raises it from
2
-+
1.
The rate at which atoms move
from
1
to
2
is given by
sec-I.
GD
-
AG
(
1
-32a)
1.6.
Kinetics
39
Similarly,
r21
=
vexp
(
-
GDiTAG)
sec-I, (1-32b)
and the
net
rate
r,
is given by the difference or
GD
AG
RT RT RT
=
2vexp
-
-si& (1-33)
When
AG
=
0,
the system is in thermodynamic equilibrium and
r,
=
0,
so
no net atomic motion occurs. Although
GD
is typically a few electron volts or
so
per atom
(1
eV
=
23,060 cal/mole),
AG
is much smaller in magnitude
since it
is
virtually impossible to impose external forces on solids comparable
to the interatomic forces. In fact,
AGIRT
is usually much less than unity,
so
sinh
AGIRT
=
AGIRT.
This leads to commonly observed linear diffusion
effects. But when
AGIRT
I:
1, nonlinear diffusion effects
are
possible. By
multiplying both sides
of
Eq. 1-33 by
ao,
we obtain the atomic velocity
u:
2
AG
u
=
a,r,
=
[
a;ve-'~/~~]
-
a,RT'
(
1-34)
The term in brackets is essentially the diffusivity
D
with
GD
a diffusional
activation energy. (The distinction between
GD
and
ED
need not concern
us
here.) The term
2
AGla,
is a measure of the molar free-energy gradient or
applied force
F.
Therefore, the celebrated Nernst-Einstein equation results:
u
=
DF/RT.
(1-35)
Application of this equation will be made subsequently to various thin-film
mass transport phenomena, e.g
.
,
electric-field-induced atomic migration (elec-
tromigration), stress relaxation, and grain growth. The drift
of
charge carriers
in semiconductors under an applied field can
also
be modeled by
Eq.
1-35. In
some instances, larger generalized forces can be applied to thin films relative
to bulk materials because of the small dimensions involved.
Chemical reaction rate
theory
provides
a
common application
of
the preced-
ing ideas. In Fig.
1-18
the reactants at the left
are
envisioned to proceed
toward the right following the reaction coordinate path. Along the way,
intermediate activated states are accessed by surmounting the free-energy
barrier. Through decomposition of the activated species, products form. If
C,
is the concentration of reactants at coordinate position
1
and
C,
the concentra-
tion of products at 2, then the net rate
of
reaction
is
proportional to
r,
=
C,exp(
-
g)
-
C,exp(
-
'*iTAG),
(1-36)
40
A
Review
of
Materials Science
t
FREE
ENERGY
1
REACTION
2
COORDINATE
-
Figure
1-18.
Free-energy path for thermodynamically favored reaction
1
t
2.
where
G*
is the free energy of activation.
As
before, the Boltzmann factors
represent the probabilities of surmounting the respective energy barriers faced
by reactants proceeding in the forward direction, or products in the reverse
direction. When chemical equilibrium prevails, the competing rates are equal
and
r,
=
0.
Therefore,
AG
exp
-
Gp/RT
-
exp-
=
(1-37)
CP
_-
CR
RT
exp
-
GR/RT'
For the reaction to proceed to the right
AG
=
GR
-
Gp
must be positive.
By comparison with Eq.
1-12,
it is apparent that the left-hand side
is
the
equilibrium constant and
AG
may
be
associated with
-
AGO.
This expression
is perfectly general, however, and applies, for example, to electron energy-level
populations
in
semiconductors and lasers, as well as magnetic moment distribu-
tions in solids. In fact, whenever thermal energy is
a
source of activation
energy,
Eq.
1-37
is valid.
1.7.
NUCLEATION
When the critical lines separating stable phase fields on equilibrium phase
diagrams are crossed, new phases appear. Most frequently, a decrease in
1.7.
Nucleation
41
temperature is involved, and this may, for example, trigger solidification or
solid-state phase transformations from now unstable melts or solid matrices.
When such a transformation occurs, a new phase of generally
different
structure and composition emerges from the prior parent phase or phases. The
process known as nucleation occurs during the very early stages of phase
change. It is important in thin films because the grain structure that ultimately
develops in a given deposition process is usually strongly influenced by what
happens during film nucleation and subsequent growth.
Simple models of nucleation are first of all concerned with thermodynamic
questions of the energetics
of
the process of forming a single stable nucleus.
Once nucleation is possible, it is
usual
to try to specify how many such stable
nuclei will form within the system per unit volume and per unit time-i.e.,
nucleation rate.
As
an example, consider the homogeneous nucleation of a
spherical solid phase
of
radius
r
from a prior supersaturated vapor. Pure
homogeneous nucleation is rare but easy to model since it occurs without
benefit of complex heterogeneous sites such as exist on an accommodating
substrate surface. In such a process the gas-to-solid transformation results in a
reduction of the chemical free energy of the system given by
(4/3)7rr3AGv,
where
AG,
corresponds to the change in chemical free energy per unit
volume. For the condensation reaction vapor (v)
+
solid
(s),
Eq.
1-13
indi-
cates that
kT
P-
kT
P
(1-38)
where
P,
is
the vapor pressure above the solid,
P,
is the pressure of the
supersaturated vapor, and
Q
is the atomic volume.
A
more instructive way to
write
Eq.
1-38
is
AG,
=
-
(kT/Q)ln(l
+
S),
(
1-39)
where
S
is the vapor supersaturation defined by
(P,
-
P,)/
P,
. Without
supersaturation,
AGv
is zero and nucleation is impossible. In our example,
however,
P,
>
P,
and
AGv
is negative, which is consistent with the notion of
energy reduction. Simultaneously, new surfaces and interfaces form. This
results in an increase in the surface free energy
of
the system given by
47rr2y,
where
y
is the surface energy per unit area. The total free-energy change in
forming the nucleus is thus given by
AG
=
(4/3)?rr3AG,
+
47rr2y,
(140)
and minimization of
AG
with respect to
r
yields the equilibrium size of
r
=
r*.
Thus,
dAG/dr
=
0,
and
r*
=
-2y/AGv.
Substitution in Eq.
1-40
42
A
Review
of Materials
Science
t
FREE
ENERGY
CHANGE
AG
Figure
1-1
9.
Free-energy change
(AG)
as a
function of cluster
(r*
>
r)
or stable
nucleus
(r
>
r*)
size.
r*
is critical nucleus size, and
AG*
is
critical free-energy
barrier for nucleation.
gives
AG*
=
16~y~/3(AG,)~.
The quantities
r*
and
AG*
are shown in Fig.
1-19,
where it is evident that
AG*
represents an energy barrier to the
nucleation process. If a solid-like spherical cluster of atoms momentarily forms
by some thermodynamic fluctuation, but with radius less than
r*,
the cluster is
unstable and will shrink by losing atoms. Clusters larger than
r*
have sur-
mounted the nucleation energy barrier and are stable. They tend to grow
larger while lowering the energy of the system.
The nucleation rate
N
is essentially proportional to the product
of
three
terms, namely,
N
=
N*A*~
(nuclei/cm2-sec).
(1-41)
N*
is the equilibrium concentration (per cm2) of stable nuclei, and
w
is the
rate at which atoms impinge (per cm2-sec) onto the nuclei of critical area
A*.
Based on previous experience of associating the probable concentration of an
entity with its characteristic energy through a Boltzmann factor, it is appropri-
ate to take
N*
=
n,e-AG*/kT,
where
n,
is the density of all possible nuclea-
tion sites. The atom impingement flux is equal to the product
of
the concentra-
tion
of
vapor atoms and the velocity with which they strike the nucleus. In the
next chapter we show that this flux is given by
a(P,
-
P,)N,
I-,
Exercises
43
where A4 is the atomic weight and
CY
is the sticking coefficient. The nucleus
area is simply
4ar2,
since gas atoms impinge over the entire spherical surface.
Upon combining terms, we obtain
AG*
kT
a(
P,
-
Ps)
NA
VzmT-
N
=
n,exp
-
-
4ar2
The most influential term in this expression is the exponential factor. It
contains
AG*,
which is, in turn, ultimately a function of
S.
When the vapor
supersaturation is sufficiently large, homogeneous nucleation in the gas is
possible. This phenomenon causes one of the more troublesome problems
associated with chemical vapor deposition processes since the solid particles
that nucleate settle on and are incorporated into growing films destroying their
integrity.
Heterogeneous nucleation of films is a more complicated subject in view of
the added interactions between deposit and substrate. The nucleation sites in
this case are kinks, ledges, dislocations, etc., which serve to stabilize nuclei
of
differing size. The preceding capillarity theory will be used again in Chapter
5
to model heterogeneous nucleation processes. Suffice it to say that when ~ is
high during deposition, many crystallites will nucleate and a fine-grained film
results. On the other hand, if nucleation is suppressed, conditions favorable to
single-crystal growth are fostered.
1.8.
CONCLUSION
At this point we conclude this introductory sweep through several relevant
topics in materials science. If the treatment of structure, bonding, thermody-
namics, and kinetics has introduced the reader to
or
elevated his
or
her prior
awareness of these topics, it has served the intended purpose. Threads of this
chapter will be woven into the subsequent fabric
of
the discussion on the
preparation and properties of thin films.
1.
An FCC film is deposited on the (100) plane of a single-crystal FCC
substrate. It is determined that the angle between the
[lo01
directions in
the film and substrate is
63.4".
What are the Miller indices of the plane
lying in the film surface?
44
A
Review
of
Materials
Science
2. Both Au, which
is
FCC, and W, which is body-centered cubic (BCC)
have a density of
19.3
g/cm3. Their respective atomic weights are
197.0
and
183.9.
a. What is the lattice parameter of each metal?
b. Assuming both contain hard sphere atoms, what is the ratio of their
diameters?
3.
a. Comment on the thermodynamic stability of a thin-film superlattice
composite consisting of alternating Si and Ge,,,Si,., film layers shown
in Fig.
14-17
given the Ge-Si phase diagram (Fig.
1-12).
b. Speculate on whether the composite is a single phase (because it is a
single crystal) or consists of two phases (because there are visible film
interfaces).
4.
Diffraction of
1.5406-i
X-rays from a crystallographically oriented
(epitaxial) relaxed bilayer consisting of
AlAs
and GaAs yields two closely
spaced overlapping peaks. The peaks are due to the
(1
11)
reflections from
both films. The lattice parameters are
a,(AlAs)
=
5.6611
A
and
a,(GaAs)
=
5.6537
A.
What is the peak separation in degrees?
5. The potential energy of interaction between atoms in an ionic solid as a
function of separation distance is given by
V(r)
=
-A
/r
+
Br-",
where A,
B,
and
n
are constants.
a. Derive a relation between the equilibrium lattice distance
a, and A,
B,
and
n.
b. The force constant between atoms is given by
K,
=
d2
V/dr2
I
r=llo.
If
Young's elastic modulus (in units of force/area) is essentially given
by
K,
/a,,
show that it varies as
aG4
in ionic solids.
6.
What is the connection between the representations
of
electron energy in
Figs.
1-8a
and
1-9?
Illustrate for the case of an insulator. If the material
in
Fig. 1-8a were compressed, how would
E,
change? Would the
electrical conductivity change? How?
7.
A
75
at%
Ga-25
at%
As
melt
is
cooled from
1200
"C
to
0
"C
in
a
crucible.
a. Perform a complete phase analysis of the crucible contents at
1200
"C,
lo00
OC,
600
OC,
200
OC,
30
OC,
and
29
'C.
What phases are
present? What are their chemical compositions, and what are the
relative amounts of these phases? Assume equilibrium cooling.
Exercises
45
b.
A
thermocouple immersed in the melt records the temperature as the
crucible cools. Sketch the expected temperature-time cooling re-
sponse.
c.
Do a complete phase analysis for a
75
at%
As-25
at% Ga melt at
lo00
'C,
800
"C,
and
600
"C.
8.
A
quartz (SiO,) crucible is used to contain Mg during thermal evapora-
tion in an effort to deposit Mg thin films. Is this a wise choice of crucible
material? Why?
9.
A solar cell is fabricated by diffusing phosphorous
(N
dopant) from a
constant surface source of
lozo
atoms/cm3 into a P-type Si wafer
containing
10l6
B
atoms/cm3. The difisivity of phosphorous is
cm2/sec, and the diffusion time is
1
hour. How far from the surface is the
junction depth-i.e., where
C,
=
C,?
10.
A brass thin film of thickness
d
contains
30
wt% Zn in solid solution
within
Cu.
Since Zn is a volatile species, it readily evaporates from the
free surface
(x
=
d)
at elevated temperature but is blocked at the
substrate interface,
x
=
0.
a. Write boundary conditions for the Zn concentration at both film
surfaces.
b. Sketch a time sequence of the expected Zn concentration profiles
across the film during dezincification. (Do not solve mathematically
.)
11.
Measurements on the electrical resistivity of
Au
films reveal a three-
order-of-magnitude reduction in the equilibrium vacancy concentration as
the temperature drops from
600
to
300
"C.
a. What is the vacancy formation energy?
b. What fraction of sites will be vacant at
1080
"C?
12.
During the formation of SiO, for optical fiber fabrication, soot particles
500
in size nucleate homogeneously in the vapor phase at 1200 "C. If
the surface energy of SiO, is
loo0
ergs/cm2, estimate the value of the
supersaturation present.
13.
An ancient recipe for gilding bronze statuary alloyed with small amounts
of
gold calls
for
the following surface modification steps.
(1)
Dissolve surface layers of the statue by applying weak acids (e.g.,
vinegar).
46
A
Review
of
Materiais Science
(2)
After washing and drying, heat the surface to as high a temperature as
possible but not to the point where the statue deforms
or
is damaged.
(3)
Repeat step
1.
(4)
Repeat step
2.
(5)
Repeat this cycle until the surface attains the desired golden appear-
Explain the chemical and physical basis underlying this method of
gilding.
ance.
REFERENCES
A.
General Overview
1.
2.
3.
4.
5.
6.
M.
F. Ashby and
D.
R. H. Jones,
Engineering Materials,
Vols.
1
and
2,
Pergamon Press, Oxford
(1980
and
1986).
C. R. Barrett, W.
D.
Nix, and A.
S.
Tetelman,
The Principles
of
Engineering Materials,
Prentice Hall, Englewood Cliffs, NJ
(1973).
0.
H. Wyatt and
D.
Dew Hughes,
Metals, Ceramics and Polymers,
Cambridge University Press, London
(1974).
J. Wulff, et al.,
The Structure and Properties
of
Materials,
Vols.
1-4,
Wiley, New York
(1964).
M.
Ohring,
Engineering Materials Science,
Academic Press,
San
Diego
(1995).
L.
H. Van Vlack,
Elements
of
Materials Science and Engineering,
Addison-Wesley, Reading, MA
(1989).
B.
Structure
1.
B.
D.
Cullity,
Elements
of
X-ray Diffraction,
Addison-Wesley, Reading,
2.
C.
S.
Barrett and
T.
B.
Massalski,
The Structure
of
Metals,
McGraw-Hill,
3.
G.
Thomas
and
M.
J.
Goringe,
Transmission Electron Microscopy
of
MA
(1978).
New York
(1966).
Materials,
Wiley, New York
(1979).
C.
Defects
1.
J.
Friedel,
Dislocations,
Pergamon Press, New York
(1964).
References
47
2.
A.
H.
Cottrell,
Mechanical Properties
of
Matter,
Wiley, New York
3.
D. Hull,
Introduction to Dislocations,
Pergamon Press, New York
(1964).
(1965).
D.
Classes
of
Solids
a. Metals
1.
A.
H.
Cottrell,
Theoretical Structural Metallurgy,
St. Martin’s Press,
2.
A.
H.
Cottrell,
An Introduction to Metallurgy,
St. Martin’s Press, New
New York (1957).
York (1967).
b.
Ceramics
1. W. D. Kingery, H. K. Bowen, and
D.
R.
Uhlmann,
Introduction
to
Ceramics,
Wiley, New York (1976).
c.
Glass
1.
R.
H.
Doremus,
Glass Science,
Wiley, New York (1973).
d.
Semiconductors
1.
S.
M.
Sze,
Semiconductor Devices-Physics and Technology,
Wiley,
2.
A.
S.
Grove,
Physics and Technology
of
Semiconductor Devices,
3.
J.
M. Mayer and
S. S.
Lau,
Electronic Materials Science: For Integrated
New York (1985).
Wiley, New York (1967).
Circuits in
Si
and GaAs,
Macmillan, New York (1990).
E.
Thermodynamics
of
Materials
1.
R.
A.
Swalin,
Thermodynamics
of
Solids,
Wiley, New York (1962).
2.
C.
H.
Lupis,
Chemical Thermodynamics
of
Materials,
North-Holland,
New York (1983).
48
A
Review
of
Materials
Science
F.
Diffusion, Nucleation, Phase Transformations
1.
P.
G.
Shewmon,
Diffusion in
Solids,
McGraw-Hill, New
York
(1963).
2.
J.
Verhoeven,
Fundamentals of Physical Metallurgy,
Wiley, New York
3.
D.
A.
Porter and
K.
E.
Easterling,
Phase Transformations
in
Metals and
(1975).
Alloys.
Van Nostrand Reinhold, Berkshire, England (1981).
G.
Mathematics of Diffusion
1.
H.
S.
Carslaw and
J.
C. Jaeger,
Conduction
of
Heat in Solids,
Oxford
2.
J.
Crank,
The Mathematics
of
Diffusion, Oxford
University Press,
University Press, London
(
1959).
London
(
1964).
Chapter
2
1
Vacuum Science
and Technology
Virtually all thin-film deposition and processing methods as well as techniques
employed to characterize and measure the properties of films require a vacuum
or some sort of reduced-pressure environment. For this reason the relevant
aspects of vacuum science and technology are discussed at this point. It is also
appropriate in a broader sense because this subject matter is among the most
undeservedly neglected in the training of scientists and engineers. This is
surprising in view of the broad interdisciplinary implications of the subject and
the ubiquitous use of vacuum in
all
areas
of
scientific research and technologi-
cal endeavor. The topics treated in this chapter will, therefore, deal with:
2.1.
Kinetic Theory of Gases
2.2.
Gas Transport and Pumping
2.3.
Vacuum Pumps and Systems
2.1.
KINETIC
THEORY
OF
GASES
2.1
.I.
Molecular Velocities
The well-known kinetic theory
of
gases provides
us
with
an
atomistic picture
of
the state
of
affairs in a confined gas (Refs.
1,
2).
A
fundamental assumption
49
50
Vacuum Science and
Technology
is that the large number of atoms or molecules of the gas are in a continuous
state of random motion, which is intimately dependent on the temperature
of
the gas. During their motion the gas particles collide with each other as well as
with the walls of the confining vessel. Just how many molecule-molecule or
molecule-wall impacts occur depends on the concentration or pressure
of
the
gas. In
the
perfect
or
ideal gas approximation, there are no attractive or
repulsive forces between molecules. Rather, they may be considered to behave
like independent elastic spheres separated from each other by distances that are
large compared with their size. The net result of the continual elastic collisions
and exchange
of
kinetic energy is that a steady-state distribution of molecular
velocities emerges given by the celebrated Maxwell-Boltzmann formula
(2-1)
2RT'
This centerpiece of the kinetic theory of gases states that the fractional number
of
molecules
f(v),
where
n
is
the number per unit volume in the velocity
range
v
to
u
+
dv,
is related to their molecular weight
(M)
and absolute
temperature
(T).
In this formula the units of the gas constant
R
are on a
per-mole basis.
Among the important implications of
Eq.
2-1,
which is shown plotted in Fig.
2-1,
is that molecules can have neither zero nor infinite velocity. Rather, the
most probable molecular velocity in the distribution is realized at the maximum
v(1
o
5cm
.s'
)
Figure
2-1.
sion
from
Ref.
1).
Velocity distributions
for
A1 vapor and
H,
gas. (Reprinted
with
permis-
2.1.
Kinetic Theory
of
Gases
51
value of
f(u)
and can be calculated from the condition that
df(u)/du
=
0.
Since the net velocity is always the resultant of three rectilinear components
u,
,
u,,
,
and
u,
,
one or even two, but of course not
all
three, of these may be
zero simultaneously. Therefore, a similar distribution function of molecular
velocities in each
of
the component directions can
be
defined; i.e.,
1
dn,
M
1/2
Mu:
exp
-
-
n
dux
I2rRTI 2RT’
f(ux)
=
=
-
and similarly for the
y
and
z
components.
A
number of important results emerge as a consequence of the foregoing
equations. For example, the most probable
(urn),
average
(V),
and mean square
(u2)
velocities are given, respectively, by
-
(2-3a)
(2-3b)
These velocities, which are noted in Fig. 2-1, simply depend on the
molecular weight of the gas and the temperature. In air at
300
K, for example,
the average molecular velocity is
4.6
x
lo4
cm/sec, which is almost 1030
miles per hour. However, the kinetic energy of any collection of gas mole-
cules is solely dependent on temperature. For a mole quantity it is given by
(1 /2)M7
=
(3/2) RT with
(1
/2) RT partitioned in each
of
the coordinate
directions.
2.1.2.
Pressure
Momentum transfer from the gas molecules to the container walls gives rise to
the forces that sustain the pressure in the system. Kinetic theory shows that the
gas pressure
P
is related to the mean-square velocity of the molecules and,
52
Vacuum Sclence
and
Technology
thus, alternatively to their kinetic energy or temperature. Thus,
1
nM- nRT
p=
u2
=
-
NA
NA
'
where
NA
is Avogadro's number. From the definition of
n
it is apparent that
Eq.
2-4 is also an expression for the perfect gas law. Pressure is the most
widely quoted system variable in vacuum technology, and this fact has
generated a large number of units that have been used to define it under
various circumstances. Basically, two broad types of pressure units have arisen
in practice. In what we shall call the scientific system (or coherent unit system
(Ref.
2)),
pressure is defined as the rate of change of the normal component of
momentum of impinging molecules per unit area of surface. Thus, the pressure
is
normally defined as a force per unit area, and examples of these units are
dynes/cm2
(CGS)
or newtons/meter2 (N/m2)
(MKS).
Vacuum levels are now
commonly reported in
SI
units or pascals;
1
pascal (Pa)
=
1
N/m2. Histori-
cally, however, pressure was, and still is, measured by the height of a column
of liquid, e.g., Hg or
H20.
This has led to a set of what we shall call practical
or noncoherent units such as millimeters and microns of Hg, torr, atmo-
spheres, etc., which are still widely employed by practitioners as well as by
equipment manufacturers. Definitions
of
some units together with important
conversions include
1
atm
=
1.013
x
IO6
dynes/cm2
=
1.013
x
lo5
N/m2
=
1.013
x
lo5
Pa
1
torr
=
1
mm
Hg
=
1.333
x
lo3
dynes/cm2
=
133.3
N/m2
=
133.3
Pa
1
bar
=
0.987
atm
=
750
torr.
The mean distance traveled by molecules between successive collisions,
called the mean-free path
&@,
is an important property of the gas that
depends on the pressure. To calculate
A,,,@,,
we note that each molecule
presents a target area
ad:
to others, where
d,
is its
collision
diameter.
A
binary collision occurs each time the center
of
one molecule approaches within
a distance
d, of
the other. If we imagine the diameter of one molecule
increased to 2d, while the other molecules are reduced to points, then in
traveling a distance
A,,,@
the former sweeps out a cylindrical volume
?rdfA,,,,,
.
One collision will occur under the conditions
rdf$*n
=
1.
For air at 5oom
temperature and atmospheric pressure,
&@
=
500
A, assuming
d,
=
5
A.
A molecule collides in a time given by
A,,,@
/
u
and under the previous
conditions, air molecules make about
10''
collisions per second. This is why
gases mix together rather slowly even though the individual molecules are