The Materials Science of Thin Films 2011 Part 6 doc
Bạn đang xem bản rút gọn của tài liệu. Xem và tải ngay bản đầy đủ của tài liệu tại đây (2.09 MB, 50 trang )
228
Film Formation and Structure
is
limited, and therefore their Occurrence is ubiquitous. For example, columnar
grains have been observed in high-melting-point materials (Cr, Be, Si, and
Ge), in compounds of high binding energy (Tic, TIN, CaF,
,
and PbS), and in
non-noble metals evaporated in the presence
of
oxygen
(Fe
and Fe-Ni).
Amorphous films
of
Si, Ge, SiO, and rare earth-transition metal alloys (e.g.,
Gd-Co), whose very existence depends on limited adatom mobility, are
frequently columnar when deposited at sufficiently low temperature. Inasmuch
as grain boundaries are axiomatically absent in amorphous films, it is more
correct to speak
of
columnar
morphology
in this case. This columnar
morphology is frequently made visible by transverse fracture
of
the film
because
of
crack propagation along the weak, low-density intercolumnar
regions. Magnetic, optical, electrical, mechanical, and surface properties
of
films are affected, sometimes strongly, by columnar structures.
In
particular,
the magnetic anisotropy
of
seemingly isotropic amorphous Gd-Co films is
apparently due to its columnar structure and interspersed voids.
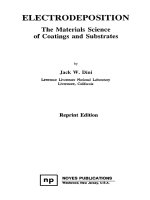
A
collection
of
assorted electron micrographs
of
film and coating columnar structures is
shown in Fig.
5-14.
Particularly noteworthy are the structural similarities
among varied materials deposited by different processes, suggesting common
nucleation and growth mechanisms.
An interesting observation (Ref.
20)
on
the geometry of columnar grains has
been formulated into the so-called tangent rule expressed by
Eq.
5-43.
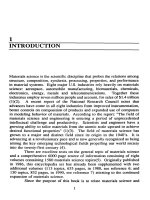
Careful
measurements on obliquely evaporated
AI
films reveal that the columns are
oriented toward the vapor source, as shown in the microfractograph of Fig.
5-15.
The angle
p
between the columns and substrate normal is universally
observed to be somewhat less than the angle
a,
formed by the source direction
and substrate normal.
An
experimental relation connecting values
of
a
and
p,
obtained by varying the incident vapor angle over a broad range
(0
<
a
<
90"),
was found to closely approximate
tan
CY
=
2
tan
0.
The very general occurrence of the columnar morphology implies
a
simple
nonspecific origin such as geometric shadowing, which affords an understand-
ing
of
the main structural features.
Recently,
a
closer look has been taken of the detailed microstructure
of
columnar growth
in
sputtered amorphous Ge and Si, as well as TiBz, WO,
.
BN,
and Sic thin films (Ref.
21).
Interestingly, an evolutionary development
of
columnar grains ranging in size from
occurs. When
prepared under
low
adatom mobility conditions
(T,
/
T,
<
0.5),
three general
structural units are recognized; nano-, micro-, and macrocolumns together
with associated nano-, micro-, and macrovoid distributions.
A
schematic
of
(5-43)
-
20
to
4000
5.6.
Grain Structure
of
Films and Coatings
229
Co
Cr
Ta
Figure
5-1
4.
Representative set of cross-sectional transmission electron micrographs
of thin
films
illustrating variants
of
columnar microstructures. (a) acid-plated
Cu,
(b)
sputtered Cu,
(c)
sputtered Co-Cr-Ta
alloy,
(d)
CVD silicon (also Fig.
4-12),
(e)
sputtered W,
D
=
dislocation,
T
=
twin. (Courtesy of D.
A.
Smith,
IBM
T.
J.
Watson
Research Lab. Reprinted with permission from Trans-Tech Publication, from Ref.
19).
230
Film Formation and Structure
Figure
5-15.
deposition geometry. (From
Ref.
20).
Electron micrograph
of
a replica
of
a
-
2
pm-thick
Al
film. Inset shows
these interrelated, nested columns is shown in Fig. 5-16. It is very likely that
the columnar grains of zones 1 and T in
the
Thornton scheme are composed of
nano- and microcolumns.
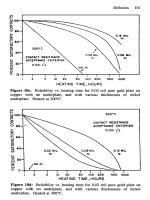
Computer simulations (Ref.
22)
have contributed greatly to
our
understand-
ing
of
the origin
of
columnar grain formation and the role played by shadow-
ing. By serially “evaporating” individual hard spheres (atoms) randomly onto
a growing film at angle
a,
the
structural simulations in Fig. 5-17 were
obtained. The spheres were allowed to relax following impingement into the
nearest triangular pocket formed by three previously deposited atoms, thus
maximizing close atomic packing. The simulation shows that limited atomic
5.6.
Grain
Structure
of
Films and Coatings
231
mobility during low-temperature deposition reproduces features observed ex-
perimentally.
As
examples, film density decreases with increasing
a,
high-
density columnlike regions appear at angles for which
fl
<
a,
and film
densification is enhanced at elevated temperatures. Lastly, the column orienta-
tions agree well with the tangent rule. The evolution
of
voids occurs if those
atoms exposed to the vapor beam shield or shadow unoccupied sites from
direct impingement, and if post-impingement atom migration does not succeed
in filling the voids. This self-shadowing effect is thus more pronounced the
lower the atomic mobility and extent of lattice relaxation.
An
important
consequence of the columnar-void microstructure is the insta-
bility
it engenders in optical coatings exposed to humid atmospheres. Under
typical evaporation conditions
(-
torr,
T,
=
30-300
"C
and deposition
rate of
300-3000
A/s)
dielectric films generally develop a zone
2
structure.
Water from the ambient is then absorbed throughout the film by capillary
action. The process is largely irreversible and alters optical properties such as
Figure
5-16.
Schematic representation
of
macro, micro and nano columns
for
sput-
tered
amorphous
Ge films. (Courtesy
of
R.
Messier, from
Ref.
21).
232
Film Formation and Structure
0.45'
T=350K
t
~1.6
s
t
=
1.5
s
1
b"i,5'
T=420K
t=2.1s
I
I
t
=3.6
s
I
Figure
5-1
7. Computer-simulated microstructure of
Ni
fdm during deposition
at
different times for substrate temperatures of
(a)
350
K
and
(b)
420
K.
The angle of
vapor deposition
a
is 45 '.
(From
Ref. 22).
index of refraction and absorption coefficient. Moisture-induced degradation
has plagued optical film development for many years.
A
promising remedy for
this problem
is
ion bombardment, which serves to compact the film structure.
This approach is discussed further in Chapters
3
and
11.
5.6.4.
Film
Density
A
reduced
film
density relative to the
bulk
density is not an unexpected
outcome of the zone structure of films and its associated porosity. Because of
the causal structure-density and structure-property relationships, density is
5.6.
Grain Structure
of
Films and Coatings
233
expected to strongly influence film properties. Indeed we have already alluded
to the deleterious effect of lowered overall film densities on optical and
mechanical properties.
A
similar degradation of film adhesion and chemical
stability as well as electrical and magnetic properties can also be expected.
Measurement of film density generally requires a simultaneous determination
of film mass per unit area and thickness. Among the experimental findings
related to film density are the following (Ref.
23):
1.
The density of both metal and dielectric films increases with thickness
and reaches a plateau value that asymptotically approaches that of the bulk
density. The plateau occurs at different thicknesses, depending on material
deposition method and conditions. In
Al,
for example, a density of
2.1
g/cm3
at 250 rises to 2.58 g/cm3 above
525
"C and then remains fairly constant
thereafter.
As
a reference, bulk
Al
has a density of 2.70 g/cm3. The gradient
in film density is thought to be due to several causes, such as higher crystalline
disorder, formation of oxides, greater trapping of vacancies and holes, pores
produced by gas incorporation, and special growth modes that predominate in
the early stages of film formation.
2. Metal films tend to be denser than dielectric films because of the larger
void content in the latter.
A
quantitative measure of the effect of voids on
density is the packing factor
P,
defined as
volume of solid
total volume of film (solid
+
voids)
'
P=
(5-44)
Typical values of
P
for metals are greater than
0.95,
whereas for fluoride
films (e.g., MgF,, CaF,)
P
values of approximately 0.7 are realized.
However, by raising
T,
for the latter, we can increase
P
to almost unity.
3.
Thin-film condensation is apparently accompanied by the incorporation
of large nonequilibrium concentrations of vacancies and micropores. Whereas
bulk metals may perhaps contain a vacancy concentration of at the
melting point, freshly formed thin films can have excess concentrations of
lo-'
at room temperature. In addition, microporosity on a scale much finer
than imagined in zones
1
and
T
has been detected by ?EM phase (defocus)
contrast techniques (Ref.
24).
Voids measuring
10
A
in size,
present in
densities
of
about
1017
cm-3 have been revealed in films prepared by
evaporation as shown in Fig. 5-18. The small voids appear as white dots
surrounded by black rings in the underfocused condition. Microporosity is
evident both at grain boundaries and in the grain interior of metal films. In
dielectrics a continuous network of microvoids appears to surround grain
234
Film Formation and Structure
Figure
5-1
8.
Transmission electron micrograph showing microvoid distribution in
evaporated Au
films.
(Courtesy
of
S.
Nakahara, AT&T Bell Laboratories.)
boundaries. This crack network has also been observed in Si and Ge films,
where closer examination has revealed that it is composed of interconnecting
cylindrical voids. Limited surface diffusion, micro-self-shadowing effects, and
stabilization by adsorbed impurities encourage the formation of microporosity
.
In addition to reducing film density, excess vacancies and microvoids may play
a role in fostering interdiffusion in thin-film couples where the Kirkendall
effect has been observed
(see
Chapter
8).
The natural tendency to decrease the
vacancy concentration through annihilation is manifested by such film changes
as stress relaxation, surface faceting, adhesion failure, recrystallization and
grain growth, formation of dislocation loops and stacking faults, and decrease
in hardness.
5.7.
AMORPHOUS
THIN
FILMS
5.7.1. Systems, Structures, and Transformations
Amorphous or glassy materials have a structure that exhibits only short-range
order
or
regions where a predictable placement of atoms occurs. However,
5.7.
Amorphous Thin Films
235
within a very few atom spacings, this order breaks down, and no long-range
correlation in the geometric positioning of atoms is preserved. Although bulk
amorphous materials such as silica glasses, slags, and polymers are well
known, amorphous metals were originally not thought to exist. An interesting
aspect
of
thin-film deposition techniques is that they facilitate the formation of
amorphous metal and semiconductor structures relative to bulk preparation
methods.
As noted, production of amorphous films requires very high deposition rates
and low substrate temperatures. The latter immobilizes or freezes adatoms on
the substrate where they impinge and prevents them from diffusing and seeking
out equilibrium lattice sites. By the mid-1950s Buckel (Ref.
25)
produced
amorphous films
of
pure metals such as Ga and Bi by thermal evaporation onto
substrates maintained at liquid helium temperatures. Alloy metal films proved
easier to deposit in amorphous form because each component effectively
inhibits the atomic mobility of the other. This meant that higher substrate
temperatures
(-
77
K)
could be tolerated and that vapor quench rates did not
have to be as high as those required to produce pure amorphous metal films.
Although they are virtually impossible to measure, vapor quench rates in
excess of
10
lo
"C/sec have been estimated. From laboratory curiosities,
amorphous Si, Se, GdCo, and GeSe thin films have been exploited for such
applications as solar cells, xerography, magnetic bubble memories, and high-
resolution optical lithography, respectively.
Important fruits of the early thin-film work were realized in the later
research and development activities surrounding the synthesis of
bulk
amor-
phous metals by quenching melts. Today continuously cast ribbon and strip of
metallic glasses (Metglas) are commercially produced for such applications as
soft
magnetic transformer cores and brazing materials. Cooling rates of
-
lo6
"C/sec are required to prevent appreciable rates of nucleation and growth of
crystals. Heat transfer limitations restrict the thickness of these metal glasses to
less than 0.1 mm. In addition to achieving the required quench rates, the alloy
compositions are critical. Most
of
the presently known glass-forming binary
alloys fall into one of four categories (Ref.
26):
1. Transition metals and 10-30 at% semimetals
2.
Noble metals (Au, Pd, Cu) and semimetals
3.
Early transition metals
(Zr,
Nb,
Ta, Ti) and late transition metals (Fe, Ni,
Co, Pd)
4.
Alloys consisting of IIA metals (Mg, Ca, Be)
In common, many of the actual glass compositions correspond to where
"deep" (low-temperature) eutectics are found on the phase diagram.
Amorphous thin films of some of these alloys as well as other metal alloys
236
Film Formation and Structure
and virtually all elemental and compound semiconductors, semimetals, oxides,
and chalcogenide @e.,
S-,
Se-, Te-containing) glasses have been prepared by a
variety of techniques. Amorphous Si films, for example, have been deposited
by evaporation, sputtering, and chemical vapor deposition techniques. In
addition, large doses of ion-implanted Ar or Si ions will amorphize surface
layers of crystalline Si. Even during ion implantation of conventional dopants,
local amorphous regions are created where the Si matrix is sufficiently
damaged, much to the detriment of device behavior. Lastly, pulsed laser
surface melting followed by rapid freezing has produced amorphous films in Si
as well as other materials
(see
Chapter
13).
5.7.2.
Au
-
Co
and
Ni
-
Zr Amorphous Films
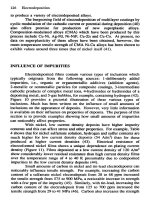
It is instructive to consider amorphous Co-30Au films since they have been
well characterized structurally and through resistivity measurements (Ref.
27).
The films were prepared by evaporation from independently heated Co and
Au
sources onto substrates maintained at 80
K.
Dark-field electron microscope
images and corresponding diffraction patterns are shown side by side in Fig.
5-19.
The as-deposited film is rather featureless with a smooth topography, and
the broad halos in the diffraction pattern cannot be easily and uniquely assigned
to the known lattice spacings of the crystalline alloy phases in this system. Both
pieces of evidence point
to
the existence of an amorphous phase whose
structural order does not extend beyond the next-nearest-neighbor distance.
The question of whether so-called amorphous films are in reality microcrys-
talline is not always easy
to
resolve. In this case, however, the subsequent
annealing behavior of these films was quite different from what is expected of
fine-grained crystalline films. Heating to
470
K
resulted in the face-centered
cubic diffraction pattern of a single metastable phase, whereas at
650
K,
lines
corresponding to the equilibrium Co and Au phases appeared. Resistivity
changes accompanying the heating of Co-38Au (an alloy similar to Co-30Au)
revealed a two-step transformation as shown in Fig.
5-20.
Beyond
420
K
there
is an irreversible change from the amorphous structure to a metastable FCC
crystalline phase, which subsequently decomposes into equilibrium phases
above
550
K.
The final two-phase structure is clearly seen in Fig.
5-19.
The
high resistivity
of
the amorphous films is due to the enhanced electron
scattering by the disordered solid solution. Crystallization to the FCC structure
reduces the resistivity, and phase separation, further still.
Both
the amorphous and metastable phases are stable over a limited tempera-
ture range in which the resistivity of each can be cycled reversibly. Once the
two-phase structure appears, it, of course, can never revert to less thermody-
5.7.
Amorphous
Thln
Films
237
Figure
5-1
9.
Electron micrographs and diffraction patterns of Co-30at%Au: (top) as
deposited at
80
K,
warmed to
300
K
(amorphous);
(middle)
film
warmed to
470
K
(single-phase FCC structure); (bottom)
film
heated
to
650
K
(two-phase equilibrium).
(From Ref.
27).
namically stable forms. This amorphous-crystalline transformation apparently
proceeds in a manner first suggested by Ostwald in
1897.
According
to
the
so-called Ostwald rule, a system undergoing a reaction proceeds from a less
stable to a final equilibrium state through
a
succession
of
intermediate
metastable states
of
increasing stability. In this sense, the amorphous phase is
akin to a quenched liquid phase. Quenched films exhibit other manifestations
of thermodynamic instability. One is increased atomic solubility in amorphous
238
Film Formation and Structure
50
I I
I
I
I
I
G1+38ot%A~
a
0
w
a:
10-
/-
*-
1.7~
10'8i.2anloK
dT-
I
I
I
I
1
100
200
300
400
500
600
700
TEMPERATURE
("K)
Figure
5-20.
Resistivity of a Co-38at%Au
film
as
a
function of annealing tempera-
ture. Reversible values of
dp/dT
in various structural states of the
film
are shown
together with changes in
p
during phase transformation.
(From
Ref.
27).
or single-phase metastable matrices. For example, the equilibrium phase
diagram for Ag-Cu is that of a simple eutectic with relatively pure terminal
phases of Ag and Cu that dissolve less than
0.4
at% Cu and
0.1
at% Ag,
respectively, at room temperature. These limits can be extended to
35
at% on
both sides by vapor-quenching the alloy vapor. Similar solubility increases
have been observed in the Cu-Mg, Au-Co, Cu-Fe, Co-Cu, and Au-Si alloy
systems.
Confounding the notion that rapid quenching of liquids or vapors is required
to produce amorphous alloy films is the startling finding that they can also be
formed by solid-state reaction. Consider Fig.
5-21,
which shows the result
of
annealing a bilayer couple consisting of pure polycrystalline
Ni
and Zr films at
300°C for
4
h. The phase diagram predicts negligible mutual solid solubility
and extensive intermetallic compound formation; surprisingly, an amorphous
NiZr alloy film is observed to form. Clearly, equilibrium compound phases
have been bypassed in favor of amorphous phase nucleation and growth, as
kinetic considerations dominate the transformation. The effect,
also
observed
in Rh-Si, Si-Ti, Au-La, and Co-Zr systems, is not well understood.
Apparently the initial bilayer film passes to the metastable amorphous state via
a lower energy barrier than that required to nucleate stable crystalline com-
pounds. However, the driving force for either transformation is similar. Unlike
other amorphous films, extensive interdiffusion can be tolerated
in
NiZr
without triggering crystallization.
5.7.
Amorphous Thin Films
239
Zr
Figure
5-21.
Cross-sectional electron micrograph of
an
amorphous Ni-Zr alloy
film
formed by annealing a crystalline bilayer film of Ni
and
Zr at
300
“C for
4
hours.
(Courtesy of
K.
N. Tu,
IBM
Corp.,
T.
J.
Watson Research Lab.,
from
Ref.
28).
5.7.3.
A
Model To Simulate Structural Effects in Thin Films
One of the outcomes of their research on quenched alloy films was an engaging
mechanical model Mader and Nowick (Ref.
29)
developed to better explain the
experimental results. Many phenomena observed in pure and alloy thin-film
structures are qualitatively simulated by this model. For this reason, it is
valuable as
a
pedogogic tool and worth presenting here. The “atoms” compos-
ing the thin films were acrylic plastic balls of different sizes. They were rolled
down a pinball-like runway tilted at
1.5”
to the horizontal to simulate the
random collision of evaporant atoms.
A
monolayer of these atoms was then
“deposited” on either an “amorphous” or “crystalline” substrate. The
former was a flat sheet of plastic, and the latter contained a perfect two-dimen-
sional periodic array of interstices into which atoms could nest. Provision was
made to alter the alloy composition by varying the ball feed.
A
magnetic
240
Film Formation and Structure
vibrator simulated thermal annealing.
To
obtain diffraction patterns from the
arrays, they prepared reduced negatives (with
an
array size of about
4
mm
square). The balls appeared transparent on a dark background with a mean ball
separation of
-
0.13 mm.
Fraunhofer optical diffraction patterns were gener-
ated by shining light from a He-Ne laser
(A
=
6328
A)
on the negative
mounted in contact with a
135-mm
lens of a
35-mm
camera. The resulting
photographs are reproduced here.
a
b
Figure
5-22.
Atomic sphere film structures and corresponding Fraunhofer diffraction
patterns for (a) perfect array,
(b)
stacking fault, (c) pure
film;
low deposition rate,
(d)
pure film;
high
deposition rate. (Reprinted with permission from the
IF3M
Corp.,
from
A.
S.
Nowick
and
S.
R.
Mader,
IBM
J.
Res.
Dev.
9,
358,
1965).
5.7.
Amorphous Thin Films
241
C
Figure
5-22.
d
Continued.
The perfect array of spheres of one size is shown together with the
corresponding diffraction pattern in Fig. 5-22a. A hexagonal pattern of sharp
spots, very reminiscent of electron diffraction patterns of single-crystal films,
is obtained, reflecting the symmetry of
the
close-packed array. After creation
of a stacking fault in the structure, the diffraction pattern shows streaks (Fig.
5-22b). These run perpendicular to the direction of
the
fault in the structure.
The effect of deposition rate is shown in Figs. 5-22c and 5-22d. When the
film is deposited “slowly,” there
are
grains, vacancies, and stacking faults
present in the array. Relative to Fig. 5-22a, the diffraction spots are broad-
ened, a precurser to ring formation. In Fig. 5-22d, the film is deposited at a
“high” rate and the grain structure is considerably finer and more disordered
with numerous point defects, voids, and grain boundaries present. Now,
242
Film Formation and Structure
semicontinuous diffraction rings appear, which
are
very much like the common
X-ray Debye-Scherer rings characteristic
of
polycrystals. Interestingly,
the
intensity variation around the ring
is
indicative
of
preferred orientation. When
the rapidly deposited films
are
annealed through vibration, the array densifies,
vacancies
are
annihilated, faults
are
eliminated,
and grains reorient, coalesce,
and grow. The larger
grains
mean a return to
the
spotted diffraction pattern.
a
b
Figure
5-23.
Atomic sphere
film
structure
for
concentrated alloy (50A-S0B,
27%
size difference:
(a)
as-deposited (amorphous);
@)
vibration annealed. (Reprinted
with
permission
from
the
IBM
Corp.,
from
A.
S.
Nowick and
S.
R.
Mader,
IBM
J.
Res.
Do.
9,
358,
1965).
Exercises
243
We now turn our attention to alloy films.
For
“concentrated” alloys
containing equal numbers of large and small spheres with a size difference of
27%, the as-deposited structure is amorphous, as indicated in Fig. 5-23 The
diffraction pattern contains broad halos. Upon vibration annealing, the film
densifies slightly, but the atomic logjam cannot be broken up. There is no
appreciable change in its structure or diffraction pattern-it is still amorphous.
For less concentrated alloys
(-
17%), however, the as-deposited structure
is
very fine grained but apparently crystalline.
All of the foregoing results were for films deposited on the smooth sub-
strate. The “crystalline substrate” affords the opportunity to model epitaxy
phenomena. Pure films deposit in almost perfect alignment with the substrate
when deposited slowly. Imperfect regions are readily eliminated upon anneal-
ing and nearly perfect single crystals are obtained. Rapidly deposited films are
less influenced by the underlying substrate and remain polycrystalline after
annealing. Clearly epitaxial growth is favored by low deposition rates. The
presence of alloying elements impeded epitaxy from occurring in accord with
experience.
The foregoing represents a sampling of the simulations
of
the dependence of
film structure on deposition variables. Readers interested in this as well as
other mechanical models of planar arrays of atoms, such as the celebrated
Bragg bubble raft model (Ref.
30),
should consult the literature on the subject.
Much
insight can be gained from them.
1.
Under the same gas-phase supersaturation, cube-shaped nuclei are ob-
served to form homogeneously in the gas and heterogeneously both on a
flat substrate surface and at right-angle steps on
this
surface. For each
of
these three sites calculate the critical nucleus size and energy barrier for
nucleation.
2.
A
cylindrical pill-like cluster of radius
r
nucleates on a dislocation that
emerges from the substrate. The free-energy change per unit thickness is
given
by
AG
=
ar2
AGv
+
27ryr
+
A
-
B
In
r,
where
A
-
B
In
r
represents the dislocation energy within the cluster.
a. Sketch
AG
vs.
r
(note at
r
=
0,
AG
=
a).
b. Determine the value
of
r*.
244
Film Formation and Structure
c. Show that when
AG,B/ry'
>
1/2,
AG
monotonically decreases
with
r,
but when AG,B/ry'
<
1/2
there is a turnaround in the
curve. (The latter case corresponds to a metastable state and associ-
ated energy barrier.)
3.
Cap-shaped nuclei on substrates grow both by direct impingement of
atoms from the vapor phase as well as by attachment of adatoms diffusing
across the substrate surface.
a. In qualitative terms how will the ratio of the two mass fluxes depend
b. Write
a
quantitative expression for the flux ratio, making any reason-
on nucleus size, area density of nuclei, and deposition rate.
able assumptions you wish.
4.
Two spherical nuclei with surface energy
y
having radii
r,
and
r2
coalesce in the gas phase to form one spherical nucleus. If mass is
conserved, calculate the energy reduction in the process. Suppose two
spherical
caps
of different radii coalesce on a planar substrate
to
form
one cap-shaped nucleus. Calculate the energy reduction.
5.
Two spherical nuclei of radii
rl
and
rz
are separated by a distance
I.
If
rl
9
r2,
derive an expression for the time it will take for the smaller
nucleus to disappear by sequential atomic dissolution and diffusion
to
the
larger nucleus by Ostwald ripening. Assume the diffusivity
of
atoms on
the surface is
D,
.
Make simplifying assumptions as you see fit.
6.
Assume that the two nuclei in Fig. 5-10 coalesce by a sintering mecha-
nism.
a. By carefully measuring the neck width and plotting it as a function of
time, determine the value of
n
in the general sintering kinetics
formula.
b. From these data, estimate a value for the approximate diffusivity.
Assume
y
=
loo0
ergs/cmz,
T
=
400
"C,
and
Q
=
17
x
cm3 /atom.
7.
A film is deposited
on
a substrate by means of evaporation. In the
expression for the rate
of
heterogeneous nucleation
(Eq.
5-17), identify
which terms are primarily affected by
a. raising the temperature
of
the evaporant source.
b. changing the substrate material.
c. doubling the source-substrate distance.
Exercises
245
d. raising the substrate temperature.
e. improving the system vacuum.
In each case qualitatively describe the nature of the change.
8.
From data shown in Fig.
5-5
calculate values for
Edes, E,,
and
El,.
(For
9.
Three different methods for estimating the temperature for epitaxial
answers consult Ref.
3,
page
8-23.)
growth of films have been discussed in this chapter.
a. Comment on the similarities and differences in the respective ap-
b. How well do they predict the experimental findings of Fig.
5-4?
1
0.
Derive expressions for the epitaxial transition temperatures
T,
-
proaches.
and
T2-3.
11.
During examination of the grain structure of a film evaporated from a
point source onto a large planar substrate, the following observations
were made as a function of position:
1.
There is a film thickness variation.
2.
There is a grain size variation.
3.
There is a variation in the angular tilt of columnar grains.
Explain the physical reasons for these observations.
12.
The formation of three-dimensional crystallites from an amorphous matrix
undergoing transformation by
nucleation
and
growth
processes follows
the time
(t)
dependent kinetics given by
7rNu3t4
f(t)
=
1
-
exp
-
N
is the nucleation rate
of
crystallites (per unit volume),
u
is their growth
velocity, and
f
is the fractional extent of transformation.
a.
N
is small near the critical transformation temperature and at low
b.
u
is usually larger for higher temperatures. Why?
c. Schematically sketch f(t) vs.
t
(or In
t)
at a series of temperatures.
Note that an incubation time dependent on temperature is suggested.
13.
a. Atoms on either side of a curved grain boundary (GB) reside on
surfaces of different curvature, establishing a local chemical potential
gradient that will drive GB migration. Use the Nernst-Einstein equa-
tion to show that the grain size will tend to grow with parabolic
kinetics.
3
temperature, but larger in between. Why?
246
Film Formation and Structure
b. Part (a) is valid when the film grain size is smaller than the film
thickness. Why?
If
the reverse is true, suggest why parabolic growth
kinetics may not be observed.
REFERENCES
l.*
B.
Lewis and J. C. Anderson,
Nucleation and Growth of Thin Films,
2.*
R. W. Vook,
Int. Metals Rev.
27,
209 (1982).
3.*
C. A. Neugebauer, in
Handbook of Thin-Film Technology,
eds.
L.
I.
4.*
K.
Reichelt,
Vacuum
38,
1083 (1988).
5.*
J.
A.
Venables, G.
D.
T. Spiller, and
M.
Hanbucken,
Rep. Prog. Phys.
47,
399 (1984).
6.
D.
Walton, T. N. Rhodin, and R.
W.
Rollins,
J.
Chem. Phys.
38,
2698
(1963).
7.
H. M. Yang and C. P. Flynn,
Phys. Rev. Lett.
62,
2476 (1989).
8.
V. N.
E.
Robinson and J. L. Robins,
Thin Solid Films
20,
155 (1974).
9.
R.
M.
German,
Powder Metallurgy Science,
Metal Powder Industries
Federation, Princeton, NJ
(1984).
10.
D.
W.
Pashley and M. J. Stowell,
J.
Vac. Sci. Tech.
3,
156 (1966).
11.
D.
Kashchiev,
Surface Science
86,
14 (1979).
12.
K.
L. Chopra,
Thin-Film Phenomena,
McGraw-Hill, New York
(1969).
13.
G.
E.
Rhead,
J.
Vac.
Sci.
Tech.
13,
603 (1976).
14.
R. W. Vook and
B.
Oral,
Gold Bull.
20,
(1/2), 13 (1987).
15.
E.
Grunbaum, in
Epitaxial Growth B,
ed. J. W. Matthews,
Academic
Press,
New York
(1976).
16.
B.
A,
Movchan and A. V. Demchishin,
Phys. Met. Metallogr.
28,
83
(1969).
17.
J. A. Thornton,
Ann.
Rev. Mater. Sci.
7,
239 (1977).
18.
H.
T.
G. Hentzell, C. R. M. Grovenor, and
D.
A. Smith,
J.
Vac. Sci.
Tech.
A2,
218 (1984).
19.
M. F. Chisholm and
D.
A.
Smith, in
Advanced Techniques
for
Microstructural Characterization,
eds. R. Krishnan, T. R. Ananthara-
man, C.
S.
Pande, and
0.
P. Arora, Trans-Tech. Publ. Switzerland
(1988).
Academic Press, London
(1978).
Maissel and
R.
Glang, McGraw Hill, New York
(1970).
*Recornmended
texts
or
reviews.
References
247
20.
21.
22.
23.
24.
25.
26.
27.
28.
29.
30,
J.
M. Nieuwenhuizen and H. B. Haanstra,
Philips Tech. Rev.
27,
87
(1966).
R.
Messier, A.
P.
Giri, and
R.
Roy,
J.
Vac. Sei. Tech.
A2,
500 (1984).
K.
H.
Muller,
J.
Appl. Phys.
58,
2573 (1985).
H.
Pulker,
Coatings
on
Glass,
Elsevier, Amsterdam
(1984).
S.
Nakahara,
Thin
Sold
Films
64,
149 (1979).
W.
Buckel,
Z.
Phys.
138,
136 (1954).
H.
S.
Chen,
H.
J.
Leamy, andC.
E.
Miller,
Ann. Rev. Mater. Sci.
10,
363 (1980).
S.
Mader, in
The Use
of
Thin Films in Physical Investigations,
ed.
J.
C. Anderson, Academic Press, New York
(1966).
S.
B. Newcomb and
K.
N. Tu,
Appl. Phys. Lett.
48,
1436 (1986).
A.
S.
Nowick and
S.
R.
Mader,
IBM
J.
Res. Dev.
9,
358 (1965).
W.
L.
Bragg and
J.
F.
Nye,
Proc. Roy.
SOC.
A190,
474 (1947).
Chapter
6
1
Characterization
of
Thin Films
6.1.
INTRODUCTION
Scientific disciplines are identified and differentiated by the experimental
equipment and measurement techniques they employ. The same is true of
thin-film science and technology. For the first half of this century, interest in
thin films centered around optical applications. The role played by films was
largely a utilitarian one, necessitating measurement of film thickness and
optical properties. However, with the explosive growth of thin-film utilization
in microelectronics, there was an important need to understand the intrinsic
nature
of
films. With the increasingly interdisciplinary nature of applications,
new demands for film characterization and other property measurements arose.
It was this necessity that drove the creativity and inventiveness that culminated
in the development
of
an
impressive array of commercial analytical instru-
ments. These are now ubiquitous in the thin-film, coating, and broader
scientific communities. In many instances, it was a question
of
borrowing and
modifying existing techniques employed in the study of bulk materials (e.g.,
X-ray diffraction, microscopy, mechanical testing) to thin-film applications. In
other cases well-known physical phenomena (e.g., electron spectroscopy,
nuclear scattering, mass spectroscopy) were exploited.
A
partial list
of
the
Table
6-1.
Analytical Techniques Employed in Thin-Film Science and
Technology
Primary Beam Energy Range Secondary Signal Acronym Technique Application
Ion
Electron 20-200 eV
300-30,OOO eV
1 keV-30 keV
500
eV- 10 keV
100-400 keV
100-400
keV
100-400 keV
0.5
-2.0 keV
1-15 keV
1-15 eV
1
keV and up
5-20 keV
>
1 MeV
Photon
>
1 keV
>
1 keV
>
1 keV
Laser
Laser
Electron
Electron
X-ray
Electron
Electron
Electron, X-ray
Electron
Ion
Ion
Atoms
X-ray
Electron
Ion
X-ray
X-ray
Electron
Ions
Light
LEED
SEM
EMP (EDX)
AES
TEM
STEM
EELS
ISS
SIMS
SNMS
PIXE
SIM
RBS
XRF
XRD
ESCA, XPS
LEM
-
Low-energy electron diffraction
Scanning electron microscopy
Electron microprobe
Auger electron spectroscopy
Transmission electron microscopy
Scanning TEM
Electron energy
loss
spectroscopy
Ion-scattering spectroscopy
Secondary ion mass spectroscopy
Secondary neutral mass spectrometery
Particle-induced X-ray emission
Scanning ion microscopy
Rutherford backscattering
X-ray fluorescence
X-ray diffraction
X-ray photoelectron spectroscopy
Laser microprobe
Laser emission microprobe
Surface structure
Surface morphology
Surface region composition
Surface layer composition
High-resolution structure
Imaging, X-ray analysis
Local small area composition
Surface Composition
Trace composition
vs.
depth
Trace composition
vs.
depth
Trace composition
Surface characterization
Composition
vs.
depth
Composition
(pm
depth)
Crystal structure
Surface composition
Composition
of
irradiated area
Trace element analysis
~
From
Ref.
1.
P
6.1.
Introduction
251
modern techniques employed in the characterization of electronic thin-film
materials and devices is given in Table
6-1.
Among their characteristics are the
unprecedented structural resolution and chemical analysis capabilities over
small lateral and depth dimensions. Some techniques only sense and provide
information on the first few atom layers of the surface. Others probe more
deeply, but in no case are depths much beyond a few microns accessible for
analysis. Virtually all of these techniques require a high or ultrahigh vacuum
ambient. Some are nondestructive, others are not.
In
common, they all utilize
incident electron, ion,
or
photon beams. These interact with the surface and
excite it in such a way that some combination of secondary beams of electrons,
ions,
or
photons are emitted, carrying off valuable structural and chemical
information in the process.
A
rich collection of acronyms has emerged to
differentiate the various techniques. These abbreviations are now widely
employed in the thin-film and surface science literature.
General testing and analysis of thin films is carried out with equipment and
instruments which are wonderfully diverse in character. For example, consider
the following extremes in their attributes:
1. Size-This varies from a portable desktop interferometer to the
504
long
accelerator and beam line of a Rutherford backscattering
(RBS)
facility.
2.
Cost-This ranges from the modest cost of test instruments required to
measure electrical resistance of films to the approximate $1 million price
tag of a commercial
SIMS
spectrometer.
3. Operating Environment-This varies from the ambient in the measure-
ment of film thickness to the 10-"-torr vacuum required for the measure-
ment of film surface composition.
4.
Sophistication-At one extreme is the manual scotch-tape film peel test for
adhesion, and at the other is an assortment of electron microscopes and
surface analytical equipment where operation and data gathering, analysis,
and display are essentially computer-controlled.
What is remarkable is that films can be characterized structurally, chemi-
cally, and with respect to various properties with almost the same ease and
precision that we associate with bulk measurement. This despite the fact that
there are many orders of magnitude fewer atoms available in films.
To
appreciate this, consider AES analysis of a Si wafer surface layer containing 1
at% of an impurity. Only the top 10-
15
isosampled, and since state-of-the-art
systems have a lateral resolution of
500
6,
the total measurement volume
corresponds to
(~/4)(500)~(15)
=
3
x
106
A3. In Si this corresponds to about
150,000
matrix atoms, and therefore only
1500
impurity atoms are detected in
the analysis! Such measurements pose challenges in handling and experimental
techniques, but the problems are usually not insurmountable.
252
Characterization
of
Thin Films
This chapter will only address the experimental techniques and applications
associated with determination
of
1.
Film thickness
2.
Film morphology and structure
3.
Film composition
These represent the common core
of
information required of all films and
coatings irrespective of ultimate application. Within each of these three cate-
gories, only the most important techniques will be discussed. Beyond these
broad characteristics there are a host
of
individual properties (e.g., hardness,
adhesion, stress, electrical conductivity, reflectivity, etc.), that are specific to
the particular application. The associated measurement techniques will there-
fore be addressed in the appropriate context throughout the book.
6.2.
FILM
THICKNESS
6.2.1. introduction
The thickness
of
a film is among the first quoted attributes of its nature. The
reason is that thin-film properties and behavior depend on thickness. Histori-
cally, the use
of
films in optical applications spurred the development
of
techniques capable
of
measuring film thicknesses with high accuracy. In
contrast, other important fdm attributes, such as structure and chemical
composition, were only characterized in the most rudimentary way until
relatively recently. In some applications, the actual film thickness, within
broad limits,
is
not particularly crucial to function. Decorative, metallurgical,
and protective films and coatings are examples where this is
so.
On the other
hand, microelectronic applications generally require the maintenance of precise
and reproducible film thicknesses as well as lateral dimensions. Even more
stringent thickness requirements must be adhered to in optical applications,
particularly in multilayer coatings.
The varied types
of
films and their uses have generated a multitude of ways
to measure
film
thickness.
A
list
of
methods mentioned in this chapter
is
given
in Table
6-2
together with typical measurement ranges and accuracies. In-
cluded are destructive and nondestructive methods. The overwhelming major-
ity are applicable to films that have been prepared and removed from the
deposition chamber. Only a few are suitable for real-time monitoring of film
thickness during growth. We start with optical techniques, a subject that
is
covered extensively in virtually every book and reference on thin films
(Refs.
2-4).