The Materials Science of Thin Films 2011 Part 8 pps
Bạn đang xem bản rút gọn của tài liệu. Xem và tải ngay bản đầy đủ của tài liệu tại đây (1.86 MB, 50 trang )
w
N
Q)
7-15.
of
P.
K.
Tien, AT&T
Bell
Laboratories.)
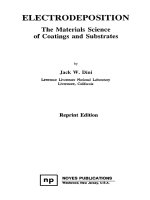
Energy gaps and corresponding lattice constants for various compound semiconductors. (Courtesy
m
m
z.
X
Y
7.4.
Epitaxy
of
Compound Semiconductors
329
Figure
7-1
6.
Electron microscope lattice image of
GaAs-AAs
heterojunction
taken
with
[lo01
illumination. (From
Ref.
13).
(Courtesy of
JOEL
USA,
Inc.)
Therefore, the correct value for
EJO.4)
=
2.00
eV. In addition, the index of
refraction
n,
required for light-guiding properties, varies as (Ref.
15)
.(x)
=
3.590
-
0.710~
+
0.091~~.
(7-12)
In summary, it is possible to design ternary alloys with
Eg
larger than GaAs,
with
n
smaller than GaAs, while maintaining an acceptable lattice match for
high-quality heterojunctions. This unique combination
of
properties has led to
the development of a family
of
injection lasers, light-emitting diodes, and
photodetectors based on the GaAs- AlAs system.
7.4.3.
Additional Applications
7.4.3.1.
Optical Communications.
Optical communication systems are
used to transmit information optically. This is done by converting the initial
electronic signals into light pulses using laser
or
light-emitting diode light
sources. The light is launched at one end
of
an optical fiber that may extend
over long distances (e.g.,
40
km).
At the other end
of
the system, the light
pulses are detected by photodiodes
or
phototransistors and converted back into
electronic signals that, in telephone applications, finally generate sound. In
such a system it is crucial to transmit the light with minimum attenuation
or
low
optical loss. Great efforts have been made to use the lowest-loss fiber
possible and minimize loss at the source and detector ends. If optical losses are
high, it means that the optical signals must be reamplified and that additional,
330
Epitaxy
costly repeater stations will be necessary. The magnitude of the problem can be
appreciated when transoceanic communications systems are involved. In
silica-based fibers it has been found that minimum transmission losses occur
with light of approximately 1.3-1.5 pm wavelength. The necessity to operate
within this infrared wavelength window bears directly on the choice of suitable
semiconductors and epitaxial deposition technology required to fabricate the
required sources and detectors.
Reference to Table 7-1 shows that InP is transparent to 1.3-pm light, and
this simplifies the coupling of fibers to devices. A very close lattice match to
InP
(a,
=
5.869
A)
can
be
effected by alloying GaAs and InAs. Through the
use of Vegard’s law, it is easily shown that the necessary composition is
Ga,,,,In,,,, As. In the same vein, high-performance lasers based on the
lattice-matched GaInAsP-InP system have recently emerged for optical com-
munications use.
7.4.3.2.
Silicon Heteroepitaxy (Ref.
8).
Since the early 1960s, Si has been
the semiconductor of choice. Its dominance cannot, however, be attributed
solely
to
its electronic properties for it has mediocre carrier mobilities and only
average breakdown voltage and carrier saturation velocities. The absence of a
direct band gap rules out light emission and severely limits its efficiency as a
photodetector. Silicon does, however, possess excellent mechanical and chemi-
cal properties. The high modulus of elasticity and high hardness enable Si
wafers to withstand the rigors of handling and device processing. Its great
natural abundance, the ability to readily purify it and the fact that it possesses a
highly inert and passivating oxide have all helped to secure the dominant role
for Si in solid-state technology. Nevertheless,
Si
is being increasingly sup-
planted in high-speed and optical applications by compound semiconductors.
The idea of combining semiconductors that can be epitaxially grown on
low-cost Si wafers is very attractive. Monolithic integration of
III-V
devices
with Si-integrated circuits offers the advantages of higher-speed signal process-
ing distributed over larger substrate areas. Furthermore, Si wafers are more
robust and dissipate heat more rapidly than GaAs wafers. Unfortunately, there
are severe crystallographic, as well as chemical compatibility problems that
limit Si-based heteroepitaxy. From data in Table 7-1, it is evident that Si is
only closely lattice matched to GaP and ZnS. Furthermore, its small lattice
constant limits the possible epitaxial matching to semiconductor alloys. Never-
theless, high-quality, lattice-mismatched (strained-layer) heterostructures
of
AlGaAs-Si and Ge,Si,-,-Si have been prepared and show much promise for
new device applications.
7.5.
Methods
for
Depositing Epitaxial Semiconductor Films
331
7.4.3.3.
Epitaxy in
Il-VI
Compounds
(Ref.
16).
Semiconductors based on
elements from the second (e.g., Cd, Zn, Hg) and sixth (e.g.,
S,
Se, Te)
columns of the periodic table display a rich array of potentially exploitable
properties. They have direct energy band gaps ranging from a fraction of an
electron volt in Hg compounds to over
3.5
eV in ZnS, and low-temperature
carrier mobilities approaching
lo6
cm2 /V-sec are available. Interest in the
wide-gap 11-VI compounds has been stimulated by the need for electronically
addressable flat-panel display devices and for the development of LED and
injection lasers operating in the blue portion of the visible spectrum. For these
purposes, ZnSe and ZnS have long been the favored candidates. When the
group I1 element is substituted by a magnetic transition ion such as Mn, new
classes of materials known
as
diluted magnetic or semimagnetic semiconduc-
tors result. Examples are Cd(Mn)Te or Zn(Mn)Se, and these largely retain the
semiconducting properties of the pure compound. But the five electrons in the
unfilled 3d shell of Mn give rise to localized magnetic moments. As a result,
large magneto-optical effects (e.g., Zeeman splitting in magnetic fields, Fara-
day rotation, etc.) occur and have been exploited in optical isolator devices.
For this, as well as other potential applications in integrated optics, high-qual-
ity epitaxial films are essential.
7.5.
METHODS
FOR
DEPOSITING EPITAXIAL
SEMICONDUCTOR
FILMS
7.5.1.
Liquid Phase Epitaxy
In this section an account of the processes used to deposit epitaxial semicon-
ductor films is given. We start with LPE, a process in which melts rather than
vapors are in contact with the growing films. Introduced in the early 1960s,
LPE is still used to produce heterojunction devices. However, for greater layer
uniformity and atomic abruptness, it has been supplanted by CVD and MBE
techniques. LPE involves the precipitation of a crystalline film from a super-
saturated melt onto the parent substrate, which serves as both the template for
epitaxy and the physical support for the heterostructure. The process can be
understood by referring to the
GaAs
binary-phase diagram
on
p.
31.
Consider
a Ga-rich melt containing
10
at% As. When heated above 95OoC, all of the
As
dissolves. If the melt is cooled below the liquidus temperature into the
two-phase field, it becomes supersaturated with respect to As. Only a melt of
lower than the original As content can now be in equilibrium with GaAs. The
excess As is, therefore, rejected from solution in the form
of
GaAs that grows
epitaxially on a suitably placed substrate. Many readers will appreciate that the
332
Epitaxy
crystals they grew as children from supersaturated aqueous solutions essen-
tially formed by this mechanism.
Through control of the cooling rates, different kinetics of layer growth
apply. For example, the melt temperature can either
be
lowered continuously
together with the substrate (equilibrium cooling) or separately reduced some
5-20
"C and then brought into contact with the substrate at the lower
temperature (step cooling). Theory backed by experiment has demonstrated
that the epitaxial layer thickness increases with time as
t3/2
for equilibrium
cooling and as
t1/2
for step cooling (Ref.
10).
Correspondingly, the growth
rates or time derivatives vary as
t1l2
and
t-'/*,
respectively. These diffusion-
controlled kinetics respectively indicate either an increasing or decreasing film
growth rate with time depending on mechanism. Typical growth rates range
from
-
0.1
to
1
pm/min.
A
detailed analysis of
LPE
is extremely compli-
cated in ternary systems because it requires knowledge of the thermodynamic
equilibria between solid and solutions, nucleation and interface attachment
FUSED -SILICA
FURNACE TUBE
ROWTH SEED
RELATIVE
POSITION
TI
ME
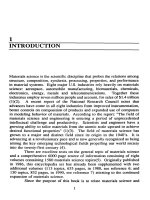
Figure
7-17.
Schematic
of
LPE reactor.
(Courtesy
of
M.
B. Panish, AT&T Bell
Laboratories.)
7.5.
Methods
for
Depositing Epitaxial Semiconductor Films
333
kinetics, solute partitioning, diffusion, and heat transfer. LPE offers several
advantages over other epitaxial deposition methods, including low-cost appara-
tus capable of yielding
films
of controlled composition and thickness, with
lower dislocation densities than the parent substrates.
To grow multiple GaAs- AlGaAs heterostructures, one translates the seed
substrate sequentially past a series of crucibles holding melts containing
various amounts of Ga and As together with such dopants as Zn, Ge, Sn, and
Se as shown in Fig.
7-17.
Each film grown requires a separate melt. Growth is
typically carried out at temperatures of
-
800
"C with maximum cooling rates
of a few degrees Celsius per minute. Limitations of LPE growth include poor
thickness uniformity and rough surface morphology particularly in thin layers.
The CVD and MBE techniques are distinctly superior to LPE in these regards.
7.5.2.
Seeded Lateral Epitaxial
Film
Growth over Insulators
The methods we describe here briefly have been successfully implemented in
Si but not in GaAs or other compound semiconductors. The use of melts
suggests the inclusion of this subject at this point. Technological needs for
three-dimensional VLSI and isolation of high-voltage devices have spurred the
development of techniques to grow epitaxial Si layers over such insulators as
SiO, or sapphire. In the recently proposed LEG0 (lateral epitaxial growth
over oxide) process (Ref.
17),
the intent is to form isolated tubs of high-quality
Si surrounded on all sides by a moat of SiO,. Devices fabricated within the
tubs require the electrical insulation provided by the SO,.
As
a result they are
also radiation-hardened
or
immune from radiation-induced charge effects
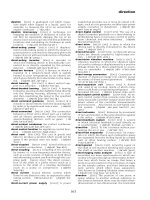
originating in the underlying bulk substrate. The process shown schematically
in Fig.
7-18
starts with patterning and masking a Si wafer to define the tub
regions followed by etching of deep-slanted wall troughs.
A
thick SiO, film is
grown and seed windows are opened down to the substrate by etching away the
SiO,
.
Then a thick polycrystalline Si layer
(-
100
pm thick) is deposited by
CVD methods. This surface layer is melted by the unidirectional radiant heat
flux from incoherent light emitted by tungsten halogen arc lamps (lamp
furnace). The underlying wafer protected by the thermally insulating SiO, film
does not melt except in
the
seed windows. Crystalline Si nucleates at each
seed, grows vertically, and then laterally across the SO,, leaving a single-
crystal layer in its wake upon solidification. Lastly, mechanical grinding and
lapping of the solidified layer prepares the structure for further microdevice
processing. Conventional dielectric isolation processing also employs a thick
CVD Si layer. But the latter merely serves as the mechanical handle enabling
the bulk of the Si wafer to be ground away.
334
Epitaxy
V-GROOVE
FORMATION
OXIDATION
TUBS
DEFINED
BY
KOH
ETCHING
ISOLATION OXIDE
AND SEEDING
WINDOWS FORMED
POLY-Si
&
Si0
CAP DEPOSITED
POLY-SI MELTED
&
RECRYSTALLIZED
1
SURFACE
POLISHED
Figure
7-1
8.
Schematics
of
methods
employed
to
isolate single-crystal
Si
tubs. (left)
conventional dielectric isolation process;
(right)
LEG0
process. (Courtesy
of
G.
K.
Celler,
AT&T
Bell
Laboratories.)
An alternative process for broad-area lateral epitaxial growth over SiO,
employs a strip heat source in the form of a hot graphite
or
tungsten wire,
scanned laser,
or
electron
beam.
After patterning
the
exposed polycrystalline
or amorphous Si above the surrounding oxide, the strip sweeps laterally across
the wafer surface. Local zones of the surface then successively melt and
recrystallize to yield, under ideal conditions, one large epitaxial
Si
film layer.
Analogous processes involving
seeded
lateral
growth
and selective deposition
from
the vapor phase also show much promise.
7.5.3.
Vapor Phase Epitaxy (VPE)
An account of the most widely used VPE methods-chloride, hydride, and
organometallic CVD processes-has been given in Chapter
4.
Here we briefly
address a couple of novel VPE concepts that have emerged in recent years.
The first is
known
as vapor levitation epitaxy (VLE), and the geometry
is
shown in Fig.
7-19.
The heated substrate is levitated above a nitrogen track
close to a porous frit through which the hot gaseous reactants pass. Upon
impingement on the substrate, chemical reactions and film deposition occur
while product gases escape into the effluent stream. As a function of radial
distance from the center of the circular substrate, the gas velocity increases
7.5.
Methods
for
Deposlting Epltaxial Semiconductor Films
335
VLE
GEOMETRY
EFFLUENT
/STY
NITROGEN
GROWTH
CHAMBER
Figure
7-19.
(Top) Schematic
of
VLE process;
(bottom)
schematic
of
RTCVD
process. (Courtesy
of
M.
L.
Green, AT&T Bell Laboratories.)
while the gas concentration profile exhibits depletion. These effects cancel one
another, and uniform films are deposited. The
VLE
process was designed for
the growth of epitaxial
III-V
semiconductor films and has certain advantages
worth noting:
1.
There is no physical contact between substrate and reactor.
2.
Thin layer growth
is
possible.
3.
Sharp transitions can be produced between film layers of multilayer stacks.
4.
Commercial scale-up appears to be feasible.
336
Epitaxy
The second method, known as rapid thermal CVD processing (RTCVD), is
an elaboration on conventional VPE. Epitaxial deposition is influenced through
rapid,
controlled variations of substrate temperature. Source gases (e.g.,
halides, hydrides, metalorganics) react on low-thermal-mass substrates heated
by the radiation from external high-intensity lamps (Fig. 7-19). The latter
enable rapid temperature excursions, and heating rates of hundreds of degrees
Celsius per second are possible. For III-V semiconductors, high-quality epitax-
ial films have been deposited by first desorbing substrate impurities at elevated
temperatures followed by immediate lower temperature growth (Ref. 18).
Very high quality lattice-matched heteroepitaxial films can
be
grown by
CVD methods. This is particularly true
of
OMVPE techniques where atomi-
cally abrupt heterojunction interfaces have been demonstrated in alternating
AlAs-GaAs (superlattice) structures. Only molecular-beam epitaxy, which is
considered next, can match or exceed these capabilities.
7.5.4.
Molecular-Beam Epitaxy (Refs.
19
-
21)
Molecular-beam epitaxy is conceptually a rather simple single-crystal film
growth technique that, however, represents the state-of-the-art attainable in
deposition processing from the vapor phase. It essentially involves highly
controlled evaporation in an ultrahigh-vacuum
(
-
lo-''
torr) system. Interac-
tion of one or more evaporated beams of atoms or molecules with the
single-crystal substrate yields the desired epitaxial film. The clean environment
coupled with the slow growth rate and independent control of the beam
sources enable the precise fabrication
of
semiconductor heterostructures at an
atomic level. Deposition of thin layers from a fraction of a micron thick down
to a single monolayer is possible. In general,
MBE growth rates are quite low,
and for
GaAs
materials
a
value of
1
pm/h is typical.
A
modem MBE system is displayed in the photograph of Fig. 7-20.
Representing the ultimate in film deposition control, cleanliness and real-time
structural and chemical characterization capability, such systems typically cost
more than $1 million. The heart of a deposition facility is shown schematically
in Fig. 7-21a. Arrayed around the substrate
are
semiconductor and dopant
sources, which usually consist of so-called effusion cells or electron-beam
guns. The latter are employed for the high-melting Si and Ge materials. On the
other hand, effusion cells consisting of an isothermal cavity with a hole
through which the evaporant exits
are
used for compound semiconductor
elements and their dopants. Effusion cells behave like small-area sources and
exhibit a cos
4
emission. Vapor pressures of important compound semiconduc-
tor species are displayed in Fig. 3-2.
7.5.
Methods for Depositing Epitaxial Semiconductor Films
337
Figure
7-20.
Photograph
of
multichamber MBE system. (Courtesy
of
Riber Divi-
sion, Inc. Instruments
SA).
Consider now a substrate positioned a distance
I
from a source aperture of
area
A,
with
q5
=
0.
An expression for the number of evaporant species
striking the substrate is
. 3.51
x
1022PA
R=
?rI2
(MT)
1'2
As an example, consider
a
Ga source
molecules/cm2-sec.
(7-13)
in a system where
A
=
5
cm2 and
I
=
12
cm. At
T
=
900
"C
the vapor pressure
PGa
=
1
x
torr, and
substituting
MGa
=
70,
the arrival rate of Ga at
the
substrate is calculated to
be 1.35
x
1014
atoms/cm2-sec. The As arrival rate is usually much higher,
and, therefore,
film
deposition is controlled by the Ga flux. An average
monolayer of GaAs
is
2.83
i
thick and contains
-
6.3
x
1014Ga atoms/cm*.
Hence, the growth rate is calculated to be
(1.35
x
1014)/(6.3
x
1014)
x
2.83
x
60
=
36
i/min, a rather low rate when compared with VPE.
One
of
the recent advances in
MBE
technology incorporates a gas source to
supply
As
and
P,
as shown in Fig.
7-21b.
Organometallics used for this
purpose are thermally cracked, releasing the group V element as a molecular
beam into the system. Excellent epitaxial
film
quality has been obtained by this
338
Epitaxy
ULTRAHIGH-VACUUM
ULTRAHIGH-VACUUM
ClACKEl
FOR
AsHS
AND
PH3
OR
(b)
OllGANO~ETALLlCS
Figure
7-21.
Arrangement
of
sources and substrate in (a) conventional MBE system,
(b)
MOMBE system. (Courtesy
of
M.
B.
Panish,
AT&T Bell Laboratories.)
7.6.
Epitaxial Film Growth and Characterization
339
hybrid
MBE-OMVPE
process, which is known by the acronym
MOMBE.
Hydride gas sources (e.g., ASH,, PH,) have also been similarly employed in
MBE
systems.
In many applications, GaAs-Al,Ga, -,As multilayers are required. For this
purpose, the Ga and As beams are on continuously, but the A1 source is
operated intermittently. The actual growth rates are determined by the mea-
sured layer thickness divided by the deposition time. The fraction
x
can be
determined from the relation
d(AI,Ga,-,As)
-
k(GaAs)
k(Al,Ga, -,As)
X=
2
(7-14)
where the respective deposition rates
R
for GaAs and M,Ga,-,As must be
known. Recommended substrate temperatures for
MBE
of GaAs range from
500
to
630
"C. Higher temperatures, by about
50
OC,
are required for
Al,Ga,-,As because AlAs is thermally more stable than GaAs. For InP
growth from In and
P2
beams on
(100)
InP, substrate temperatures of
350-380
"C
have been used. Similarly, In,Ga, -,As films, lattice-matched to InP, have
been grown between
400
and
430
"C.
7.6.
EPITAXIAL
FILM
GROWTH
AND CHARACTERIZATION
(REF.
22)
7.6.1.
Film
Growth
Mechanisms
Irrespective of whether homo- or heteroepitaxy is involved, it is essential to
grow atomically smooth and abrupt epitaxial layers. This implies a layer
growth mechanism, and thermodynamic approaches to layer growth based on
surface energy arguments have been presented in Chapter
5.
Ideally, the
desired layer-by-layer growth depicted in Fig.
7-22
is achieved through lateral
terrace, ledge, and kink extension by adatom attachment or detachment. In this
case the new layer does not grow until the prior one is atomically complete.
One can also imagine the simultaneous coupled growth
of
both the new and
underlying layers.
In this section we explore the interactions of molecular beams with the
surface and the steps leading to the incorporation of atoms into the growing
epitaxial film. Although
MBE
is the focus, the results are, of course, applica-
ble to other epitaxial film growth sequences. The first step involves surface
adsorption-the process in which impinging particles enter and interact within
the transition region between the gas phase and substrate surface. Two kinds
of
340
Epitaxy
MONOLAYER
GROWTH
RHEED
SIGNAL
ELECTRON
BEAM
vw
e=0.75
\
/
Figure
7-22.
Real space representation of the formation of
a
single complete mono-
layer;
s
is
the fractional layer coverage; corresponding
RHEED
oscillation signal
is
shown.
adsorption-namely, physical (physisorption) and chemical (chemisorption)-
can be distinguished. If the particle (molecule) is stretched or bent but retains
its identity, and van der Waals forces bond it to the surface, then we speak of
physisorption.
If,
however, the particle loses its identity through ionic or
covalent bonding with substrate atoms, chemisorption is involved. The two can
be quantitatively distinguished on the basis of heats
of
adsorption-Hp and
H,
,
for physisorption and chemisorption, respectively. Typically,
Hp
-
0.25
eV and
H,
-
1-10 eV.
Now consider a beam of Ga atoms incident on a GaAs surface. Below about
480
"C,
Ga atoms readily physisorb on the surface, but above this temperature
Ga adsorbs as well as desorbs. Time-resolved mass spectroscopy measure-
ments of the magnitude of the atomic flux
desorbing
from the substrate have
revealed details of the mechanism of
MBE
GaAs
film growth (Ref.
23).
The
instantaneous Ga surface concentration,
nGa,
is increased by the incident Ga
beam flux, d(Ga), and simultaneously reduced by a first-order kinetics
desorption process. Therefore,
dnGa
.
Ga
-
R(Ga)
-
-
dt
4Ga)
'
(7-15)
7.6.
Epitaxial Film Growth and Characterization
341
where T,(Ga) is the Ga adatom lifetime and
nGa
/T,(Ga) represents the Ga
desorption flux d,,(Ga). Integrating Eq. 7-15 yields
kdeS(Ga)
=
R(Ga)[l
-
exp
-
t/~,(Ga)].
(7-16)
For a rectangular pulse of incident Ga atoms, the detected desorption flux
closely follows the dependence of Eq. 7-16. Similarly, when the Ga beam is
abruptly shut off, the desorption rate decays as exp
-
t/T,(Ga). The exponen-
tial rise and decay of the signal is shown schematically in Fig. 7-23a.
In
the case of As, molecules incident on a GaAs surface, the lifetime
is
extremely short (7,(As2)
=
0),
so
the desorption pulse profile essentially
mirrors that for deposition (Fig. 7-23b); i.e., kdeS(As2)
=
AS,).
However,
on a Ga-covered GaAs surface, TJAs,) becomes appreciable, with desorption
increasing only as the available Ga is consumed (Fig. 23c). These observations
indicate that in order to adsorb As, on GaAs at high temperature, Ga adatoms
are essential. The detailed model for growth
of
GaAs requires physisorption
of
mobile As, (or As,) precursors followed
by
dissociation and attachment to Ga
atoms by chemisorption. Excess As merely re-evaporates, leading to the
growth
of
stoichiometric GaAs. In summary, these adsorption-desorption
effects strongly underscore the kinetic rather than thermodynamic nature and
control
of
MBE growth.
The
111-V
compound semiconductor films are generally grown with a 2- to
a.
I
b.
I
TIME
C.
X
3
d
2
N
TIME
TIME
Figure
7-23.
As,,
(c)
As,
on
a Ga-covered surface. (From Ref.
23)
Deposition and desorption pulse shapes on
(1
11)
GaAs
for (a) Ga,
(b)
342
Epitaxy
I
I
I
I
I
I I I
I
PANDAS GaCl
&
lnCl HYDROGEN HCI
I
ADSORPTION ADSORPTION ADSORPTION
I
DESORPTION
Figure
7-24.
Atomic mechanisms involved
in
the sequential deposition of GaInAsP
on InP (Reprinted
with
permission from
John
Wiley
and
Sons,
from
G.
H.
Olsen
in
GaInAsP
Alloy
Semiconductors,
ed.
by
T.
P.
Pearsall, Copyright
0
1982,
John
Wiley and Sons).
10-fold excess
of
the group
V
element. This maintains the elemental
V-I11
impingement flux ratio
>
1. In the case of GaAs and Al,Ga,-,As, this
condition results in stable stoichiometric film growth for long deposition times.
In contrast to this so-called As-stabilized growth, there is Ga-stabilized growth,
which occurs when the flux ratio is approximately
1.
An excess of Ga atoms is
to be avoided, though, because it tends to cause clustering into molten
droplets. The (100) and
(1
11)
surfaces of GaAs and related compounds exhibit
a variety of reconstructed surface geometries dependent on growth conditions
and subsequent treatments.
For
As- and Ga-stabilized growth,
(2
x
4)
and
(4
x
2)
reconstructions, respectively, have generally been observed
on
(100)GaAs. Other structures (i.e.,
C(2
x
8)
As
and
C(8
x
2)
Ga) have also
been reported for the indicated stabilized structures. To complicate matters
further, intermediate structures, e.g.,
(3
x
l),
(4
x
6),
(3
x
6),
as well as
mixtures also exist within narrow ranges of growth conditions. The complex
issues surrounding the existence and behavior
of
these surface reconstructions
are being actively researched.
During epitaxial film deposition
of
multicomponent semiconductors, the
mechanisms of substrate chemical reactions and atomic incorporation can be
quite complex.
For
example, a proposed model
for
sequential deposition of the
first two monolayers of GaInAsP on an InP substrate is depicted in Fig.
7-24
for
the hydride process (Ref.
24).
The first step is suggested to involve
adsorption
of
P and As atoms. Then GaCl and InCl gas molecules also adsorb
7.6.
Epitaxial Film Growth and Characterization
343
in such a way that the C1 atoms dangle outward from the surface. Next,
gaseous atomic hydrogen adsorbs and reacts with the C1 atoms to form HC1
molecules, which then desorb. Now the process repeats with
P
and As
adsorption, and when the cycle is completed another bilayer of quaternaq
alloy film deposits. This picture accounts for single-crystal film growth and the
development of variable As-P and Ga-In stoichiometries.
7.6.2.
In Situ Film Characterization
This section deals with techniques that are capable of monitoring the structure
and composition of epitaxial films during in situ growth. Both
LEED
and
RHEED
have this ability. They are distinguished in Fig.
7-25.
An ultrahigh-
vacuum environment is a necessity for both methods because of the sensitivity
of diffraction to adsorbed impurities and the need to eliminate electron-beam
scattering by gas molecules. In
LEED
a low-energy electron beam
(
-
10- loo0
eV) impinges normally on the film surface and only penetrates a few angstroms
below the surface. Bragg's law for both lattice periodicities in the surface plane
results in cones
of
diffracted electrons emanating along forward and backscat-
LEED
RHEED
SPEClMl
1SC;n
t
t
N
ELECTRON
GUN
MBE
SOURCES
Figure
7-25.
Experimental arrangements
of
LEED and RHEED techniques.
344
Epitaxy
tered directions. Simultaneous satisfaction of the diffraction conditions means
that constructive interference occurs where the cones intersect along a set of
lines or beams radiating from the surface. These backscattered beams are
intercepted by a set of grids raised to different electric potentials. The first
grids encountered retard the low-energy inelastic electrons from penetrating.
The desired diffracted (elastic) electrons of higher energy pass through and,
accelerated by later grids, produce illuminated spots on the fluorescent screen.
In RHEED the electron beam is incident on the film surface at a grazing
angle of a few degrees at most. Electron energies
are
much higher than for
LEED and range from
5
to 100 keV. An immediate advantage of RHEED is
that the measurement apparatus does not physically interfere with deposition
sources in an MBE system the way LEED does. This is one reason why
RHEED has become the preferred real-time film characterization accessory in
MBE systems.
Both LEED and RHEED patterns of the
(7
x
7)
structure of the Si(ll1)
surface are shown in Fig.
7-26.
To obtain some feel for the nature of these
diffraction patterns, we think in terms of reciprocal space. Arrays of reciprocal
lattice points form rods or columns of reciprocal lattice planes shown as
vertical lines pointing normal to the real surface. They are indexed as
(lo),
(20),
etc., in Fig.
7-27.
Consider now an electron wave of magnitude
2a/X
propagating in the direction of the incident radiation and terminating at the
origin of the reciprocal lattice. Following Ewald, we draw of sphere of radius
2
n
/X
about the center. A property of this construction is that the only possible
directions of the diffracted rays are those that intersect the reflecting sphere at
reciprocal lattice points as shown. To prove this, we note that the normal
to
the
reflecting plane is the vector connecting the ends of the incident and diffracted
rays. But this vector is also a reciprocal lattice vector. Its magnitude is
2a/a
(Eq.
7-l),
where
a
is the interplanar spacing for the diffracting plane in
question. It is obvious from the geometry that
2a 2a
-
=
2
x
-sine,
a
x
(7-17)
which reduces to Bragg’s law, the requisite condition for diffraction. When the
electron energies are small as in
LEED,
the wavelength is relatively large,
yielding a small Ewald sphere. A sharp spot diffraction pattern is the result.
The intense hexagonal spot array of Fig.
7-26a
reflects the sixfold symmetry of
the (111) plane, and the six fainter spots in between are the result of the
(7
x
7)
surface reconstruction.
In RHEED, on the other hand, the high electron energies lead to a very
large Ewald sphere (Fig.
7-27).
The reciprocal lattice rods have finite width
due to lattice imperfections and thermal vibrations; likewise, the Ewald sphere
7.6.
Epitaxial Film Growth and Characterization
345
(b)
Flgure 7-26.
(a) LEED pattern
of
Si surface. (38-eV electron energy, normal
incidence)
(b)
RHEED pattern
of
Si surface. (5-keV electron energy, along
(112)
azimuth) (Courtesy
H.
Gossmann,
AT&T
Bell Laboratories.)
346
LEED
DIFFRACTED
INCIDENT
RHEED
EWALD
SPHERE
\
Epitaxy
1
10
00
Figure
7-27. Ewald sphere construction
for
LEED
and
RHEED
methods. The
film
plane
is
horizontal, and reciprocal planes are vertical lines.
is of finite width because of the incident electron energy spread. Therefore, the
intersection of the Ewald sphere and
rods
occurs for some distance along their
height, resulting in a streaked rather than spotty diffraction pattern. During
MBE film growth both spotted and streaked patterns can
be
observed; spots
occur as a result of three-dimensional volume diffraction at islands
or
surface
asperities, whereas streaks characterize smooth layered film growth. These
features can
be
seen
in the RHEED patterns obtained from MBE-grown GaAs
films (Fig.
7-28).
An
important attribute of the MEED technique is that the diffracted beam
intensity is relatively immune to thermal attenuation arising from lattice
vibrations. This makes it possible to observe the so-called RHEED oscillations
during MBE growth at elevated temperatures. The intensity of the specular
RHEED beam undergoes variations that track the step density
on
the growing
surface layer. If we reconsider Fig.
7-22
and associate the maximum beam
intensity with the flat surface where the fractional coverage
8
=
0
(or
8
=
l),
then the minimum intensity corresponds to
=
0.5.
During deposition of a
complete monolayer, the beam intensity, initially at the crest, falls to a trough
and then crests again. Film growth is, therefore, characterized by an attenu-
ated, sinelike wave with a period equal to the monolayer formation time.
Under optimal conditions the oscillations persist for many layers and serve
to
conveniently monitor film growth with atomic resolution.
The temperature above which
RHEED
oscillations are expected
can
be
easily estimated. The required diffusivity to allow a few atomic jumps to occur
and smooth terraces before they are covered by a monolayer (per second)
is
7.6.
Epitaxial Film Growth and Characterization
347
I
Figure
7-28.
MEED
patterns
(40
keV,
OiO)
azimuth) and corresponding electron
micrograph replicas
(38,400
x
)
of
same GaAs surface: (a) polished and etched
GaAs
substrate heated in vacuum
to
580 "C
for
5
min;
(b)
150-A
film
of
GaAs
deposited; (c)
1
pm
of
GaAs
deposited. (Ref.
23),
(Courtesy
of
A.
Y.
Cho, AT&T Bell Laboratories).
roughly
10-
l5
cm2/sec. By the example in Section
5.3.1,
RHEED
oscillations
are predicted to occur above
0.2TM, 0.12TM,
and
0.03TM
on group
IV
elements, metal, and alkali halide substrates, respectively, in reasonable agree-
ment with experiment.
7.6.3.
X-ray Diffraction Analysis
of
Epitaxial Films (Refs.
22, 25)
Let us suppose we wish to nondestructively measure the composition
of
a
ternary epitaxial film
of
Al,Ga, -,As on GaAs to an accuracy
of
2%.
One way
to
do this is to use the connection between the lattice parameter
a,
and
x.
348
Epitaxy
Vegard's law then suggests that
a,
must be measured to a precision of
=
2.8
x
10-5
1
-
Aa,
-
-[
2
a,(AlAs)
-
a,(GaAs)
-
a,
100
a,
(GaAs)
or
1
part in over
35,000.
This is quite a formidable challenge, and neither
LEED
nor RHEED can even remotely approach such a capability. X-ray
diffraction methods can however, but not easily. By Bragg's law (Eq. 7-15),
differentiation yields
Aa
AA
Ab'
_-
-
(7-18)
This equation reveals the inadequacy of conventional X-ray diffraction
methods in meeting the required measurement precision.
For
example, typical
CuKa
(A
=
1.5406
A)
radiation from an X-ray tube exhibits a so-called
spectral dispersion of
0.00046
A,
so
AX/h
=
0.0003.
This causes unaccept-
able diffraction peak broadening. In addition, the angular divergence
of
the
beam must be several seconds of arc, and it is not possible to achieve this with
usual slit-type collimation.
a
A
tan0
.I
,
33
0996"
32
no2
32923
33025
32
7007"
€3
(Degrees)
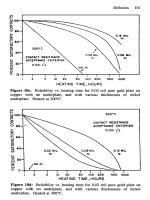
Figure
7-29.
Rocking curve for
(004)
reflection of ZnSe on
GaAs.
(Courtesy
of
B.
Greenberg, Philips Laboratories, North American Philips
Corp.)
Inset: Schematic of
high-resolution double-crystal diffractometer.
(From
Ref.
25).
349
7.6.
Epitaxial Film Growth and Characterization
For these reasons, the high-resolution
double-crystal
diffractometer, shown
schematically in Fig. 7-29, is indispensible. It has three special features:
1.
Very high angular stepping accuracy on the
0
axis (i.e.,
-
1
arc second)
2. Very good angular collimation of the incident X-ray beam (i.e.,
<
10
arc
seconds)
3.
Elimination of peak broadening due to spectral dispersion
The diffractometer consists of a point-focus X-ray source of monochromatic
radiation that falls on a first collimator crystal composed of the same material
as the sample epitaxial film (second crystal). When the Bragg condition is
satisfied, both crystals are precisely parallel. The Bragg condition is simultane-
ously satisfied for all source wavelength components e., no wavelength
dispersion. During measurement, the sample is rotated
or
rocked
through a
very small angular range, bringing planes in and out of the Bragg condition.
The resulting rocking curve diffraction pattern contains the very intense
substrate peak that serves as the internal standard against which the position of
the low-intensity epitaxial film peak is measured.
The following example (Ref. 26) involving ZnSe, a potential blue laser
material, illustrates the power and importance of the technique. A rocking
curve of an 1100-A film of ZnSe grown epitaxially on a
(001)
GaAs substrate
is shown
in
Fig. 7-29 for the
(004)
reflection. In GaAs,
a,
=
5.6537 and
a(oo.l)
=
1.4134
A.
Since
X
=
1.5406
A,
Bragg's law yields
0
=
33.025". For
ZnSe,
a,
=
5.6690 A
=
1.4173), and the expected Bragg angle
for
unstrained
ZnSe is 32.923". But the actual
(004)
peak appears at
32.802",
which corresponds to
a(oo4)
=
1.4219 A. To interpret these findings, note that
the misfit
(Eq.
7-3) in this system is -0.27%, and, hence, ZnSe is biaxially
compressed in the film plane. Since the film thickness is less than
d,
(Eq.
7-7).
it has grown pseudomorphically
or
coherently with GaAs; we can therefore
assume that ZnSe has the same lattice constant as GaAs in the interfacial plane.
However, normal to this plane the ZnSe lattice expands and assumes
a
tetragonal distortion. The measured increase
in
the
(004)
interplanar spacing
of
ZnSe is thus consistent with this explanation.
Before
leaving the subject
of
X-ray diffraction,
we
briefly comment
on
its
application in the characterization of epitaxial superlattices. These structures,
discussed further in Section 14.7, contain a synthesized periodicity, associated
with numerous alternating layers, superimposed on the crystalline periodicity
of each individual layer. Resulting diffraction patterns consist
of
the intense
substrate peak flanked on either side by a satellite structure related to the
0
0
350
106
105
104
10
2
Epitaxy
I
I
I
-
InP(400)
Figure
7-30.
High-resolution X-ray rocking curve of a IO-period Ga,,,,In,,,,As-InP
superlattice
with
d,
=
540
A
and 79-A-thick Gao,471n,,,,As layers
(data
taken
with
four-crystal diffractometer): (a) actual data;
(b)
simulation assuming no interfacial
strain; (c) simulation assuming strained layers. (From
Ref.
27).
0
0
superlattice period
d,
.
An extension
of
Bragg’s law gives
(n,
-
nJ)X
d,
=
2(sin
e,
-
sin
0,)
’
(7-19)
where
d,
is the thickness
of
a neighboring pair
of
film layers, and
n,
and
n,
are the diffraction orders.
As
an
illustration, the
(004)
rocking curve for the
10-period Ga, ,,In, ,,As-InP superlattice is shown in Fig. 7-30a. Interest-
ingly, X-ray rocking curves can be computer-modeled to simulate composi-
tional and dimensional information on superlattices containing abrupt interfaces
with remarkable precision and sensitivity. Thus, curve
c,
which closely
fits
the
data, models the case where opposite interfaces
of
each Ga,,,In, 53A~ layer
Exercises
351
are strained differently. Curve
b,
on the other hand, a poorer fit, models the
case where interfacial strain is omitted.
High-resolution X-ray diffraction
methods reveal the excellent microscopic detail with which epitaxial films can
be investigated.
7.7.
CONCLUSION
Even after coverage in this as well as Chapter
5,
additional references to
epitaxial films are scattered in various contexts throughout the remainder of the
book.
The most extensive treatment, located in Chapter 14, is devoted largely
to superlattice structures and emerging electronic devices based on them.
EXERCISES
1.
During a drought, there is frequently enough moisture in the atmosphere
to produce clouds but rain does not fall. Comment on the practice of
seeding clouds with crystals
of
AgI to induce ice nucleation and rain
formation. [Note: The crystal structure of ice is hexagonal with lattice
constants of
a
=
4.52
A,
c
=
7.36
A; the crystal structure of AgI is also
hexagonal with
a
=
4.58
A
and
c
=
7.49
A.1
0
0
2.
Fe thin films grown on single-crystal A1 substrates were found to be
essentially dislocation-free to a thickness of 1400
A,
whereas misfit
dislocations appeared with thicker films. If the lattice parameters of Fe
and A1 are 2.867
A
and 4.050
A,
respectively, what are the probable
indices describing the epitaxial interface crystallography?
3.
A monatomic FCC material has a lattice parameter
of
4
A.
For
the
(1
10)
and (1 11) surfaces,
a. sketch the direct crystallographic net indicating the primitive unit cell.
b. draw the reciprocal net.
c. compare the patterns you drew with the ball model structures and laser
d. calculate the spacing between rows
(hk).
e.
LEED
patterns are generated at normal incidence for electron energies
of
50
and
200
eV.
The
crystal surface-screen distance is
200
mm.
Index the resulting diffraction patterns that would be seen on the
180"
sector screen.
diffraction patterns
of
Fig.
5-22.
352
Epitaxy
4.
a. Calculate the lattice misfit between GaAs and Si.
b. What is the critical thickness for pseudomorphic growth of GaAs films
on Si?
Is
this thickness sufficient for fabrication of devices?
c. Even though GaP films are more closely lattice-matched to Si, what
difficulties do you foresee in the high-temperature epitaxial growth of
this material on Si substrates?
5.
You are asked to suggest
11-VI
and
111-V
compounds as heteroepitaxial
combinations for potential semiconductor device applications. Mention
two such systems that appear promising and indicate the misfit for each.
6.
Suppose monolayer formation depicted in Fig.
7-22
corresponds to
(2
x
1)
growth. Sketch the next monolayer if growth leads to the
(1
x
2)
orientation.
7.
After
10
min at
800
"C,
a 3-pm-thick layer
of
GaAs was observed to
form for both equilibrium and step-cooling LPE growth mechanisms.
a. How thick were the respective GaAs films after
5
min?
b. At what time will the growth
rates
for
equilibrium and step cooling be
identical?
8.
If
the temperature regulation in effusion cells employed in MBE is
+2
"C, what is the percent variation in the flux of atoms arriving at the
substrate for the deposition
of
GaAs films (Ga evaporated at 1200
K,
As,
evaporated at
510
K.)
9.
Sequential layers of GaAs and AlGaAs films were grown by MBE. The
GaAs beams were on throughout the deposition, which lasted
1.5
h. Thc
A1 beam was alternately on for
0.5
min and off for
1
min during the entire
run. Film thickness measurements showed that
1.80
pm of GaAs and
0.35 pm
of
AlAs were deposited.
a. What are the growth rates of GaAs and Al,G, -,As?
b. What is
x,
the atom fraction of A1 in Al,Ga, -,As?
c. What are the thicknesses of the GaAs and AI ,Ga
,
-,As layers?
d. How many layers of each film were deposited? (From A. Gossard,
AT&T Bell Laboratories.)
10.
It
is desired to make diode lasers that emit coherent radiation with a
wavelength of
1.24
pm. For this purpose,
111-V
compounds
or
ternary
solid-solution alloys derived from them can be utilized. At least four
possible compound combinations (alloys) will meet the indicated specifi-
cations. For each alloy specify the original pair of binary compounds, the
composition, and the lattice constant. (Assume linear mixing laws.)