Rules of Thumb for Mechanical Engineers 2010 Part 3 ppt
Bạn đang xem bản rút gọn của tài liệu. Xem và tải ngay bản đầy đủ của tài liệu tại đây (1.22 MB, 25 trang )
40
Rules
of
Thumb
for
Mechanical Engineers
and, for no change of phase flow, of shell diameter. If
there is no change of phase in the shell-side fluid, the baf-
fle pitch should not exceed the shell inside diameter. Other-
wise, the fluid would tend to flow parallel with the tubes,
rather than perpendicular to them, resulting in a poorer
heat transfer coefficient.
Impingement bafles
are
requjred
on shell-side inlet noz-
zles to protect the bundle against impingement by the in-
coming fluid when the fluid
1.
is condensing
2.
is a liquid vapor mixture
3.
contains abrasive material
4.
is entering at high velocity
In addition, TEMA requires bundle impingement protec-
tion when nozzle values of
pu2
(fluid density, kg/m3, times
velocity squared m2/s2) exceed:
1.
2,230
kg/m-s2 for noncorrosive, nonabrasive, single-
2.744
kg/m-s2 for all other liquids
Also, the minimum bundle enu-ance
area
should equal or
exceed the inlet nozzle area and should not produce a value
of pu2 greater
than
5,950 kg/m-s2,
per
TEMA.
Impingement
baffles can be either flat
or
curved. In order to maintain a
maximum tube count, the impingement plate is sometimes
located in a conical nozzle opening
or
in a dome cap above
the shell. The impingement plate material should be at
least as good as that of the tubes.
phase fluids
Sources
1.
Standards
of
Tubular Manufactiners
Association,
7th
Ed,
2.
Cheremisinoff,
N.
P.,
Heat Transfer Pocket Handbook.
TEMA, Tarrytown, NY, 1988.
Houston: Gulf Publishing Co., 1984.
The following notes summarize design features of shells
for shell-and-tube heat exchangers.
The
single-pass shell
is the most common shell con-
struction used. The shell-side inlet and outlet nozzles are
located at opposite ends of the shell. The nozzles can be
placed on opposite or adjacent sides of the shell, depend-
ing on the number and type of baffles used. A typical one-
shell pass exchanger with horizontal segmental baffles is
illustrated in Figure
23
[A] (TEMA
E).
A
two-pass shell
uses a longitudinal baffle to direct the
shell-side flow. An exchanger with two shell passes is
shown in Figure
23
[B].
Note that both the shell inlet and
outlet nozzles are adjacent to the stationary tube sheets. A
shell-side temperature range exceeding 195°C should be
avoided, since greater temperature ranges result in exces-
sive heat leakage through the baffle, as well
as
thermal
stresses in the baffle, shell, and tube sheet.
The longitudinal baffle can be either welded or remov-
able. Since there
are
severe design and cost penalties
as-
sociated with the use of welded baffles in floating head ex-
changers, this type of design should be used only with
fixed-tube sheet units that do not require expansion joints.
Removable longitudinal baffles require the use of flexible
light gauge sealing strips or a packing device between the
baffle and the shell, to reduce fluid leakage from one side
to the other (TEMA
F).
A
dividedflow shell
has a central inlet nozzle and two
outlet nozzles, or vice-versa. A divided flow exchanger is
illustrated in Figure
23
[C]. This type is generally used to
reduce pressure drop in a condensing service. In minimiz-
ing pressure drop the shell fits in
as
follows:
. E shell with segmental baffles
E shell with double segmental baffles
Heat Transfer
41
SINGLE
PASS
SHELL
(4
TWO
PASS
SHELL
(B)
h
DIVIDED FLOW SHELL
(C)
Figure
23.
(A)
Single-pass shell;
(B)
two-pass shell;
(C)
divided flow shell
[2].
J
shell with segmental baffles
J
shell with double segmental baffles
E
shells
in
parallel with segmental baffles
E
shells in parallel with double segmental baffles
J
shells in parallel with segmental baffles
J
shells in parallel with double segmental baffles
Generally, for most designs, double segmental baffles are
used with
J
shells.
Double segmental baffles
in
a divided-flow exchanger nor-
mally have a vertical cut.
This
baffle arrangement
also
re-
quires that there be an odd number
of
total baffles, but there
must
also
be
an
odd
number
of
baffles in each end of the shell.
The center baffle for
this
arrangement is normally similar
to
the center baffle used with segmental cut. The baffles
on
each
side of the central baffle and the last baffle toward the ends
of the shell have solid centers with cutaway edges.
The choice of whether to stack shells depends on main-
tenance considerations,
as
well
as
on the
amount
of plot
am
available. Stacking shells requires less area and frequent-
ly
less piping. Normally, shells are not stacked more than
two high. However, stacked heat exchangers
are
more
costly to maintain, because
of
accessibility.
If sufficient plot area is available, the following guide-
lines apply:
1.
If
the fluids
are
known to
be
clean and noncorrosive,
2.
If the fluids
are
moderately clean or slightly corrosive,
3.
If
the fluids
are
very
dmy
or corrosive, the shells should
the shells should usually
be
stacked.
the shells may be stacked.
not
be
stacked, to allow for ease of maintenance.
Sources
1.
Standards
of
Tubular Exchanger Manufacturer’s
As-
2.
Cheremisinoff,
N.
P.,
Heat
Transfer Pocket Handbook.
sociation,
7th
Ed.,
TEMA, Tarrytown,
NY,
1988.
Houston: Gulf Publishing
Co.,
1984.
42
Rules
of
Thumb for Mechanical Engineers
Miscellaneous
Data
Design-related
data
are
given in Tables
8
through
10.
Table
8
provides typical tube dimensions and tube surface
areas per unit length. Table
9
gives thermal conductivities
of materials commonly used for exchanger construction.
Table
10
gives recommended maximum number of tube
passes as a function of tube size.
Source
Cheremisinoff,
N.
P.,
Heat Transfer Pocket Handbook.
Houston: Gulf Publishing Co., 1984.
Table
8
Tube Dimensions and Surface Areas Per Unit Length
$=
O.D.
of
=w
(-1
19.05
19.05
19.05
19.05
25.40
25.40
25.40
25.40
38.10
38.10
38.10
2.77
2.11
1.65
1.24
3.40
2.77
2.11
1.65
3.40
2.77
2.11
I.D.
of
13.51
14.83
15.75
16.56
18.59
19.86
21 18
22.10
31.29
32.56
33.88
nm
(m)
Internal
Area
143.8
172.9
194.8
215.5
271.6
309.0
352.3
383.2
769.0
832.9
901.3
(-3
Ex&rnal
surface
WRLength
(4
0.0598
0.0598
0.0598
0.0598
0.0798
0.0798
0.0798
0.0798
0.1197
0.1197
0.1197
Table
9
Thermal Conductivities
of
Materials
of
Construction
Thermal
Cmductivity,
k,
Material
(hlpO&ition
Wt/m-"C
71 Cu-28
Zn-1
Sn
111
16
Admiralty
Type
316
stainless
steel
17 Cr-12
Ni-2
Mo
Type
304
stainless
steel
18
Cr-8
Ni
16
BrasS
70
Cu-30
Zn
99
Redbrass
85
Cu-15
Zn
159
Alumimlmbraps
76
Cu-22
Zn-2
Al
10
Cup-nickel
90 Cu-10
Ni
71
CupnicM
70
Cu-30
Ni
29
Mod
67
Ni-30
Cu-1.4
Fe
26
Inconel
19
Aluminum
202
Carbonsteel
45
Carbon-moly
0.5
Mo
43
386
35
copper
Lead
Nickel
62
Titanium
19
Chrome-moly
steel
1
Cr-0.5
Mo
42
2'/4
Cr-0.5
Mo
38
5
Cr4.5
Mo
35
12 Cr-1
MO
28
Table
10
Maximum Number
of
Tube Passes
RecommendedMaximum
Shell
I.D.
(mm)
NWllb6XOfltlllePaSSeS
e250
4
250-
e510 6
510- e760
8
760-
<1,020
10
1,020- <1,270 12
1,270- <1,5u) 14
FLOW REGIMES AND PRESSURE DROP IN TWO-PHASE HEAT TRANSFER
Flow
Regimes
Standard
practice for heat exchanger analysis is to first
identify the flow regimes and then employ the appropriate
correlations.
Bubbly
flow.
In
this
type, the gas
or
vapor phase is dis-
tributed as discrete bubbles in a continuous liquid phase.
At one extreme, the bubbles
may
be small and spherical,
and at the other extreme, the bubbles may be large with a
spherical cap and a flat tail.
Slug
flow.
The
gas
or
vapor bubbles
are
approximately the
diameter
of
the pipe. The nose
of
the bubble
has
a charac-
Vertical Upward Concumnt
Flow
Flows of this type are shown in Figure
24.
Heat
Transfer
43
WISPY- ANNULAR
BUBBLY FLOW SLUQ FLOW CHURN FLOW ANNULAR FLOW
Figure
24.
Flow
patterns in vertical concurrent
flow
[l].
teristic spherical cap, and the gas in the bubble is separat-
ed from the pipe wall by a slowly descending liquid film.
The liquid flow is contained in liquid slugs that separate suc-
cessive gas bubbles. Slugs may or may not contain small-
er entrained gas bubbles carried in the wake of
the
large bub-
ble. The length of the main gas bubble varies.
Churn flow.
Formed by the breakdown of the large vapor
bubbles in slug flow. The gas or vapor flows chaotically
through the liquid that is mainly displaced to the channel
wall. The flow has a time-varying character and hence is
called "churn flow." This region is also sometimes re-
ferred to as semi-annular or slug-annular flow.
Wispy-annular flow.
The flow takes the form of a relatively
thick liquid film on the walls of the pipe together with a con-
siderable amount of liquid entrained in a central gas or vapor
core. The liquid in the film is aerated by small gas bubbles
and the entrained liquid phase appears as large droplets
which have agglomerated into long irregular filaments or
wisps. This generally occurs at high mass velocities.
Annular flow.
A
liquid film forms at the pipe wall with a
continuous central gas or vapor core. Large amplitude co-
herent waves are usually present on the surface of the film,
and the continuous break up of these waves forms a source
for droplet entrainment, which occurs in varying amounts
in the central gas core.
Vertical Heated Channel Upward
Flow
Heat flux through the channel wall alters the flow pat-
tern from that which would have occurred in a long unheated
channel at the same local flow conditions. These changes
occur due to:
1.
The departure from thermodynamic equilibrium cou-
pled with the presence of radial temperature profiles
in the channel.
2.
The departure from local hydrodynamic equilibrium
throughout the channel.
Figure
25
shows a vertical tubular channel heated by a
uniform low heat flux and fed with liquid just below the sat-
uration temperature.
BOILING
REGIME
Y
.
*.
.
.:>'.
E:
: ,.
:.e
::'::
:.
,.
.
.A
.::I
f
FLOW
Figure
25.
Flow
patterns in a vertical evaporator tube
[2].
In the initial single-phase region, the liquid is heated to
the saturation temperature. A thermal boundary layer forms
at the wall, and a radial temperature profile forms. At some
distance from the inlet, the wall temperature and the con-
ditions for the formation
of
vapor (nucleation) at the wall are
satisfied. Vapor forms at preferred positions on the tube
surface. Vapor bubbles grow from these sites finally de-
taching to form a bubbly flow. With the production of more
vapor, the bubble population increases with length and co-
alescence occurs, forming slug flow, which in
turn
gives way
to annular flow further along the channel. Close to this
44
Rules
of
Thumb for Mechanical Engineers
point
the
formation of vapor at sites on the wall may cease
and further vapor formation will result from evaporation at
the liquid-film vapor-core interface. Increasing velocities in
the vapor core cause entrainment of liquid in the form of
droplets. The depletion of the liquid from the film by this
entrainment and by evaporation finally causes the
film
to
dry
out completely. Droplets continue to exist and
are
slowly
evaporated until only single-phase vapor is present.
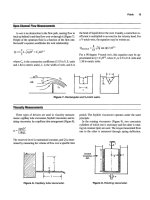
Figure
26
shows the flow patterns of liquid-vapor flow
in a heated pipe as a function of wall heat flux. Liquid en-
ters the pipe at a constant flow rate and at a temperature
lower than
the
saturation temperature.
As
the heat flux in-
creases, the vapor appears closer and closer to the pipe inlet.
The local boiling length is
the
extent of pipe where bubbles
form at the wall and condense in the liquid core where the
liquid temperature is still lower than the saturation tem-
perature. Vapor forms by:
1. Wall nucleation
2.
Direct vaporization on the interfaces located in the flow
itself
I?GREASINO
HEAT
FLUX
w
SUPERWUTLD
VAPOR
REOlON
OPlsCT
OF
((UCLCATE
BOKINO
t
COWSTANT
LlOUlD
PLOWRATS
Figure
26.
Convective boiling in a heated channel
[3].
(With permission
of
Elsevier Science Ltd.)
There
is
progressively less liquid between the wall and
the interfaces. Consequently, the thermal resistance de-
creases along with the wall temperature, resulting
in
an
end
to wall nucleation. In annular flow, the liquid
film flow rate
decreases through evaporation and entrainment
of
droplets,
although some droplets
are
redeposited.
In
heat flux con-
trolled systems, when the film is completely dried out, the
wall temperature rises very quickly and can exceed the
melting temperature of the wall (called dryout). Flow pat-
terns are
shown
in Figure
27.
In upward bubbly flow, bubbles
are
spread over the en-
tire pipe cross-section whereas in the downward flow bub-
bles gather near the pipe axis.
Figure
27.
Air-water flow patterns in
a
downward con-
current flow in
a
vertical pipe:
(1)
bubbly,
(2)
slug,
(3)
falling
film,
(4)
bubbly falling film,
(5)
churn,
and
(6)
dispersed
annular flow
[4].
At higher gas flow rates (but a constant liquid flow rate)
the bubbles agglomerate into large gas pockets. The tops
of these gas plugs are dome-shaped whereas the lower ex-
tremity is flat with a bubbly zone underneath. This
slugflow
is generally more stable than in the upward case.
With annular flow, at small liquid and gas flow rates, a
liquid
film
flows down the wall
(falling
film
flow).
If
the
liquid flow rate
is
higher, the bubbles are entrained with-
in the film
(bubbZyfaZZingJiZm).
At greater liquid and gas
flow rates
chumflow
exists, which can evolve into dispersed
annular flow for very high gas flow rates.
Horizontal
Concurrent
Flow
The flow patterns for this type of flow are shown in
Figure
28.
Bubbly
flow (froth flow).
This resembles the case
in
ver-
tical flow except that the vapor bubbles tend to travel in the
upper half of the pipe. At moderate gas and liquid veloci-
ties, the entire pipe cross-section contains bubbles. At
higher velocities,
a
flow pattern equivalent
to
the wispy-an-
nular pattern exists.
Plug
flow.
This is similar to slug flow in the vertical di-
rection. Again, the gas bubbles tend to travel in the upper
half of the pipe
Stratified flow.
This
pattern
only
occurs at very low
liq-
uid and vapor velocities. The two phases flow separately
with a relatively smooth interface.
Wavy
flow.
As the vapor velocity
is
increased, the inter-
face becomes disturbed by waves traveling in the direction
of
flow.
Slug
flow.
At higher vapor velocities the waves at the
in-
terface break up to form a frothy slug which is propagat-
Heat Transfer
45
b
-
Stratified
wavy
Annular
Flow
-
Figure
28.
Flow patterns in horizontal flow
[l].
ed along the channel at a high velocity. The upper surface
of the tube behind the wave is wetted by a residual film,
which drains into the bulk of the liquid.
Annular flow.
At higher vapor velocities a gas core forms
with a liquid film around the periphery of the pipe. The film
may or may not be continuous around the entire circum-
ference but it will be thicker at the base of the pipe.
Flow patterns formed during the generation of vapor
in
hor-
izontal tubular channels are influenced by departures from
thermodynamic and hydrodynamic equilibrium. Figure 29
shows a horizontal tubular channel heated by a uniform low
heat flux and fed with liquid just below the saturation tem-
perature. The sequence of flow patterns corresponds to a rel-
atively low inlet velocity (<I
ds).
Note the intermittent
dyng and rewetting of the upper surfaces of the tube
in
wavy
flow and progressive drying out over long tube lengths of the
upper circumference of the tube wall in annular flow. At high-
er inlet liquid velocities, the influence of gravity is less ob-
vious, the phase distribution becomes more symmetrical, and
the flow patterns become closer to those in vertical flow.
STRATIFIED-
SPRAY
FLOW
STRATIFIED
FLOW
VERTICAL
a
HORIZONTAL
FLOWS
SPRAY
FLOW
INTERNITTENT Fl
VERTICAL
FLOW
.ow
BUBBLY
FLOW
Figure
30.
Shell-side two-phase flow patterns
[5].
(With permission
of
ASME.)
Spray flow.
This occurs at high mass flow qualities with
liquid carried along by the gas as a spray.
Bubbly flow.
This occurs at low mass flow qualities with
the gas distributed as discrete bubbles in the liquid.
Intermittent flow.
Intermittent slugs of liquid are pro-
pelled cyclically by the gas.
Stratified-spray flow.
The liquid and gas tend to separate
with liquid flowing along the bottom. The gas-phase is en-
trained as bubbles in the liquid layer and liquid droplets are
carried along by the gas as a spray.
Stratified flow.
The liquid and gas are completely separated.
Spray and bubbly flows occur for either vertical up-and-
down flow or horizontal side-to-side flow. Intermittent flow
only occurs with vertical up-and-down flow and stratified-
spray and stratified flow with horizontal side-to-side flow.
Flow Normal to Tube Banks
Sources
The flow patterns in the crossflow zones are shown in
Figure
30.
Figum
29.
Flow patterns in a horizontal tube evaporator
[2].
1. Cheremisinoff, N.
P.,
Heat Transfer Pocket Handbook,
2. Collier,
J.
G., Convective Boiling and Condensation.
3.
Hewitt, G. F. and Hall-Taylor, N.
S.,
Annular Two-Phase
4.
Oshinowo, T. and Charles, M.
E.,
in Can. Journ.
of
5.
Grant,
I.
D.
R.
and Chisholm,
D.
in Trans
ASME,
Jour-
Houston: Gulf Publishing Co., 1984.
New York: McGraw-Hill, 1972.
Flow. London: Pergamon Press, 1970.
Chem. Engrg.,
52:
25-35,
1974.
nal ofHeat Transfel; 101 (Series C): 3842, 1979.
46
Rules of Thumb
for
Mechanical Engineers
A
flow pattern map is a two-dimensional representation
of the flow pattern existence domains. The respective pat-
terns may be represented as areas on a graph, the coordi-
nates of which
are
the actual superficial-phase velocities
(il
or
jJ.
The coordinate systems
are
different according to var-
ious authors, and
so far there is no agreement on the best
coordinate system.
Vertical Upward Flow
Figure
3
1
shows a flow pattern map based on observa-
tions on low-pressure air-water and high-pressure steam-
water flow in small diameter
(1-3
cm) vertical tubes [4].
The axes are the superficial momentum fluxes of the
liq-
uid (pi1) and vapor (pi,') phases, respectively. These su-
perficial momentum fluxes can also
be
expressed in terms
of mass velocity
G
and the vapor quality
x:
Figure
3
1
should be considered as a rough guide only.
Vertical Downward Flow
Figure 32 shows one investigator's chart [2]. Data are
based
on
two-component mixtures
of
air and different
liq-
uids flowing in a pipe 25.4 mm in diameter at a pressure
of around
1.7
bar. The abscissa and ordinate are the quan-
tities Fr/a and
m)
(where
p
is the liquid holdup
fraction) which
are
calculated at the test section pressure
and temperature. The Froude number, Fr, is defined by:
Fr
=
(ig
+
jlI2/gdi
where g
=
acceleration due to the gravity
di
=
pipe diameter
A
=
a coefficient that accounts for the liquid phys-
ical properties
where
p
=
liquid viscosity
p
=
liquid density
o
=
liquid surface tension
Subscript w refers to water at
20°C and
1
bar.
(3)
I
'8
0-
8
8
'.
-Y
-Jug
8
#
8
'sue
Lghh
(0
ddddo'
c
.I
I
I
1
1
3
LA
Ib
'
rddddo'
'
46
Figure
31.
Flow
pattern map for vertical upward flow
[4].
(With permission
of
AEA
Technology plc.)
.1oIql
.lo
1
10
100
1000
10000
cr/
a
Figure
32.
Flow pattern map for vertical downward flow:
(1)
bubbly,
(2)
slug falling film,
(3)
falling film,
(4)
bubbly
falling
film,
(5)
churn, and (6) dispersed annular
flow
[a.
Heat Transfer
47
Horizontal
Flow
Flow
Normal
to
Tube
Banks
The well-known Baker plot consists of a plot of
GJh
and
G,hv/G,,
where
G,
and
GI
are the superficial mass veloc-
ities of the vapor and liquid phases, respectively
[5].
The
factors
h
and
y~
are:
and
v=(%)
(4)
(5)
Baker's map has been modified by many investigators.
Mandhane et al.
[6]
based a map upon
5,935
data points,
1,178
of which concern air-water flows. Its coordinates are
the superficial velocities
j,
and
j,
calculated at the test sec-
tion pressure and temperature. The map is shown in Figure
33
and is valid for the parameter ranges given in Table
11.
I
10-3
10 lo2 103
jg
m/s
10-2 10-1
Figure
33.
Flow
map proposed
by
Mandhane et al.
[SI.
(With permission
of
Elsevier Science
Ltd.)
Flow pattern maps for both vertical and horizontal
flow
normal to the tube banks are given in Figure
34.
The para-
meters of these maps are those of Baker
[5],
modified ac-
cording to Bell, et al.
[7].
It is a plot
of
superficial gas
ve-
Table
11
Parameter Ranges for the
Flow
Map
Proposed by Mandhane et al.
Conditions Range
of
Values
Liquid density
705
-
1,009
kg-~n-~
Gas
density
0.80
-
50.5
kg-x~-~
Liquid viscosity
3
x
-
9
x
Pa
Gas
viscosity
10-5
-
2.2
x
Pa
Surface tension
24
-
103
mN-m-'
Liquid
superficial
velocity
Gas
superficial velocity
Source:
Mandhane
[6].
Pipe inner diameter
12.7
-
165.1
IIIRI
cm-s-'
m-s-'
0.09
-
731
0.04
-
171
.1
.o
1
rn
\
ti
N
>
'm
-4
Q
Q
Y
rn
*n
.*
.o
1
\
INrrOMlTlENT
FLOW
YEIlTKM
FLOW
SmAY
FLW
/
IiORlZONTAL
FLOW
1
I
0.1
1
10
j,
(pRI-r,)1/3/a
(s2/*s)
'I3
Figure
34.
Shell-side
flow
pattern maps
[3].
(With per-
mission
of
ASME.)
48
Rules
of
Thumb for Mechanical Engineers
locity vs. superficial liquid velocity with physical property
terns
attached. Superficial is used in the sense that the total
flow area and not the actual phase flow area is used to eval-
uate the phase velocity. The flow area referred
to
is the min-
imum cross-sectional area for flow through the tube bank.
Sources
1. Cheremisinoff,
N.
P.,
Heat Transfer Pocket Handbook.
2. Oshinowo, T. and Charles, M.
E.,
in
Can.
Journ.
of
Houston: Gulf Publishing Co., 1984.
Chem. Engrg.,
52:
25-35,1974.
3. Grant,
I.
D.
R. and Chisholm,
D.
in
Transactions
ASME,
Jozimal
of
Heat Transfer;
101 (Series C): 3842, 1979.
4.
Hewitt,
G.
E
and
D.
N.
Roberts, “Studies
of
Two-Phase
Flow Patterns by Simultaneous X-Ray
and
Flash Pho-
tography,” AERE-M2159,
H.M.S.O.,
1969. Copyright
AEA
Technology plc.
5.
Baker,
0.
in
Oil
&Gas Journ.,
53
(12): 185-190,1954.
6.
Mandhane,
J.
M.,
Gregory,
G.
A.,
and
Aziz,
K.
in
Intl.
Joum.
of
Multi
Flow,
1:
533-537, 1974.
7. Bell,
K.
J.,
Taborek,
J.,
and Fenoglio,
E,
Chem. Engrg.
Progress,
Symposium Series (Heat Transfer-Min-
neapolis), 66 (102): 150-165, 1970.
Estimating
Pressure
Drop
Two-phase drop in a shell-and-tube heat exchanger con-
sists
of
friction, momentum change, and gravity:
AP
=
APf
+
APm
+
APg
(6)
The entrance and exit pressure losses, usually considered
in a compact heat exchanger application, are neglected
because
of
1. The lack of two-phase data for these pressure losses
2. Their small contribution to the total pressure drop for
tubular exchangers
The evaluation
of
AP
due to momentum and gravity effects
is generally based on a homogeneous model.
Homogeneous
Flow
Model
This is the simplest two-phase flow model. The basic
premise is that a real two-phase flow can
be
replaced by a
singlephase flow with the density of the homogeneous mix-
ture defined by:
1
l-x
x
+-
Phorn
PI
Pg
-=-
where
v
is the specific volume. Subscripts 1 and g denote
liquid and gas phases and x is the quality (the ratio
of
gas
mass
flow
rate to total [gas
+
liquid] mass flow rate).
The pressure droplrise due to an elevation change is:
Angle
9
is measured from the horizontal. The
+
sign stands
for a downflow, and the
-
sign stands for
an
upflow. Grav-
ity pressure drop predictions from
this
theory are good for
high quality and high pressure applications. When
APg
is
predominant (one half to two thirds of the AP), such as for
low velocities and low pressure applications, the following
equation, which takes into
account
the velocity slip between
two phases via the void fraction
a
(the ratio of gas volume
to total volume), should be used:
APg
=
f
(p,
(1
-
a)
+
pga)
(gig,)
L
sin
8;
for
APg
>
0.5
APtod
(9)
The momentum pressure drop/rise from the homogeneous
model is:
p2
and
p1
are the densities of homogeneous mixtures at
the exchanger (tube) outlet and inlet, respectively. They
are individually evaluated using Equation 7.
G
is the
mass velocity.
Heat
Transfer
49
Separated
Flow
Model
Here, the two phases are artificially segregated into two
streams. Each stream (vapor and liquid) is under the same
pressure gradient but not necessarily with the same veloc-
ity. The separated flow model reduces to the homogeneous
flow model if the mean velocities of the two streams are the
same. The best known separated flow model is the Lock-
hart and Martinelli correlation
[2].
In
the Lockhart-Martinelli
method, the two fluid streams are considered segregated.
The conventional pressure-drop friction-factor relation-
ship is applicable to individual streams. The liquid- and gas-
phase pressure drops are considered equal irrespective of
the flow patterns. $:denotes the ratio of a two-phase fric-
tional pressure drop to a single-phase frictional pressure drop
for the
liquid
flowing alone in the tube:
And for vapor:
where
AP,
is the single-phase frictional pressure drop for
the
gas
flowing alone in the tube.
x2
is the ratio of a single-phase pressure drop for the liq-
uid phase flowing alone in the tube to that for the gas
phase flowing alone in the tube.
2
-
Dl
AP?2
x
The correlation is shown in Figure
35
and the curves can
be represented in equation form as:
c1
xx
$?=I+ +,
or
where the value of
C
is dependent upon the four possible
single-phase flow regimes.
(1-
01
Q)
XI
1
01
1
PARAMETER
X
Figure
35.
Lockhart-Martinelli correlation
[2].
(With
permission
of
ASME.)
Liquid
Gas
C
Turbulent
-
Turbulent
(W
20
Viscous
-
Turbulent
(vt)
12
Turbulent
-
(tv)
10
Viscous
-
Viscous
(w)
5
(1
6)
Viscous
The two-phase frictional pressure drop by the Lock-
hart-Martinelli method is determined as follows. First,
from the amount of liquid and gas flow rates, and using cor-
responding friction factors or appropriate correlations,
AP,
and
AP,
are calculated. The liquid flow is considered to oc-
cupy the entire cross-section for the
A€’,
evaluation, and the
gas flow occupies the whole cross-section for the
APg
eval-
uation. The parameter
x
is then calculated from Equation
13.
The value of
C
is
determined from Equation
16
and
@,
or are computed from Equations
14
and
15.
The two-
phase frictional pressure drop is then calculated from the
definition of
$.
The Lockhart-Martinelli method was developed for two
component adiabatic flows at a pressure close to atmospheric.
Martinelli and Nelson
[3]
extended this method for forced
convection boiling for all pressures up to the critical point.
The mixture of steam and water was considered “turbulent-
turbulent.” They presented
(&
graphically as a function
of
the quality
x
and the system pressure as shown in Figure
36.
50
Rules of Thumb for Mechanical Engineers
Figure
36.
Martinelli-Nelson correlation
[3].
where
API0
is the frictional pressure drop for the liquid flow
alone, in the same tube, with a mass flow rate equal to the
total
mass flow rate of the two-phase flow.
The Martinelli-Nelson experimental curves of
ql0
vs. x
show breaks in the slope due to changes in flow regimes.
Surface tension is not included although it may have a
significant influence at high pressure near the critical point.
The Martinelli-Nelson method provides more correct results
than the homogeneous model for low mass velocities (G
e
1,360 kg/m2s).
In
contrast, the homogeneous model provides
better results for high mass velocities.
Chisholm gives the following correlation for flow of
evaporating two-phase mixtures that accounts for some of
the effects neglected in other methods [4].
where B
=
(CI'
-
22
-
+2)/(r2
-
1) (19)
r2
=
AP,JAP,,
(20)
C
=
(PI/P~)'/~/K
+
K
(p$pI)'"
(21)
K
=
velocity ratio
=
jg/jl
(22)
n is the exponent in the Blasius relation for friction factor
f
=
CI/Ren, with n
=
0.25
for
the turbulent flow. These dis-
cussions are inclusive of tube flow only.
Two-phase pressure-drop correlations for the shell-side
flow are available for a segmentally baffled shell-and-tube
exchanger. The frictional pressure drop consists of two
components, one associated with the crossflow zone and the
other with the window zone. Grant and Chisholm deter-
mined the components of the pressure drop [4]. The two-
phase crossflow zone and window zone frictional pres-
sure drops are given by Equation 18 with values of B given
in Table 12. Values of exponent
n
for the crossflow zone
are: n
=
0.46 for horizontal side-to-side flow, and n
=
0.37
for vertical up-and-down flow.
Table
12
Values of
B
for Two-Phase Frictional Pressure-Drop
Evaluation in Crossflow and Window-Flow Zones
by Equation
18
~~ ~
krtical
Zone Horizontal
Up
and
Down Plow
Crossflow
Spray
and
bubble
0.75
1.0
Window (n
=
0)
2/(r
+
1)
(P/Ph,3°,u
Stratified
and
0.25
-
Stratified
spray
Sources
I.
Cheremisinoff, N.
P.,
Heat Transfer Pocket Handbook.
2. Lockhart,
R.
W.
and Martinelli,
R.
C., in
Chem. Engrg.
3. Martinelli,
R.
C. and Nelson,
D.
B.,
in
Transactions
4. Chisholm,
D.,
Zntl.
Joum.
ofHeatandMass Transfeel;
16:
Houston: Gulf Publishing Co., 1984.
Prog.,
45:
3948,
1949.
ASME,
70: 695,1948.
347-358, 1973.
Thermodynamics
Bhabani
P
.
Mohanty. Ph.D.,
Development Engineer. Allison Engine
Company
Thermodynamic Essentials
52
Phases
of
a
Pure
Substance
52
Thermodynamic Properties
53
Determining Properties
55
Types
of
Systems
56
mes
of
Processes
56
First
Law
of
Thermodynamics
58
Work
58
Heat
58
First
Law
of
Thermodynamics for Closed Systems
58
First
Law
of Thermodynamics
for
Open
Systems
58
Second
Law
of
Thermodynamics
59
Reversible Processes and Cycles
59
The
Zeroth
Law of Thermodynamics
57
Thermodynamic Temperature Scale
59
Useful Expressions
59
Thermodynamic Cycles
60
Basic Systems and Systems Integration
60
Carnot Cycle
60
Rankine Cycle: A Vapor Power Cycle
61
Refrigeration Cycle
61
Brayton Cycle: A Gas Turbine Cycle
62
Otto
Cycle: A Power Cycle
63
Diesel Cycle: Another Power Cycle
63
Reversed Rankine Cycle:
A
Vapor
Gas Power Cycles with Regeneration
64
51
52
Rules of
Thumb
for
Mechanical Engineers
THERMODYNAMIC ESSENTIALS
Thermodynamics is the subject of engineering that pre-
dicts how much energy can be extracted from a working
fluid and the various ways of achieving it. Examples of such
areas
of engineering interest
are
steam
power plants
that
gen-
erate electricity, internal combustion engines that power au-
tomobiles, jet engines that power airplanes, and diesel lo-
comotives that pull freight. The working fluid that is the
medium
of
such energy transfer may
be
either
steam
or
gases
generated by fuel-air mixtures.
Phases
of
a
Pure
Substance
The process of energy transfer from one form to anoth-
er is dependent on the properties
of
the fluid medium and
phases
of
this
substance. While we
are
aware
of
basically
three phases
of
any substance, namely
solid, liquid,
and
gaseous,
for the purposes
of
thermodynamic analysis we
must define several other intermediate phases. They
are:
Solid:
The material
in
solid state does not take the
shape
of
the container that holds
it.
Subcooled liquid:
The liquid at a condition below its
boiling point is called
subcooled
because addition of a
little more heat will not cause evaporation.
Saturated liquid:
The state of liquid at which addition
of any extra heat will cause it to vaporize.
Saturated vapor:
The state of vapor that is at the verge
of
condensing back to liquid state. An example
is
steam at 212°F and standard atmospheric pressure.
Liquid vapor mix:
The state at which both liquid and
vapor
may
coexist at the same temperature and pres-
sure. When a substance exists in this state at the satu-
ration temperature, its
quality
is a mass ratio defined
as
follows:
Superheated vapor:
The state of vapor at which ex-
traction
of
any
small
amount
of
heat
will
not cause con-
densation.
Ideal gas:
At a highly superheated
state
of
vapor, the
gas obeys certain ideal gas laws to be explained later
in this chapter.
Real gas:
At a highly superheated state of vapor, the
gas
is
in
a state that does not satisfy ideal
gas
laws.
Because the phase
of
a substance is a function
of
three
properties, namely
pressure, temperature,
and
volume,
one
can
draw
a threedimensional phase diagram of the sub-
stance. But in practice, a two-dimensional phase diagram
is more useful
(by
keeping one of the three properties
constant). Figure
1
is one such example in the pressure-
volume plane. The region of interest in this figure is the
liquid-vapor regime.
Saturation
Dome
v
Figure
1.
The
p-v
diagram.
Thermodynamics
53
Thermodynamic
Properties
There
are
two types of thermodynamic properties: ex-
tensive and intensive.
Extensive properties,
such as mass
and volume, depend on the total
mass
of
the substance
present. Energy and entropy also fall into
this
category.
Zn-
tensive properties
are
only definable at a point in the sub-
stance. If the substance is uniform and homogeneous, the
value
of the intensive property will
be
the
same
at each point
in the substance. Specific volume, pressure, and tempera-
ture
are
examples of these properties.
Intensive properties are independent
of the amount of
matter, and it is possible to convert an extensive parame-
ter to an intensive one. Following
are
the properties that gov-
em thermodynamics.
Mass
(m} is a measure
of
the mount of matter and is ex-
pressed in pounds-mass (lbm
)
or in pound-moles.
Volume
(V) is a measure
of
the space occupied by the
matter. It may be measured directly by measuring its phys-
ical dimensions, or indirectly by measuring the amount of
a fluid it displaces. Unit is
ft3.
Specific
volume
(v) is the volume
per
unit
mass.
The unit
is given in €t3/lbm.
Density
(p)
is the mass per unit volume. It is reciprocal
of the specific volume described above.
Temperature
(T) is the property that depends on the
energy content in
the
matter.
Addition
of
heat causes the tem-
pera-
to
rise.
The
Zeroth
Law
of
Themdynamics
defines
temperature.
This
law states that heat flows from one source
to another only
if
there
is
a temperature difference between
the two.
In
other words, two systems
are
in
thennal
equi-
librium
if they are at the same temperature. The tempera-
ture
units
are
established by familiar freezing and boiling
points
of
water
(32°F
and
212"F,
respectively).
The relationship between the Fahrenheit and Celsius
scales
is:
T
OF
=
32
+
(p)
T
"C
In
all
thermodynamic calculations, absolute tempera-
tures
must be used unless a temperature difference
is
in-
volved. The absolute temperature scale is independent of
properties of any particular substance, and is known as
Rankine and Kelvin scales
as
defined below:
T
"R
=460
+
T
"F
T
"K
=
273
+
T
"C
The pressure, volume, and temperature are related by the
so-called
ideal
gas
law,
which is:
pV
=
RT
where
R
is the proportionality constant.
area:
Pressure
(p)
is the normal force exerted per unit surface
p=-
FIl
A
Pressure measured from the surrounding atmosphere is
called the
gage
pressure,
and if measured
from
the ab-
solute vacuum, it is called the
absoZute pressure.
Its unit is either
psi
or
inches
of
water:
1 atm
=
14.7
psi
=
407
inches of water
=
1
bar
Internal
energy
(u,
U)
is the energy associated with the
existence
of
matter
and is unrelated to
its
position
or
velocity
(as represented by potential and kinetic energies). It is a
function of temperature alone, and does not depend on the
process or path taken to attain that temperature. It is
also
hown
as
specific internal energy.
Its unit is
Btunbm.
An-
other form of internal energy
is
called the
molar internal
54
Rules
of
Thumb
for
Mechanical Engineers
eneqy,
and is represented as
U.
Its
unit
is
Bwpmole.
These
two
are
related by u
=
UM;
u
is an intensive property like
p, v, and T.
Enthalpy
(h,
H)
is a property representing the total use-
ful
energy content in a substance.
It
consists of
internal
en-
ergy
andflow
energy
pV. Thus,
H
=
U
+
pV/J (Btcdpmole)
h
=
u
+
pv/J (Btu/lbm)
Like internal energy, enthalpy also has the unit
of
energy,
which is force times length. But they are expressed in the
heat equivalent of energy, which is Btu in the
U.S.
cus-
tomary system and Joule in the metric system.
The J term above is called the
Joule's
constant.
Its
value
is
778
ft.lbf/Btu.
It
is used to cause the
two
energy
com-
ponents in enthalpy
to
have equivalent
units.
Enthalpy,
like internal energy, is
also
an intensive property that is a
function only
of
the state of the system.
Entropy
(s,
S)
is a quantitative measure
of
the degra-
dation that energy experiences
as
a result
of
changes in the
universe.
In
other words, it measures
unavailable enerm.
Like energy,
it
is
a conceptual property that cannot be
measured directly. Because entropy is used to measure the
degree of irreversibility,
it
must remain constant
if
changes
in the universe
are
reversible, and must always increase dur-
ing irreversible changes.
For an isothermal process (at constant temperature To),
the change in entropy is a function of energy transfer. If Q
is the energy transfer per lbm, then the change in entropy
is given by:
Q
To
AS=-
Nonisothermal processes follow these relationships:
AS+
dQ
T
R
J
s2
-
s,
=
cp In (T2/T1)
-
-
In (pJpJ
R
J
s2
-
sI
=
c, In (T2/T,) +-In (v,/v,)
Specific heat
(C): The slope of a constant pressure line
on
an h-T plot is called
specific
heat
at constant pressure,
and the slope at constant volume on a u-T plot is
called
spe-
cific heat at constant volume.
C,
=
WdT, C,
=
du/dT
R=C,-C,,
k=CdCy
because du
=
dh
-
RdT for an ideal gas. Values of C,, C,,
k,
and
R
for a few gases are given in Table
1.
R
is
in
ft
-
lbf/lbm
-
OR, and C,, C,
are
in Btu/lbm
-
OF.
Latent heats
is defined
as
the amount of heat added per
unit
mass
to change the phase of a substance at the same
pressure. There is no change in temperature during
this
phase change process. The heat released or absorbed by a
mass
m is
Q
=
m(LH), where
LH
is the latent heat. If the
phase change is from solid to liquid, it is called the
latent
heat
offision.
When
it
is
fiom
liquid to vapor,
it
is called
the
latent heat
of
vaporization.
Solid-to-vapor transition is
known
as
the
latent heat
of
sziblimation.
Fusion and va-
porization values for water at
14.7
psi
are
143.4 and
970.3
Btdlbm, respectively.
Table
1
Gas Properties
Gas
Mol.
Wt
~
Acetylene
26.00
Air
29.00
Ammonia
17.00
Carbon dioxide
44.00
Carbon monoxide
28.00
Chlorine
70.90
Ethane
30.07
Helium
4.00
Hydrogen
2.00
Methane
16.00
Nitrogen
28.00
omen
32.00
Propane
44.09
steam
18.00
Sulphur dioxide
64.1
0
CP
0.350
0.240
0.523
0.205
0.243
0.1
15
0.422
1.250
3.420
0.593
0.247
0.21
7
0.404
0.460
0.1
54
c,
0.2737
0.1 71 4
0.4064
0.1 599
0.1721
0.0885
0.3570
0.7540
2.4350
0.4692
0.1
761
0.1
549
0.3800
0.3600
0.1
230
k
R
1.30 59.4
1.40 53.3
1.32
91.0
1.28 35.1
1.40 55.2
1.39
21.8
1.18 51.3
1.41 766.8
1.40 48.3
1.28
85.8
1.66 386.3
1.32 96.4
1.40
55.2
1.12
35.0
1.26
24.0
Thennodynamics
55
~~
Determining Properties
Ideal
Gas
A
gas
is
considered
ideal
when it obeys
certain
laws.
Usu-
ally, the gas at very low pressurehigh temperature will fall
into
this
state.
One
of
the laws is Boyle’s law: pV
=
constant;
the other
is
Charles’ law: V/T
=
constant. Combining these
two
with Avogadro’s hypothesis, which
states
that “equal vol-
umes of different gases with the same temperature and
pressure contain the same number of molecules,” we arrive
at the general law for the ideal gas (equation of
state):
P,R*
T
where R*
is
called the
universal
gas
constant.
Note that
R*
=
MR, where M is the molecular weight and R is the
specific gas constant. If there
are
n moles, the above equa-
tion may
be
reformatted:
pV
=
nR*T
=
mRT
where m
is
the
mass:
m
=
nM.
stant, in different units:
Table
2
provides the value of
R*,
the universal gas con-
Table
2
Universal Gas Constant Values
Value
of
R*
Unit
1.314
1.9869
1545
0.7302
8.31
44
1.9872
(atm
ft?)/(lb
-
mol
OK)
BTU/(lb
-
mol
OR)
(Ibf
-
ft)/(lb
-
mol
“R)
(atm
fP)/(lb
-
mol
OR)
J/(gm
-
mol
OK)
cal/(gm
-
mol
“10
~ ~~~~
Van der
Waals
Equatlon
The ideal gas equation may be corrected for its two
worst assumptions, i.e., infinitesimal molecular size and no
intermolecular forces, by the following equation:
where
ah’
accounts for the intermolecular attraction forces
and b accounts for the finite size of the gas molecules.
In theory, equations
of
state may
be
developed that
re-
late any properzy of a system to any two other properties.
However, in practice, this can
be
quite cumbersome.
This
is why engineers resort to property tables and charts that
are
readily available. Following
are
some of the most wide-
ly used property charts:
9
p-v diagram:
Movement along an isotherm represents
expansion or compression and gives density or specific
volume
as
a
function of pressure (see Figure 1). The
re-
gion below the critical isotherm
T
=
T, corresponds to
temperatures below the critical temperature where it is
possible to have more than one phase in equilibrium.
T-s
diagram:
This is
the
most useful chart in repre-
senting the heat
and
power cycles (see Figure
2).
A
line
of constant pressure
isobar
is shown along with the crit-
ical isobar
P
=
P,.
This chart might also include lines
of constant volume
(isochores)
or constant enthalpy
(isenthalps)
.
critical
isobar
T
I
S
Figure
2.
The
T-s diagram.
56
Rules
of
Thumb
for
Mechanical Engineers
h-s
&gm:
This
is
also
called the
MoUier
chart
(Fig-
ure
3).
It is
used
to determine property changes between
the superheated vapor and the liquid-vapor regions.
Below
the
saturation line, lines
of
quality (constant
Fisobars (psi)
std
atmosphere
(1
4.7
psi)
constant
superheat
(‘F)
Entropy
S
(Btu/lb.“R)
Figure
3.
The Mollier chart
(h-s
diagram}.
moisture content)
are
shown. Above it
are
the lines of con-
stant superheat and constant temperature. Isobars are also
superimposed on top.
The properties may also be found through various tables
with greater accuracy. These are:
Steam
tables, which give specific volume, enthalpy, en-
tropy, and internal energy as functions
of
temperature.
Superheat tables, which give specific volume, enthalpy,
and entropy for combinations of pressure and temper-
ature. These
are
in the superheated regime.
Compressed liquid tables, which give properties at the
saturation state and corrections to these values
for
var-
ious pressures.
Gas tables, which are essentially superheat tables for
various gases. Properties
are
given
as
functions
of
tem-
perature alone.
Types
of
Systems
Matter enclosed by a well-defined boundary is called a
thermodynamic
system.
Everythmg outside is called the
en-
vironment.
The volume of the enclosed region
is
called the
control
volume,
and its
surface
is the
control
surj4uce.
If
there
is
no
mass
exchange
across
the
boundary,
it is called a
closed
system as opposed
to
an
open
system. The most important
system is a “steady flow open system,” where the rate
of
mass exchange at the entry and exit are the same. Pumps,
turbines, and boilers fall into
this
category.
Types
of
Processes
A process is defined in terms of specific changes to
be
accomplished.
Two
types of energy transfers may take
place across a system boundary: thermal energy transfer
(heat) and mechanical energy transfer (work).
Any
process
must have a well-defined objective for energy transfer.
Below are definitions of well-known processes and the
relationships between variables
in
the
processes. The equa-
tions
are
in a per lbm basis, but can be converted to a lb
-
mol basis by substituting
V
for v,
H
for h, and R* for R:
Isothermal:
a constant temperature process (T2
=
T1).
P2
=
Pl(Vl/VZ)
v2
=
Vl@l/Pd
Q
=
W
=
T
(s2
-
sl)
=
RT In (v2/v1)
W
=
Q
=
T
(s2
-
sl)
=
RT
In
(v2/v1)
u2
=
u1
s2
=
s1
+
(QE)
=
R
In (v2/v1)
=
R In (pl/pZ)
h2
=
hi
Thermodynamics
57
Adiabatic:
a process during which no heat is transferred
between
the
system and
its
surroundings
(Q
=
0).
Many real
systems in which there is little time for heat transfer
may
be
assumed
to
be
adiabatic. Adiabatic processes can further
be
divided into two categories: isentropic and isenthalpic.
1
P2 =PI (vI/v2)k
=
P1
VPl)
v2
=
v1 (P1/P2)1k
=
Vl
V02)
IFr
T2
=
T1 (vI/v~)~-
=
TI (p2/p1)?
Q=O
Isenthalpic:
a constant enthalpy process (steady flow).
Also
known as a throttling process
(Q
=
0,
W
=
0).
PZVZ
=
pivi,
~2
pi, v2
>
vir Tz
=
Ti
u2
=u1
q
=
SI+
R
In
(pl/p2)
=
s1
+
R In (vz/vl)
h2
=hi
Polytropic:
a process in which the working fluid proper-
ties obey the polytropic law: plvp
=
p2vf.
U
I
P2
=
P1
(vl/v2)n
=
P1 (T2flI)
~2
=
VI
@1/p~)""
=
VI
(TJI'Z)
T2
=
T1 (vI/v.#-
=
T1 (p2/p1)
*
Q
=
c,
(n
-
k) (T2
-
Tl)/(n
-
1)
W
=
R (TI
-
T2)/(n
-
1)
=
(pl v1
-
p2 v2)/(n
-
1)
=
PlVl
n-
1
-
[1
-
@2/Pl)?l
The
Zeroth
law
of
Thermodynamics
The Zeroth Law of Thermodynamics defines tempera-
ture.
This
law states that heat flows from one source to an-
other only if there is a temperature difference between the
two. Therefore, two systems
are
in
thermal equilibrium
if
they
are
at the same temperature.
58
Rules
of
Thumb
for
Mechanical Engineers
FIRST
LAW
OF THERMODYNAMICS
The first law of thermodynamics establishes the principle
of conservation of energy in thermodynamic systems.
In
thermodynamics,
unlike
in
purely
mechanical
system,
trans-
formation of energy takes place between different sources,
such as chemical, mechanical, and electrical. The two basic
forms of energy transfer
are
work
done
and
heat trunsfel:
~
Work
Work may be done by (WOuJ or on (W$, a system.
In
thermodynamics, we
are
more interested in work done by
a system
W,,,
considered
positive,
which causes the energy
of the system to reduce. Work is a path function. Since it
stance, it is not a property of the system. In a p-v diagram,
work is the following integral:
does not depend on the state of the system or of the sub-
W0”t
=
pv
Heat
Heat is the thermal energy transferred because of tem-
perature difference. It is considered positive if it is added
to the system, that is,
QiW
A
unit of heat is the same as en-
ergy, that is, ft.lbf; but a more popular format is Btu:
lBtu
=
778.17/ft.lbf
=
25Ucalories
=
l,055/Joules
Like
work,
it is a path function, and not a property of the
system.
If
there is no heat transferred between the system
and the surroundings, the process is called
adiabatic.
First
law
of
Thermodynamics
for
Closed
Systems
Briefly, the first law states that “energy can not be cre-
ated or destroyed.” This means
that
all forms of energy
(heat
and work) entering or leaving a closed system must be ac-
counted
for.
This
also means that heat entering a closed sys-
and/or be
used
to
perform useful work
W
W
J
Q
=
*U
+
-
tem must either increase the temperature
(in
the form of
u>
Note that the Joule’s constant was used to convert work to
its heat equivalent (ft.lbf to Btu).
First
Law
of
Thermodynamics
for
Open Systems
The law for open systems is basically Bernoulli’s equa-
tion extended for nonadiabatic processes. For systems
in
which the
mass
flow rate is constant,
it
is known as the
steady
flow
energy
equation.
On a
per
unit
mass
basis,
this equation is:
Both
sides
may
be multiplied by
the
mass flow rate (qot)
to get the units in Btu or be multiplied by
(qotJ)
to get the
units
in
ft
-
lbf.
The above equation may
be
applied to any thermody-
namic device that is continuous and has steady flow, such
as turbines, pumps, compressors, boilers, condensers, noz-
whti
22
+-
v2
-
v1
+
g(z2
-
z1)
Q=(h,-h,)+-
2gJ gJ J des,
or
throttling devices.
Thermodynamics
59
SECOND LAW
OF
THERMODYNAMICS
All thermodynamic systems adhere
to
the principle of
conservation of energy (the first law). The second law de-
scribes the restrictions to all such processes, and
is
often
called the Kelvin-Planck-Clausius Law. The statement of
this law: “It is impossible to create a cyclic process whose
only effect is
to
transfer heat from a lower temperature to
a
higher temperature.”
Reversible
Processes
and
Qcles
A reversible process is one that can
be
reversed without
any resultant change in either the system or the surround-
ings; hence,
it
is also an ideal process. A reversible process
is always more efficient than an irreversible process. The
four phenomena that may render a process irreversible
are:
(1)
friction,
(2)
unrestrained expansion,
(3)
transfer
of
heat across a finite temperature difference, and
(4)
mixing
of different substances.
A
cycle
.is
a series of processes in which the system aI-
ways returns to the same thermodynamic state that
it
start-
ed from. Any energy conversion device must operate in a
cycle. Cycles
that
produce work output
are
called
paver
cy-
cles,
and ones that pump heat from lower to higher tem-
perature
are
called
refrigeration cycles.
Thermal efficien-
cy for a power cycle is given by:
rlulermal=-
wat
,
qh
=
Wou,
+
Q,
whereas the
coeflcients
of
pe$omnce
for refrigerators and
heat pumps are
defmed
as
%pi,
and
Qoflm,
respectively.
Q
in
Thennodynamic Temperature Scale
If
we run a Carnot cycle engine between the temperatures
corresponding to boiling water and melting ice, it can
be
shown that the efficiency of such an engine will be
26.8%.
Although water is
used
as
an
example, the efficiency of such
an engine is actually independent of the working fluid
used in the cycle. Because
q
=
1
-
(Q/QH),
the value of
QL/&
is
0.732.
This sets up both
our
Kelvin and Rankine
scales once we establish the differential.
In
Kelvin scale, it
is
100
degrees;
in
Rankine scale, it is
180
degrees.
Useful
Exnrmions
Change in internal energy:
du
=
T
ds
-
P
dv
Change in enthalpy:
dh
=
T ds
+
v
dp
Change in entropy:
ds
=
c,dT/T
+
Rddv
Volumetric efficiency
is
a measure of the ability of an
engine to ‘’breathe,” and may be determined from the
following equation:
9”
=
volume
of
air brought into cylinder at ambient
conditions
piston displacement
Mean effective pressure (mep) is net work output, in
inch-lbf per cubic inch of piston displacement.
It
is ap-
plicable only to reciprocating engines, and effectively
is the average gage pressure acting on the piston dur-
ing a power stroke.
Work done:
(mep)
(Vh,)
=
(mep)
n:
(bore)* (stroke)/4
Brake-specific fuel consumption
(bsfc):
fuel rate
in
lbrn/hr
bsfc
=
bhP
60
Rules
of
Thumb
for
Mechanical Engineers
THERMODYNAMIC
CYCLES
A
thermodynamic cycle can be either open or closed. In
an open cycle, the working fluid is constantly input to the
system
(as
in
an
aircraft jet engine); but in a closed cycle,
the
working fluid recirculates
within
the
system
(as
in a
re
frigerator).
A
vapor
cycle is one in which there is a phase
change in the working fluid.
A
gas
cycle is one in which
a gas
or
a
mixture
of gases is
used,
as
the fluid that does
not undergo phase change.
~~
Basic Systems and
Systems
Integration
While, in theory, a cycle diagram explains the thermo-
dynamic cycle, it takes a real device
to
achieve that ener-
gy exeon
proce~s-
The change of~roperty equations for
these devices Can
be
derived
frOm the Steady-flow energy
equation. Following is a list
of
these devices:
Heat
exchangers:
transfer energy from one fluid to
Pumps:
considered adiabatic devices that elevate the
Turbines:
adiabatic extraction of energy from the fluid
Compressors:
similar
to pumps in principle.
CondemerS: remove h&
of
evap~~
from
fluid and
des:
Convert the fluid energy to kinetic energy;
with
a drop in temperature and pressure.
reject to the environment.
adiabatic; no work
is
performed.
another.
total energy content
of
the fluid.
Carnot Cycle
The Carnot cycle (Figure
4)
is an ideal power cycle, but
it
cannot
be
implemented in practice. Its importance lies in
the fact that it sets the
maximum
attainable thermal effi-
ciency for any heat engine. The
four
processes
involved
are:
1-2 Isothermal expansion of saturated liquid
to
saturated
gas
2-3 Isentropic expansion
3-4
Isothermal compression
4-
1
Isentropic compression
The heat flow in and out of the system and the turbine
and compressor work terms
are:
=
Thigh
(~2
-
SI)
=
h2
-
hi
Qout
=
TIOW (s3
-
s4)
=
h3
-
h4
Wmm,
=
h1-
h4
WM
=
hz
-
h3
The thermal efficiency
of
the cycle
is:
Entropy
S
Figure
4.
Camot
cycle.
Thennodynamics
61
Rankine
Cycle:
A
Vapor
Power
Cycle
The Rankine cycle (Figure 5) is similar to the Carnot
cycle. The difference
is
that compression
takes
place
in
the
liquid region. This cycle
is
implemented
in
a steam power
plant. The five processes involved
are:
1-2
Adiabatic compression to boiler pressure
2-3
Heating to fluid saturation
temperature
3-4
Vaporization in the boiler
4-5
Adiabatic expansion in the turbine
5-
1
Condensation
hut
Turbine
w
Condenser
Qio
Win
The heat flow
in
and out of the system and the turbine
and compressor work
terms
are:
9in=h-h2 qout=hs-hl
WM
=
-
hs
W,,,
=
h2
-
hl=
vi
@z
-
pl)/J
The thermal efficiency
of
the cycle is:
isotherm
T
condenser temp.
Figure
5.
Rankine cycle.
Reversed
Rankine Cycle:
A
Vapor
Refrigeration
Cycle
The reversed Rankine cycle
(Figure
6)
is
also
similar to
the Carnot cycle. The difference is that compression takes
place
in
the liquid region. This cycle is implemented
in
a
The heat
flow
in
and out of the system and the turbine
and compressor work
terms
are:
steam power plant. The four processes involved are: qin=hl-hq qout=h2-h3
whrb
=
hl
-
h2
Wcomp
h4
h3
1-2
Isentropic compression; raise temperature
and
pressure
2-3
Reject heat to high temperature
3-4
Expander reduces pressure and temperature to
initial
The thermal efficiency
of
the cycle
is:
value
4-1
Fluid
changes
dry
vapor at constant
pressure;
heat
-
qin
-
qout
=
(h1-
h4
1
-
(h2
-
h3
1
rlthermal
-
added qin
hl
-h4
62
Rules
of
Thumb
for
Mechanical Engineers
T
p&+qw
Compressor
Wcomp
Inlet Exhaust
Qo,t
(to
room air)
4
2d4
1
Condenser
4
Win
Evaporator
Qin
4
t
S
Figure
6.
Reversed Rankine cycle (vapor refrigeration system).
Brayton
Cycle:
A
Gas
Turbine Cycle
The Brayton cycle (Figure
7)
uses
an air-fuel
mixture
to
keep the combustion temperature
as
close to the metallur-
gical limits as possible.
A
major portion of the work out-
put
from
the turbine is used to drive the compressor. The
remainder may
be
either shaft output (perhaps to drive a pro-
peller, as in a turboprop, or drive a fan, as in a turbofan) or
nozzle expansion to generate
thrust
(as
in
a turbojet engine).
The four processes involved are:
1-2
Adiabatic compression (in compressor)
2-3
Heat addition at constant pressure
(in
combustor)
3-4
Adiabatic expansion (in turbine)
4-1
Heat rejection at constant pressure
Fuel
1
Combustion
rb[
Chamber
17
The heat flow into the system and the turbine and corn
pressor work output terms are:
qin=
cP (T3
-
T2)
=
h3
-
h2
wurb
=
cp
0-3
-
T4)
=
h3
-
h4,
WCmp
=
cP (T2
-
TI)
=
h2
-
hl
The thermal efficiency of the cycle is:
3
Figure
7.
Brayton
cycle (gas turbine engine).
Thermodynamics
63
Otto
Cycle:
A
Power Cycle
The Otto cycle (Figure
8)
is a four-stroke cycle
as
rep-
resented by an idealized internal combustion engine. The
four processes involved are:
1-2
Adiabatic compression
2-3
Heat addition at constant volume
3-4
Adiabatic expansion
4- 1
Heat rejection at constant volume
The heat
flow
in and out of the system and
the
wmk input
and work output terms
are:
T
3
V
v2
"1
S
Figure
8.
Otto
cycle (ideal closed system).
Diesel
Cycle: Another Power Cycle
In a diesel engine, only air is compressed; fuel is
htro-
duced only at the end of the compression
stroke.
That is why
it
is often referred to as a compression-ignition engine.
This
cycle (Figure
9)
uses the heat
of
the compression
The heat flow in and out of
the
system and the
work
input
and work output terms
are:
qin
=
cP (T3
-
"2).
qout
=
C,
(T4
-
TI)
process to start the combustion process. The four process-
es involved
are:
Win
=
C,
(T2
-
TI),
Wout
=
C,
("3
-
T4)
+
(cp
-
cv)
Cr;
-
T2)
1-2
Adiabatic compression
2-3
Heat addition at constant pressure
3-4
Adiabatic expansion (power stroke)
4-
1
Heat rejection at constant volume
The thermal efficiency of the cycle is:
64
Rules
of
Thumb
for
Mechanical Engineers
r
3
1
I
V
Figure
9.
Diesel
cycle.
S
6as
Power
Cycles
with
Regeneration
Use
of
regeneration is
an
effective way
of
increasing the
thermal efficiency
of
the cycle, particularly at low com-
pressor pressure
ratios.
The Stirling and Ericsson cycles
are
such attempts to get efficiencies close to that
of
the ideal
Camot cycle.
Stirling
Cycle
This
cycle (Figure
10)
can come
to
attain the thed ef-
ficiency very close
to
that of a Camot cycle. The isother-
mal
processes can be attained by reheating and intercool-
ing.
This
cycle
is
suitable for application in reciprocating
machinery. The four processes involved are:
P
Qout
1-2
Heat addition at constant volume (compression)
2-3
Isothermal expansion with heat addition (energy
input and power stroke)
3-4
Heat rejection at constant volume
4-1
Isothermal compression with heat rejection
In
an
ideal regenerator, the quantity
of
heat rejected
during
3-4
is stored in the regenerator and then is restored
to the working fluid during the process 1-2. But in reality,
there is
some
loss in between.
The heat
flow
in
and out of
the
system and the wmk input
and work output terms
are:
V
Figure
IO.
Stirling
cycle.
S