Safety at Work 6 E Part 6 ppt
Bạn đang xem bản rút gọn của tài liệu. Xem và tải ngay bản đầy đủ của tài liệu tại đây (418.02 KB, 60 trang )
The collection and use of accident and incident data 275
Whichever method of trend analysis is used, a check should be made
that any change in direction is more than a random fluctuation.
Suppose that in a particular year there were 100 accidents in a company
and that in the following year the company proposed to carry out the
same amount of work with no changes which would affect risk. In these
circumstances, we would expect around 100 accidents in the year
following the one for which records were available. Note that we would
not expect exactly 100 accidents, but around 100 accidents. If there were 99
accidents or 101 accidents we would be able to say that this was due to
random fluctuation and, more generally, anything between say 95 and
105 accidents could also be random.
The difficulty arises when the number of accidents reaches 85 or 90. Are
these numbers due to random fluctuation, or is someone doing
something which is improving risk control and influencing the accident
numbers? Statisticians refer to fluctuations in numbers which cannot
reasonably be attributed to random fluctuation as ‘significant’ when they
may make statements like: ‘There is only a 5% chance that the
improvement in accident performance is due to random fluctuations’, or
‘This deterioration in accident performance would have occurred by
chance in only 1% of cases’.
The working out of the significance of fluctuations in numbers has
practical importance in the more advanced techniques of loss manage-
ment since we can only draw valid conclusions when we know whether
or not particular fluctuations in numbers are significant. For this reason,
it is valuable to have some idea of the significance of fluctuations and
trends. One way of doing this is to use historical accident data and work
out upper and lower limit lines, based on the mean of these data. If we
used this technique on the data shown in Figure 2.5.9, we could draw up
a chart for 2002 which would look like the one shown in Figure 2.5.10.
As the monthly accident figures for 2002 become available, they are
plotted on the chart in the usual way. Monthly numbers of accidents
which are within the limit lines are defined as random fluctuations. Only
if the number of accidents is above the upper limit line, or below the
lower limit line, is the fluctuation considered significant.
Using this type of upper and lower limit line has practical advantages
since it can prevent resources being expended on attempts to reduce
Figure 2.5.10 Illustration of upper and lower limit lines
276 Safety at Work
increases in accidents which are purely random. While it might be argued
that no resources spent on attempts to reduce accidents are wasted,
resources are always limited and it is preferable to use them where there
is good statistical evidence that they will do the most good.
The details of the calculations required for upper and lower limit lines,
and related statistical techniques such as confidence limits and control
charts, are beyond the scope of the present chapter, but details can be
found in references 4 to 7 inclusive.
2.5.5.2.2 Trend analysis with variable conditions
So far, for the sake of simplicity, we have assumed that everything has
remained stable in the organisation. In the real world, however, things
rarely remain the same for any length of time and we need methods of
trend analysis which can take this into account.
In an ideal world, we would be able to measure changes in risk in an
organisation and hence determine how well the risk was being managed.
For example, the measures would enable us to say such things as ‘despite
a 50% increase in risk due to additional work being done, the accidents
increased by only 25%’, or ‘there was a 10% reduction in risk because of
the new machines and work procedures, but accidents increased by
5%’.
Unfortunately, it is rarely possible to measure risk in this sort of way so
what we have to do in practice is to find some proxy for risk which we
can measure and use instead. Two such proxy measures in common use
are numbers of people employed and numbers of hours worked which
are used to calculate two accident rates.
᭹ Incidence rate. This index gives the number of accidents for 1000
employees and is used to take into account variations in the size of the
workforce:
Incidence rate =
Number of accidents ϫ 1000
Number employed
᭹ Frequency rate. This index gives the number of accidents for every
100 000 hours worked and takes into account variations in the amount
of work done, and allows for part-time employees.
Frequency rate =
Number of accidents ϫ 100 000
Number of hours worked
There are, however, a number of problems with these accident rates.
᭹ Terminology. Although the versions given above are in general use,
there is no universal agreement as to the basic formula. A rate
cannot be interpreted unless the equation on which it was based is
known.
᭹ Definitions. There is no general agreement on what constitutes an
‘accident’, with some organisations basing their rates on only major
The collection and use of accident and incident data 277
injuries, while others use both major and minor injuries. Similarly,
there is no general agreement on what constitutes an employee –
incidence rates can be reduced by employing more part-time people!
Hours present similar problems, with different types of hours having
significantly different types of risk. For example, ‘working’ time, when
the risk is high, versus ‘waiting’ time, when the risk is low. Also, ‘staff’
do not normally book their time although they can face the same risks
as hourly paid employees.
᭹ Multipliers. There is no general agreement on which multipliers should
be used and it is normal to select one that suits the particular
organisation.
In general, the value of accident rate figures depends on the quality of
the data on which they are based and the honesty of the person preparing
them. Quoted rates should always be treated with caution until the basis
of the calculation has been determined.
Using incidence and frequency rates enable sensible trend analyses to be
carried out during periods when changes are being made in the
organisation that affect the number employed or the amount of work
being done and, used properly, they can provide useful safety
information.
These rates also enable us to make comparisons between one
organisation and another, or between different parts of the same
organisation, i.e. enable comparative analyses to be made.
2.5.5.2.3 Comparisons of accident data
It is only possible to make valid comparisons when there is some measure
of the risk being managed. When the numbers employed or the hours
worked are taken into account, these are only a proxy for risk and are
used because we can measure them, rather than because they are good
indicators of risk.
Considering two organisations, each with a frequency rate of 100, this
could be because:
᭹ The organisations have roughly equal levels of risk and are managing
them equally effectively.
᭹ One organisation has high levels of risk and is managing them well,
while the other organisation has low levels of risk and is managing
them badly.
This should be borne in mind when making, or interpreting, comparisons
of accident data since it is a fundamental weakness of such comparisons.
In general, a comparison will be valid only to the extent that the risk
levels in the organisations being compared are equal.
Having dealt with this caveat, the types of comparison which can, with
reason, be made are:
᭹ Comparisons between parts of the same organisation. In theory, these are the
simplest and potentially most accurate comparisons. This is because
278 Safety at Work
the measurement of risk, the definition of what has to be reported,
reporting procedures, and methods of calculation are all under the
organisation’s control and can be standardised. However, the value of
this comparison depends on the effectiveness of the reporting, which
may not be consistent throughout the organisation.
᭹ Comparisons between one organisation and another. Industries in the same
sector can compare accident data one with another, assuming that they
are willing to do so. In the UK, for example, there are national
associations for particular industry and service sectors which provide
a forum for comparing accident data. More formally, there have been
moves recently to include accident data in ‘benchmarking’ exercises
where organisations compare various aspects of their performance
with those of their competitors.
᭹ Comparisons between an organisation and the relevant industry or service
sector. Some trade organisations publish aggregated data on accidents
for their industry or service sector giving, for example, the ‘average’
frequency and incidence rates for a particular year. Examples of these
sorts of accident data for the UK are published by the HSE annually
8
.
The HSE’s Epidemiology and Medical Statistics Unit also produces
statistics on occupational ill health.
᭹ Comparisons between countries. Where appropriate data are available,
comparisons can be made between accidents in one country and
another, either for the country as a whole, or by industry or service
sector. However, there are major variations in accident reporting
procedures between countries so that comparisons of this type should
be made with great care.
A particular problem with all of these comparisons is that there is no
consistency about what constitutes an ‘accident’ and it should be
remembered that this was one of the problems with any comparison of
incidence and frequency rates. One way of improving comparisons is to
calculate a rate which takes into account the severity of the accidents, i.e.
the number of days lost per accident, to give the mean duration rate:
Mean duration rate =
Number of days lost as a result of x accidents
x accidents
This mean duration rate can be used in trend analysis in the same way as
other rates. A disadvantage of it is that it can give a misleading picture
since it can show a decrease when the numbers of days lost is increasing,
i.e. more accidents but fewer days lost per accident.
For this reason, some organisations use an alternative severity rate:
Severity rate =
Number of days lost as a result of accidents
Number of hours worked
The final point to make on comparisons is that the rates described above
should, when the relevant data are available, be used in conjunction with
each other. This is because they do not necessarily give the same result, as
is illustrated, using simplified data, in Table 2.5.2.
The collection and use of accident and incident data 279
2.5.5.2.4 Accidents and incidents as a measure of risk
Accurate accident and incident data will provide a measure of what has
gone wrong in the past, and allow comparisons over time (trend
analyses) and comparisons between one organisation and another. What
these data will not do, even if they are accurate, is to provide a measure
of risk.
Information on the number of accidents gives us very little information
about risk. Two organisations can have the same number of accidents
because one is managing high levels of risk very well, while the other is
managing low levels of risk very badly. Alternatively, because risk is
probabilistic, two organisations with the same levels of risk can have
widely different numbers of accidents because one was ‘lucky’ and the
other was not.
True levels of risk in an organisation can only be determined accurately
using appropriate risk assessment methodologies, details of which will be
found elsewhere in this book. However, more detailed discussion of the
relationship between accident and incident data and risk assessment data
will be found in section 2.5.8 of this chapter.
2.5.6 Epidemiological analysis
2.5.6.1 Introduction
The techniques of epidemiological analysis were first applied to the study
of disease epidemics and historical example will be looked at by way of
illustration to show how epidemiological techniques can be applied to
accident and incident data.
Typhoid plague was a major cause of death in cities for many years. No
one knew what caused the plague but many doctors looked for patterns
in where the epidemics occurred. This was done on a trial and error basis
with different people looking at where plague victims lived, what they
ate, and the work they did. Eventually it was discovered that plague
epidemics were centred around certain wells from which the city
dwellers of those days obtained their drinking water. It was also found
Table 2.5.2 Comparisons using incidence, frequency and severity rates
ABCD
Number of accidents 100 80 60 20
Numbers employed 100 40 60 20
Incident rate 1000 2000 1000 1000
Hours worked 10 000 8000 3000 2000
Frequency rate 1000 1000 2000 1000
Days lost 100 80 60 40
Mean duration rate 1 1 1 2
Severity rate 0.01 0.01 0.02 0.02
280 Safety at Work
that closing these wells stopped the spread of the plague in those areas.
Although no one knew why the wells, or the water from them, was
causing the plague, they had found an effective way of stopping the
plague spreading. In fact, it was many years before the water-borne
organisms responsible for plague infection were identified.
This example illustrates the essential elements of epidemiological
analysis. It is the identification, usually by trial and error, of patterns in
the occurrence of a problem which is being investigated. These patterns
can then be analysed to see whether causal factors can be identified and
remedial action taken.
Epidemiology is used to identify problems which would not be
apparent from single incidents. For example, if accidents occurred more
frequently at a particular type of location, the records provide a guide to
where investigation will be most fruitful and cost effective, although they
provide no information on the possible causes.
2.5.6.2 Techniques of epidemiological analysis
Epidemiological analysis is only possible when the same type of
information (data dimension) is available for all (or a substantial portion)
of the accidents being analysed. Typical data dimensions include location
and time of the accident or incident, the part of the body injured in an
accident and the nature of the injury.
The simplest form of epidemiological analysis is single dimension
analysis. This involves comparing incidents in the population on a single
data dimension, for example time of occurrence or nature of injury. The
analyst would look for any deviation from what would reasonably be
expected. For example, if work is spread evenly over the working day, we
would expect times of injuries also to be spread evenly. Where peaks and
troughs are found in accident occurrences, these should be investigated.
The analysis is slightly more complicated when an even spread is not
expected as the analyst has to carry out preliminary work to determine
the expected spread.
The analyst will look for both over-representation and under-repre-
sentation when carrying out the analysis. Both should be investigated,
over-representation because it suggests that there are risks which are
being managed poorly, under-representation since it suggests either a
degradation in the reporting and recording system, or particularly
effective management of risk from which others might learn.
The principles and practices described above for single dimension
analysis can also be applied to two or more dimensions analysed
simultaneously, this is referred to as multi-dimensional analysis. This type
of analysis can identify patterns which would not be apparent from
analysing the data dimensions separately and examples include part of
body injured analysed with department, and time of day analysed with
nature of injury.
Full-scale epidemiological analysis of a set of data will involve analysis
of all of the single data dimensions separately and analysis of all of the
possible combinations of these single dimensions. For this reason,
The collection and use of accident and incident data 281
epidemiological analysis is a very time consuming process and where
more than a trivial number of data are involved, the only practical
approach is to use a computer. Suitable software for epidemiological
analysis is described later in the chapter.
The epidemiological analysis merely identifies patterns in data
distribution, it does not give information on why these patterns are
occurring. This can only be determined by appropriate follow-up
investigations and these are dealt with in the section on accident
investigation.
2.5.6.3 Epidemiological analysis with limited data
The fact that the detailed data described earlier as necessary for full-scale
epidemiological analysis does not prevent the techniques being applied
to information that had already been gained.
Valuable results can often be obtained simply by tabulating accident
data for the past two or three years and looking for patterns in accident
occurrence. It is also worth trying to discover if there were no accidents
for particular places, times, people, etc. since this can provide clues on
non-reporting or effective risk control measures.
2.5.7 Accident investigation
2.5.7.1 Introduction
Accident investigations can be carried out for a number of reasons,
including:
᭹ Collecting the information required for reporting the accident to the
enforcing authorities.
᭹ Establishing where the fault lay.
᭹ Obtaining the information required to pursue, or defend, a claim for
damages.
᭹ Obtaining the information necessary to prevent a recurrence.
In theory, a thorough investigation will result in the collection of the
information required to satisfy all of these purposes but, in practice, this
is rarely the case. If, for example, the primary purpose is to collect the
information required for accident notification then the investigation is
usually stopped when the relevant information has been collected,
whether or not this information includes that required for the prevention
of a recurrence. When the primary purpose is to establish where the fault
lay, if this is allowed to extend to who was responsible, there may be an
additional problem in that the investigation may become adversarial, that
is, the investigators are on one ‘side’ or the other, for example the
employer’s ‘side’ or the injured person’s ‘side’. This can lead to biases in
data collection with, for example, information which does not support a
particular investigator’s ‘side’ being ignored or not recorded.
282 Safety at Work
The ideal investigation is, therefore, one which is neutral with respect
to fault and has the primary purpose of obtaining the information
necessary to prevent a recurrence.
In all accident investigations of this type there are two types of
information to collect:
᭹ Information about what happened which is usually factual and has
limited scope for interpretation, for example the date and time of the
incident, and what caused the injury, damage or other loss.
᭹ Information about why it happened is concerned with the causes of the
incident. It is more difficult to identify and more open to
interpretation.
This distinction between ‘what’ and ‘why’ corresponds with the
terminology used elsewhere to make roughly the same distinction.
Typical terms include:
᭹ Immediate or proximate causes are the direct causes of the injury, damage
or other loss.
᭹ Underlying or root causes are the reasons why the accident or incident
happened.
These terms are used throughout the remainder of this chapter.
Collecting information about what happened is the essential first step
in an investigation and must be completed before considering why it
happened.
2.5.7.2 Collecting information on what happened
The two main sources of information are observation of the accident site
and interviews with those involved (the injured person, witnesses, those
who rendered assistance and so on). Observation of the site is fairly
straightforward but interviewing is a skill which has to be learned. There
are a number of key points to be followed for good interviewing.
2.5.7.2.1 Interviewing for accident investigations
There are three important aspects of interviewing which have to be
considered:
᭹ Coverage
᭹ Keeping an open mind
᭹ Getting people to talk.
(a) Coverage
This aspect of interviewing deals with the nature and amount of
information which has to be collected, how to decide when all the
relevant information has been obtained and how to avoid collecting
information which is of no value?
The collection and use of accident and incident data 283
What is relevant and valuable will, of course, depend on the purpose of
the investigation and as a general guide, coverage should include all the
information necessary to enable a decision to be made about the
appropriate remedial action. However, in this first stage of the investiga-
tion, the purpose is to establish a clear idea of what happened. The
information required falls into two categories:
1 Information which is common to all types of incident and which is best
dealt with by using a pro-forma containing spaces for the information
required. The accident record form used for this purpose should
include information which gives:
᭹ Details of the incident – e.g. time, date and location.
᭹ Details of person injured – e.g. names, age, sex, occupation and
experience.
᭹ Details of the injury – e.g. part of body injured, nature of injury (cut,
burn, break etc.), the agent of injury (knife, fall, electricity etc.), and
time lost.
᭹ Details of asset or environmental damage – e.g. what was damaged,
nature of damage, and the agent of damage.
It is this type of information which is best used for the sorts of analyses
discussed earlier since it is common to all incidents and can, therefore,
be used for trend, comparison and epidemiological analyses.
2 Other information has to be recorded as a narrative and space for this
should be included on the accident record form. However, it is often
necessary for this brief summary to be supplemented by a more
detailed investigation report.
(b) Keeping an open mind
One of the main difficulties during an investigation is avoiding
assumptions about what has happened. The greater the experience of the
type of site involved, the nature of the work and the people, the more
likely is it that assumptions will be made. There is always the possibility
that an investigation will result in a summary of what was thought likely
to have happened, rather than what actually happened.
To avoid making assumptions questions should be asked about all
aspects of what happened, even if the answer is known. Perhaps even
especially when confident of what the answer will be!
Making assumptions can lead to forming an inaccurate picture of what
happened, which in turn can have serious implications if it leads to
suggestions for remedial actions which are wholly inappropriate. Where
possible remedial action is identified early in the investigation, this is a
warning sign that too many assumptions may have been made.
(c) Getting people to talk
Interviewees will volunteer information more readily if a rapport can
be established and maintained with them. Rapport is the term used to
describe the relationship between people which enables a ready flow
of conversation without nervousness or distrust. A wider range and
more accurate information can be collected when a rapport has been
284 Safety at Work
established with the people being interviewed. There are no techniques
which will guarantee that rapport is established, but the guidelines
listed below will make it more likely:
(i) Interview only one person at a time. It is difficult to establish rapport
with two or more people simultaneously since each will require
different responses. This may not be possible in some circum-
stances, for example if the person interviewed requests that a
representative attends. In these circumstances, the status of any
attendees should be clearly established at the start of the interview
including whether they are just observers, will be answering
questions on the interviewee’s behalf or whether they will be
entitled to interrupt.
(ii) Have only one interviewer at a time. ‘Board’ or ‘panel’ interviews
should be avoided since they require the interviewee to commu-
nicate with more than one person, and this is rarely successful.
Note, however, that there are many circumstances where it may
be necessary for more than one person to be involved in the
interview. For example, the employee’s representative may wish
to be involved. In these circumstances, the interviewer should
lead the interview and invite the second interviewer or repre-
sentative to ask questions at an appropriate point. This procedure
should be explained to the interviewee and his representative at
the start of the interview so that it has a minimal effect on
rapport.
(iii) Introduce yourself and explain the purpose of the interview. Do this even
if you have already been introduced by someone else. The
interviewee will gain confidence if he or she knows who you are
and why the interview is taking place. Emphasise that the primary
purpose of the interview is the prevention of a recurrence and that
action will be taken on the results of the investigation.
(iv) Check the interviewee’s name and the part they played in the incident.
This may sound obvious but checking before the interview can save
embarrassment later on. Confusion can arise when, for example,
more than one person has been injured, where more than one
accident has occurred in the same area, or where other interviews
are in progress for some different purpose, for example work
study.
(v) Start the interview on the interviewee’s home ground. The idea is to start
the interview with things which are familiar to the interviewee and
hence establish a rapport, then move on to the details of the
accident. This is helped by beginning the interview at the
interviewee’s place of work and talking about their normal job
before moving on to discussion of the accident.
It is important to establish rapport before moving on to collect detailed
information. If this is not done, the interview may degenerate into a series
of stilted questions and one word answers. This can also happen if
rapport is not maintained and there are a number of things which will
help maintain rapport:
The collection and use of accident and incident data 285
(vi) Prevent interruptions. Make sure the interview is not interrupted.
Interruptions come from other people and an effective way of
preventing this is by choosing a suitable place for the interview
where interruptions are unlikely. However, the interviewer can
interrupt the interview by stopping the interviewee to ask
questions. In general it is best to let the interviewee talk and ask
any questions when he or she gets to a natural break in their
story.
(vii) Use open questions rather than closed questions. Open questions are
ones which cannot be answered with ‘yes’ or ‘no’; closed questions
are ones which can be answered with a ‘yes’ or ‘no’. For example,
‘What was the noise level like?’ is an open question, ‘Was it noisy?’
is a closed question. In general, closed questions should be used
only to check on specific points already made by the interviewee.
(viii) Avoid multiple questions. For example, a question such as ‘Can you
tell me what everyone was doing at the time?’ is better asked as a
series of questions starting with ‘Can you tell me who was there at
the time?’ and then a single question about what each of them was
doing. Asking multiple questions is likely to result in only part of
the question being answered.
(ix) Keep your manner positive and uncritical. Interviewees will form an
opinion of your manner based on what you say and on your body
language. Avoid expressing your views and opinions during the
interview, especially if these are critical of what the interviewee has
done or not done. Similarly, avoid such obvious signs of lack of
interest as not listening, yawning or looking at your watch.
2.5.7.2.2 Recording the interview
It is essential that written notes are taken during an interview for a
number of reasons:
(a) So that what has been said is not forgotten. Most people believe that their
memory is much better than it really is. Few people can remember all
the relevant facts raised during even a short interview.
(b) So that there can be no confusion over what different people have said. In
most investigations more than one person will have to be interviewed
and unless notes are made of each interview it is unlikely that who
said what will be remembered, especially if there is a delay between
the interviews and writing the report.
(c) So that the interviewee’s narrative is not interrupted. The importance of
not interrupting was mentioned earlier. It is a help in avoiding this if
questions are written as they occur ready to be asked at a later and
more suitable time. This means that the interview is not interrupted
and the points to be raised are not forgotten.
Making notes during the interview is difficult at first but it is a skill,
and like all skills can be learned with practice. This skill should be
practised whenever possible, and the following should be borne in
mind:
286 Safety at Work
(i) Timing. Wait until rapport has been established before starting to take
notes. Establishing rapport is difficult enough without the added
distraction of note taking.
(ii) Agreement. Always tell the interviewee that notes will be taken and
get their agreement to this.
(iii) Content. Make notes of everything that is said. Even parts of what the
interviewee says that seem irrelevant should be recorded. Their
relevance should be judged when all the information has been
collected, from this and other interviews.
(iv) Take your time. Note taking shows the interviewees that what they are
saying is of interest. They do not consider it an interruption and are
usually happy to wait while notes are made.
(v) Review. At the end of the interview go over the notes with the
interviewee checking that what has been written down is an accurate
record of what has been said.
2.5.7.3 Collecting information on why things happen
Once what has happened in an accident has been clearly established, the
reason why it happened (the causes) can be investigated. There are
various approaches to ensuring adequate coverage of possible accident
causes and three options are described below:
1 One or more of the models of human error, such as the one devised by
Hale and Hale
9
, are summaries of the ways in which human beings
think and act and, in particular, how failures in thinking and acting can
result in errors. Familiarity with models of this type will help structure
an interviewer’s approach to the human error aspects of the accident or
incident.
2 The Domino Theory provides a succinct description of how the
organisational aspects of accident and incident causes link with
individual losses, and how human errors can be the result of
organisational arrangements. Familiarity with this theory and its
variants will help the interviewer avoid too narrow a concentration on
the role of the injured person to the exclusion of broader organisational
issues.
3 The approach described in an HSE publication
10
is particularly useful
for those organisations which have adopted the HSE’s Safety Manage-
ment System since it facilitates the identification of accident and
incident causes in terms of weaknesses in the existing Safety Manage-
ment System.
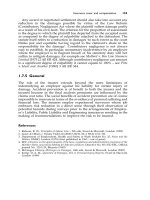
The next section describes, in outline, how one of these approaches, the
Domino Theory, can be used as a means of identifying more accurately
the required remedial actions.
2.5.7.3.1 The Domino Theory
There are various versions of the Domino Theory and the one illustrated
in Figure 2.5.11 is a generalised version. The basic idea behind the Domino
Theory is that individual errors take place in the context of organisations
The collection and use of accident and incident data 287
and a useful concept for illustrating them is a series of dominoes standing
on end.
If one of the dominoes to the left of the Loss domino falls, it will knock
over those to the right and a loss will occur. For example:
᭹ Lack of supervision (management control) results in a situation where
oil can be spilt and not cleared up.
᭹ An unsafe act occurs, spilling oil and not clearing it up.
᭹ An unsafe condition results, a pool of oil on the floor.
᭹ A loss occurs when someone slips on the oil, falls and breaks an
arm.
When we investigate the loss, we can identify unsafe conditions, unsafe
acts and lack of management controls and establish causes for these, as
well as causes for the loss. Continuing the example:
᭹ Possible causes of a person slipping on a patch of oil might be not
looking where they were going, or not wearing appropriate
footwear.
᭹ Possible causes of not clearing up spilled oil might be lack of time, or
not seeing it as part of the job.
᭹ Possible causes of spilling oil might be working in a hurry, inap-
propriate implements or a poor method of work.
᭹ Possible causes of poor management control might be excessive
pressure for production (resulting in hurrying), lack of funding for
proper implements, or insufficient attention to designing appropriate
systems of work.
The further the cause of the accident is to the left of the dominoes, the
greater the implications for lack of management control. By inference it
follows that lack of appropriate systems of work may apply to a large
Figure 2.5.11 Generalised Domino Theory
288 Safety at Work
number of operations, not just to those which can result in oil spillages.
Thus it may be possible to identify and remedy failures in management
controls and hence the potential to eliminate large numbers of losses. The
usefulness of the investigation can, therefore, extend beyond simply
preventing that accident happening again.
One way of doing this is to look systematically at what each of the
dominoes represents, determine which one started the fall and concen-
trate investigation in that area. But it is important to remember that there
is rarely a single function or action that causes a particular domino to fall,
rather there are a number of reasons which contribute to the fall. There is
a need to continue to ask why things happened until all of these
contributory causes have been identified. The oil spillage example used
earlier illustrates this.
Possible reasons for the person slipping on the oil were that he was not
looking where he was going and that he was wearing inappropriate
footwear. The question ‘Why’ should be asked about each of these to see
whether further useful information can be obtained. For example, not
wearing appropriate footwear could be because:
᭹ he did not know he should be wearing special footwear
᭹ he did not know which type of footwear was appropriate
᭹ the appropriate footwear was uncomfortable
᭹ the appropriate footwear was too expensive
᭹ and so on.
The different answers to these ‘why?’ questions will have different
implications for remedial action so it is important to establish the reason
‘why’ before making any recommendations. A similar technique should
be applied to the other dominoes and again this can be illustrated using
the oil spill example.
Unsafe condition. The possible reasons for not clearing up the oil spillage
were lack of time and not seeing it as part of the job. Asking ‘why?’ about
the lack of time could produce the following types of answer:
᭹ management pressure
᭹ piece work
᭹ wanted to get home
᭹ understaffing
᭹ and so on.
Again, the remedial action suggested will depend on the answer
obtained. There is little point in suggesting that people take time to clear
spillages if management are continuing to insist on giving production
priority.
Unsafe act. Possible reasons for the spillage of oil may include using
inappropriate implements and using an inappropriate system of work.
Asking ‘why?’ about the inappropriate system of work might produce the
following types of answer:
The collection and use of accident and incident data 289
᭹ no one has prepared a system of work
᭹ the people who do the work do not know about the system of work
᭹ the recommended system of work is impractical
᭹ the recommended system of work is out of date
᭹ and so on.
As before, whichever reason is identified, it should be followed up so that
any remedial action suggested is as relevant and practical as possible.
Lack of management controls. Possible reasons for the lack of management
controls were the pressure for production, lack of funding and failure to
produce written systems of work. Asking ‘why?’ about written systems of
work might produce the following types of answer:
᭹ no one knows it is necessary
᭹ no one has the time
᭹ no one has the skills
᭹ no one has clear responsibility
᭹ and so on.
It should be noted that as the basic investigation moves from the loss
domino to the lack of management controls domino, a wider range of
people will have to be interviewed. The injured person, for example, is
unlikely to have the required information on lack of management controls.
He or she can probably tell you about the effects of lack of controls but is
unlikely to know the reasons why the controls are not in place.
Identifying who should be interviewed in the course of an investiga-
tion and knowing which questions to ask are matters of experience and
practice and, as with the other skills aspects of accident investigation,
they should be practised whenever possible.
Note also that if a manager is conducting an investigation into an
accident within the area of another manager’s control, a conflict of
interests may arise. The person who should be implementing manage-
ment controls may have a tendency to avoid going into details of the
weaknesses in management control as thoroughly as might be required.
In these circumstances it may be preferable to hand the investigation over
to, or seek the assistance of, a neutral investigator.
Safety professionals have a related problem when there are requests
from managers to take part in investigations. In general this is to be
encouraged since it increases management involvement in safety matters,
but it should be explained to these managers that they may have to be
interviewed as part of the investigation if lack of management control is
identified as an underlying cause.
2.5.7.4 Writing investigation reports
It is not always necessary to prepare a formal written report of an accident
investigation, but where it is, the techniques of good report writing should
be followed. Key points on report writing are given below.
290 Safety at Work
It is preferable to prepare a draft report since this provides an
opportunity to check that nothing has been omitted from the investiga-
tions. In particular, that the information is available for:
᭹ making any statutory or other notifications
᭹ making reasoned suggestions on measures for preventing recurrence,
and
᭹ any other tasks, e.g. completing insurance claims.
Some people find that drafting reports is best done with techniques
such as system diagrams, system maps and flow charts and it is worth
experimenting with these techniques to find out their suitability.
The first question to ask about a final report is whether or not it is
necessary. Answers should be based on whether there is an audience,
who they are and what this audience needs from the report. In many
cases, a detailed draft report is adequate as a record, and as a basis for
justifying remedial actions.
The following points should be covered where a final report is
required:
(i) Good signposting. Any report, but especially a long one, will be
difficult to read and action if the various sections are not clearly
identified. If the report is intended for more than one audience, the
sections relevant to particular audiences should be clearly
identified.
(ii) Separate fact and opinion. Facts should be unarguable, opinions can,
and should, be debatable. It is good practice to keep the two
separate.
(iii) Base opinions on the facts. Conclusions should not be drawn which
cannot clearly be supported by the facts presented, nor should
conclusions be drawn which do not take all of the relevant facts into
account.
2.5.7.4.1 Feedback of investigation results
The relevant results of investigations, including any recommendations
for remedial action, should be fed back to all of the people who were
involved in the investigation.
If this is not done, there may be the following detrimental effects:
᭹ Subsequent investigations will be more difficult, and less information
will be given, because people will have seen no results from helping
with earlier investigations.
᭹ Credibility will be damaged since people will have been told that the
investigation is to prevent recurrence and they have received no
instructions on the action to take.
Even though the results from a particular investigation indicate that no
action needs to be taken, the results and the reasons for taking no action
should be fed back to those who were involved.
The collection and use of accident and incident data 291
2.5.7.5 Learning from minor incidents and near misses
It is often the case that only the more serious incidents are considered
worthy of investigation. The rationale for this is usually that investiga-
tions take time and, therefore, cost money so that they are only worth
doing when there has been a significant loss. However, various
researchers have demonstrated that there is no relationship between the
causes of accidents and the seriousness of the outcome and that, for
example, minor injuries have the same range of causes as major
injuries.
It follows from this that as much can be learned from investigating
individual minor incidents and near misses as can be learned from
investigating individual major injuries. Since it is also the case that there
are many more minor incidents than major incidents, investigation of
minor incidents gives us many more opportunities to learn from what has
gone wrong.
Since there are so many minor incidents, we are left with the practical
problem of the time required for adequate investigation of them all. There
are two ways of dealing with this problem.
1 Provide managers with the competences to carry out proper investiga-
tions so that the required work is spread among a number of competent
persons.
2 Identify patterns in minor incident occurrence and investigate groups
of minor incidents which are likely to have related causes. How this
pattern identification is carried out was described in section 2.5.6 on
epidemiological analysis.
Assuming that managers can be trained in investigation techniques, the
first option is to be preferred. However, the second option can provide an
acceptable alternative and it should be used as a backup when
managerial investigations are in place.
2.5.7.6 Advanced investigation techniques
Effective observation and interviewing will be adequate for the majority
of investigations and, when combined with the discipline imposed by
good report writing, should ensure appropriate recommendations.
However, there will be certain accidents and incidents which, because of
their complexity, require the use of more advanced techniques. A full
description of these techniques is beyond the scope of this chapter but
key points are as follows:
᭹ Complex accidents may have many ‘sites’. For example, the root cause
of a road traffic accident may have occurred in a design office (for the
car or for the road) many years before, and many miles away from, the
fatal crash.
᭹ The amount of information required to describe effectively a complex
accident is likely to be beyond the scope of succinct narrative summary
292 Safety at Work
so that some type of formal collation technique is to be preferred. A
number of such techniques are available but Events and Causal Factors
Analysis (ECFA) is the most straightforward and most generally
useful.
᭹ The production of effective recommendations for the prevention of
recurrence is unlikely to be straightforward in these complex accidents
and incidents so that techniques such as Fault Tree Analysis (FTA) may
be required to analyse the causal sequences. In addition, creative
thinking techniques such as brainstorming and systems thinking may
be required to generate a suitable range of recommendations.
More extended discussion of these advanced techniques are given by
Boyle
11
.
2.5.8 Accident and incident data and risk assessment
data
There are two types of accident and incident data to be considered, the
aggregated data used for trend and epidemiological analyses and the
data on single accidents and incidents collected during investigations.
Each of these data types is dealt with separately.
2.5.8.1 Aggregated accident and incident data
As has already been mentioned accident and incident data do not provide
a measure of risk. This is because the number of accidents and incidents
depends on three factors:
(i) the underlying level of risk,
(ii) how well the risk is controlled, and
(iii) the operation of chance.
Risk assessment techniques are intended to estimate the first of these
factors, the underlying level of risk, and should determine the number
and the nature of the accidents and incidents which would occur if there
were no risk control measures. However, there are two limitations with
the techniques currently available.
1 The techniques are generally restricted to the assessment of a single
activity or group of activities and there are no recognised methods for
the aggregation of risks across an organisation. This is why compar-
isons between organisations are still based on proxies for risk such as
numbers employed and hours worked.
2 The techniques are based on probabilities which many people find
difficult to understand. In essence, the fact that an accident happens
does not mean that the risk assessment was incorrect. For example, if it
is correctly calculated that there is a very low likelihood of a multiple
fatality, the fact that the multiple fatality occurs does not necessarily
The collection and use of accident and incident data 293
mean that the estimate of likelihood was incorrect. Rather, it is the third
of the factors listed above, i.e. the operation of chance. What is required
in the longer term are numerical techniques for risk assessment which
identify the underlying level of risk and the extent to which risk control
measures will reduce the risk. It will then be possible to predict the
number of accidents and incidents that will occur by chance and this
can be compared with the numbers of accidents and incidents that do
occur. It may then also be possible, by examining the accident and
incident data in more detail, to determine whether any problems are
due to an underestimate of the underlying level of risk or a failure to
select or implement appropriate risk control measures. These are
discussed by Boyle
11
.
2.5.8.2 Data on single accidents and incidents
The investigation of each accident and incident should include a review
of the relevant risk assessment or risk assessments. This review should
include checks on the following:
᭹ That the risk assessment has been carried out, reviewed at appropriate
intervals and adequately documented. This is, in effect, a check on the
operation of the risk assessment element of the Safety Management
System and, where weaknesses are identified, suitable corrective action
should be instigated.
᭹ That the estimates of likelihood and severity on which the risk
calculation was based were realistic, given the information available at
the time. Again, this is a check on the risk assessment element of the
Safety Management System but it is checking how well the risk
assessment was carried out, not just whether it was carried out.
᭹ That any recommendation for risk control measures would, had they
been implemented, have effectively controlled the risk. Risk assess-
ments should include a calculation of the extent to which the
recommendation will reduce risk since if it is not possible to
demonstrate a risk reduction, the recommendations are pointless.
᭹ That any recommendations for risk control measures have been
implemented and effectively maintained. Different organisations use
different procedures for the implementation and maintenance of risk
control measures but whatever procedures are used they should be
checked.
All of these checks should be made in the context of the information
available to the assessors at the time of the risk assessment since the
purpose of the checks is to identify weaknesses in the current procedures
for risk assessment and risk control. Once this has been done, the relevant
risk assessment(s) can be reviewed in the light of the new information
arising from the accident or incident investigation and, if necessary, the
risk assessment can be revised. However, it should always be remem-
bered that the occurrence of an accident or incident is not, per se, a
demonstration that the risk assessment was incorrect.
294 Safety at Work
2.5.9 The use of computers
2.5.9.1 Introduction
This section consists of a brief description of the sorts of computer
software which are available for the recording and analysis of accident
and incident data, and for a range of related data handling tasks. The
criteria to be used in selecting software are also briefly discussed.
2.5.9.2 Hardware and system software
There are many types of computer (usually referred to as hardware) but
the most common type is the personal computer (PC), either in its
desktop form, or as a portable (‘laptop’ or ‘notebook’). This discussion
will, therefore, be restricted to software available on PCs.
Before any application program can be run on a PC it has to be
equipped with system software. This software does a number of things
but essentially it is an interface between the hardware and any
application program to be run. The major practical value of system
software is that people who write, for example, statistical programs do
not have to produce a different version for each different type of
hardware. Instead, they write a program for a particular type of system
software. The most common system software is Windows in its various
versions and this discussion will be restricted to software packages which
run under Windows. However many of the points made will also apply
to other systems software.
2.5.9.3 The nature of programs
The sorts of programs discussed all operate in essentially the same way.
Each one provides a framework, or shell, into which data can be put and,
for the present purposes, the programs can be classified according to the
types of data they accept. The main categories are as follows:
᭹ Free format text, diagrams, pictures, tables, etc. These data types are all
accepted by programs such as word processors, desktop publishing
packages and presentation packages.
᭹ Structured alphanumeric data. These data types consist of mixed letters
and numbers in a highly structured format of records and fields.
Database programs accept these data types, including the specialised
database programs used for specific purposes such as accident and
incident recording.
᭹ Questions and answers. This is a subcategory of the structured
alphanumeric data but because it has special relevance to health and
safety it is dealt with separately. Packages for active monitoring, audit,
attitude surveys and measuring safety culture accept these types of
data.
The collection and use of accident and incident data 295
᭹ Numeric data. Spreadsheets are the most common programs for
numeric data but these types of data are also used by the specialised
statistical packages.
There is always an overlap between programs, for example word
processors will do elementary calculations. However, all programs are
designed to deal primarily with a single data type. Specific programs are
dealt with after some general points.
In theory, there could be one computer program which did everything
but, in practice, the more a computer program does, the more difficult it
is to learn and use. For this reason, program authors compromise in two
main ways:
1 Reducing functions. This involves limiting the number of things the
program encompasses, for example the sorts of calculations that can be
done using a word processor, or the level of word processing that can
be done using a spreadsheet.
2 Reducing flexibility. This involves limiting the data the program will
accept, or the number of things which can be done with these data. For
example, any database program can be used for accident and incident
recording but database programs are difficult to learn. A program
designed solely for accident and incident data, although it is less
flexible, should be much easier to learn and use.
However, the link between functionality and flexibility, and speed of
learning and ease of use, depends on the skill of the software designer.
Some very limited programs are badly designed and are difficult to learn
and use, while some very powerful programs are relatively easy to learn
and use.
2.5.9.4 Free format text programs
The main programs in this category include word processors and
presentation packages.
So far as the present purposes are concerned, the primary use for these
packages is for getting messages over to other people, either as a written
report or as a presentation.
The key point to consider when selecting suitable software of this type
is whether it will accept data directly from the other packages being used.
Having to retype data, particularly numeric data, is tedious and error
prone, and it is preferable to have a word processor and presentation
package which will read data directly from the output of the other
packages in use.
It is prudent to select for general use well-known packages such as
Word for Windows (word processor) and Powerpoint (presentation
package) since authors of other software are likely to ensure that the
output from their programs will be compatible. However, there are
a number of specialised packages which are of particular relevance to
296 Safety at Work
investigations since they facilitate the preparation of the diagrams used
for ECFA, FTA and other related techniques. While these diagrams can be
prepared in, for example ‘Word’, the work required is extensive for all but
the simplest diagrams.
2.5.9.5 Structured alphanumeric data
The main programs in this category include general databases and
databases designed for use with specific types of data such as accident
records.
General databases such as Access have a very wide range of
functions and are very flexible. However, they are difficult to use
without some programming experience or the willingness to devote
time to learning how to use them.
There are two separate stages in the use of general databases:
1 Setting up the database so that it will do the recording and analysis
required. If, for example, a general database is to be used to record
and analyse accident and incident data it would be necessary to set
up the fields for recording such things as name of person injured,
time of injury and number of days lost. This is specialised work
requiring a high level of skill.
2 Entering data into the framework created in step 1. This requires a
lower level of skill but, unless step 1 has been carried out properly, it
will be highly error prone. For example, step 1 should include
building in automatic checks on the data being entered with appro-
priate error messages when incorrect data are entered.
Because of the high levels of skill required to set up general
databases for specific uses, it is not usually worthwhile for health and
safety professionals to learn the skills required. What normally hap-
pens is that the health and safety professional specifies what is
required and then hands over the work of setting up the database to
the IT professionals who then produce a program which looks like a
specific database when it is being used for data input and analysis.
Specific databases are available for a wide range of uses including
the recording and analysis of data on accidents, risk assessments and
various test results such as audiometry and LEV tests. Several different
versions of each database type, which differ in function, flexibility and
price, are available on the market.
The key selection strategies for these types of databases involves two
main elements:
1 Being clear about what data are to be recorded and what analyses
are to be carried out. Software suppliers will try to convince
potential purchasers that their program does what is required, but
this is not always the case. On the other hand, purchasing new
software should be taken as an opportunity to review what is being
The collection and use of accident and incident data 297
done by way of recording and using data since there is little point in
computerising a poor paper system.
2 Looking to the long term. Many program demonstrations are carried
out with just a few records on a highly specified computer and they
appear fast and easy to use. Ask to see demonstrations involving the
sort of computer you have with the numbers of records there will be
in the system in two to three years’ time. Some programs may be so
slow as to be unusable.
The health and safety trade press carries advertisements for these types
of specific databases and it is easy to get further information simply by
contacting the suppliers.
2.5.9.6 Questions and answers
The main uses for programs of this type are the recording and analysis
of active monitoring data, audit data, and data from surveys such as
attitude or safety culture surveys. The strategy for the selection of these
programs includes the points already made about specific databases,
plus the following:
᭹ Flexibility of the question set. Some programs are supplied with a set
of questions which cannot be altered, while others can be supplied
in a form which allows users to put in their own questions ‘from
scratch’, or tailor a set of questions provided with the program.
Fixed questions are fine so long as they exactly meet an organisa-
tion’s requirements, but this is not often the case.
᭹ Use of more than one question set. Some programs allow the use of
only one set of questions (fixed or tailored) for all analyses while
others allow the use of as many different sets of questions as may be
required. The latter type of program is to be preferred when, for
example, there is a wide range of risks and it is preferable to avoid
asking people a lot of questions which do not apply to them.
᭹ Analysis options. Some programs have very limited analysis options
while others provide a range of alternatives. An important point to
note is the extent to which the program allows ‘labelling’ of the
answers to a particular set of questions. For programs designed for
auditing, it may be adequate to have one label for each set of
questions, usually the location which was audited. However, for
attitude and safety culture surveys a range of labels will be required
including, for example, department, level in the management hier-
archy, length of time with the company and age.
2.5.9.7 Numeric data
Programs for numeric data are similar to databases in that they are split
into general programs, i.e. spreadsheets, and programs which are designed
to do specific things with numeric data, i.e. statistical packages.
298 Safety at Work
So far as spreadsheets are concerned, the principles of their use and
selection are the same as for general databases, although people in
general tend to be more familiar with spreadsheet use.
There is a range of statistical packages available ranging from cheap
and easy to use packages which will do most of the basic statistical tests
to expensive, ‘heavy weight’ packages suitable only for the professional
statistician. However, none of these packages will compensate for poor
statistical technique. Easy, accurate calculation of confidence limits are
of no value if incorrect types of confidence limits are being used.
2.5.9.8 Choosing software
Summarising the steps to take in choosing appropriate software of any
type:
᭹ Know the hardware and system software to be used since this will
put restrictions on which programs can be used.
᭹ Know exactly what is to be achieved by using the software. However,
always take the opportunity to review the extent of the recording and
analysis being carried out since the availability of software may make
it possible to do more than is currently being done.
᭹ Check what relevant software is on the market. This is probably best
done by reading the health and safety trade press, or one of the
many computer magazines.
᭹ Get a demonstration of the software under conditions which match
those under which it will be used. Many software houses will supply
‘demonstration versions’ which can be tried out on the computer
setup to be used.
᭹ Do a cost benefit analysis on the options available. It is unlikely that
any package will exactly meet your requirements but remember that
having a program written is likely to be several orders of magnitude
more expensive than buying one ‘off the shelf’. A decision may have
to be made as to whether being able to do exactly what is required is
worth the extra cost.
References
1. Health and Safety Executive, Guidance Book No. HSG 65, Successful health and safety
management, HSE Books, Sudbury (1997)
2. Health and Safety Executive, Guidance Book No. HSG 96, The costs of accidents at work,
HSE Books, Sudbury (1997)
3. Health and Safety Executive, Legal Series Book No. L 73, A Guide to the Reporting of
Injuries, Diseases and Dangerous Occurrences Regulations 1995, HSE Books, Sudbury
(1999)
4. Moroney, M.J., Facts from Figures, Penguin Books (1980)
5. Shipp, P.J., The Presentation and Use of Injury Data, British Iron and Steel Association.
No date. (Out of print, but copies should be available through interlibrary loan
services.)
6. Siegel, S.S., Non-parametric Statistics for the Behavioural Sciences, McGraw Hill (1956)
7. Whaler, D.J., Understanding Variation – the Key to Managing Chaos, SPC Press,
The collection and use of accident and incident data 299
Appendix. UK requirements for reporting accidents and
incidents
This appendix summarises the UK requirements for reporting accidents
and incidents. It is only a summary and detailed study of the Regulations
is essential for safety practitioners and those responsible for reporting
accidents.
The Reporting of Injuries, Diseases and Dangerous Occurrences
Regulations 1995 (RIDDOR) with its supporting guide
3
place duties on
employers and the self-employed to report certain incidents which occur
in the course of work. These reports are used by the enforcing authorities
to identify trends in incident occurrence on a national basis. The reports
also bring to the attention of the enforcing authorities serious incidents
which they may wish to investigate. Reports must be made by the
‘responsible person’ who, depending on circumstances, may be an
employer, a self-employed person, or the person in control of the
premises where the work was being carried out.
The methods of reporting depend on the type of incident. For an
incident resulting in any of outcomes listed in the table the relevant
enforcing authority must be notified by the quickest practicable means,
usually by telephone.
This notification must be followed by a written report within 10 days
using Form F2508, details of which are given below. If they wish, the
enforcing authorities can make a request for further information on any
incident.
Dangerous occurrences are, in general, specific to particular types of
machinery, equipment, occupations or processes and knowledge of the
relevant incidents is necessary to ensure proper reporting. Some
examples are given in the second part of the table illustrating the range of
incidents involved.
An accident, other than one causing a major injury, which results in a
person ‘being incapacitated for work of a kind which he might reasonably
be expected to do . . . for more than three consecutive days (excluding the
day of the accident, but including days which would not have been
working days)’ is referred to as a ‘three day’ accident and is only required
to be notified by a written report.
Fatalities, major injuries, dangerous occurrences and three day acci-
dents have to be reported on Form F2508. The main requirements for
information on this form are:
᭹ Date and time of the accident or dangerous occurrence.
᭹ For a person injured at work, full name, occupation and nature of
injury.
8. Health and Safety Commission, Health and Safety Commission Annual Report, Statistical
Supplement, HSE Books, Sudbury (published annually)
9. Hale, A.R. and Hale, M., Accidents in perspective, Occupational Pschology, 44, 115–121
(1970)
10. Appendix 5 of reference 1
11. Boyle, A.J., Health and safety: Risk management, IOSH Services Ltd., Sudbury (2000)