Restoration of Aquatic Systems - Chapter 3 potx
Bạn đang xem bản rút gọn của tài liệu. Xem và tải ngay bản đầy đủ của tài liệu tại đây (2.99 MB, 23 trang )
55
chapter 3
Industrial Pollution: Pulp Mills
The manufacture of pulp and paper represents a major industry in the southern United
States. Because of the high volume of the effluent from pulp mills (20 to 50 million gallons
per day) and the discharge of various agents that have an impact on water and sediment
quality, the paper industry represents a formidable challenge in terms of restoration. The
discharge of various components leads to varying levels of impacts, depending on the
level of treatment and the assimilative capacity of the receiving system. These factors
include high concentrations of total dissolved solids (mainly sodium, chloride, and sulfide)
that contribute to the high specific conductance of the effluent. Conductivity contributes
to the elimination of primary freshwater species due to osmotic imbalances. Enhanced
loading of dissolved organic carbon (DOC) increases Biochemical Oxygen Demand (BOD)
in the receiving areas that, in turn, causes hypoxic and even anoxic conditions. Various
organic compounds that include tannins, lignins, and fulvates are components of the DOC.
These compounds also contribute to the high levels of color in pulp effluents that, in turn,
adversely affect light penetration in receiving water bodies.
Pulp effluents contain high levels of nutrients (mainly ammonia and orthophosphate)
that contribute to adverse impacts on microphyte and macrophyte assemblages in receiv-
ing areas. Toxic agents in pulp effluents include ammonia, certain metals, and chlorinated
compounds (that can include dioxin). Various methods are available to mitigate many of
the toxic components of pulp effluents. Publications of the impacts of pulp effluents in the
study areas are available (Livingston, 1975a, 1980a, 1981, 1982a, 1984a, 1985a,b, 1987a,b,
1993b, 1997a, 1999b, 2000, 2002; Livingston et al., 1998a).
3.1 Study Area
The Gulf coastal zone of north Florida extends from the alluvial Perdido River–Bay system
in eastern Alabama and the western Florida Panhandle to the black water rivers of
have been part of the long-term studies of our research group (Livingston, 2000, 2002).
The panhandle landscape is the result of stream and river flows and wave action that has
acted on the land surface over the past 10 to 15 million years. Beach ridges, spits, cliffs,
barrier islands, swales, sloughs, dunes, lagoons, and estuaries along a relatively flat upland
configuration characterize the northeast Gulf region. Western bay systems are associated
with alluvial rivers having relatively restricted coastal plain areas. The Apalachicola and
Apalachee Bay basins (Figure 3.1) are part of broad coastal plains that include extensive
marsh areas. Barrier islands start in Apalachicola Bay, extending west to the Pensacola
and Perdido Bay systems. On the eastern end of the Panhandle coast (Apalachee Bay),
there is no barrier island development, and coastal swamps and marshlands dominate
1966_book.fm Page 55 Friday, June 3, 2005 9:20 AM
© 2006 by Taylor & Francis Group, LLC
Apalachee Bay in the Big Bend area (Figure 3.1A). The drainage systems in this region
56 Restoration of Aquatic Systems
the coast. This area is characterized by shallow, sloping margins, the lack of wave action,
and an inadequate supply of sand (Tanner, 1960) for barrier island development.
Upland watersheds for coastal regions of the northeast Gulf are located in Alabama,
Florida, and Georgia, in an area approximating 135,000 km
2
(Figure 3.1a). Associated
estuarine/coastal systems are characterized by habitats that are mainly controlled by the
upland freshwater drainage basins. Intersecting habitats of the coastal zone include salt-
water marshes, sandy beaches, tidal creeks, intertidal flats, oyster reefs, seagrass beds,
sub-tidal unvegetated soft bottoms, and various transitional areas. The salinity regimes
of these areas are variously affected by major river systems or, as is the case in Apalachee
Bay, by a series of small rivers and groundwater flows. Nine of the twelve major rivers
and five of the seven major tributaries of Florida occur in this region. The major alluvial
rivers of the northwest Florida Panhandle (Perdido, Escambia, Choctawhatchee, Apalach-
icola) have their headwaters in Georgia and Alabama (Figure 3.1a). A series of smaller
streams along the panhandle coast include the Blackwater and Yellow Rivers of the
Pensacola Bay system, the Chipola River (part of the Apalachicola drainage), and the
Ochlockonee River on Apalachee Bay. Farther down the coast, a series of small streams
(St. Marks, Aucilla, Econfina, and Fenholloway) with drainage basins in Florida, flow into
Apalachee Bay.
The Florida Panhandle has a range of human populations from low densities in the
and Apalachee Bay drainage basins are among the least populated coastal areas in the
United States. Coastal urban areas include Pensacola (Escambia Bay–Pensacola Bay),
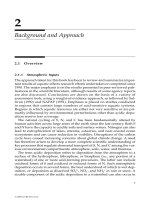
Figure 3.1a
The Florida Panhandle, showing the primary river basins and distribution of associated
river–estuaries and coastal systems. This figure is a composite of information provided by the
National Oceanic and Atmospheric Administration, the Florida Department of Environmental Pro-
tection, and the ESRI Corporation.
Elevenmile
Creek
Perdido
River
Perdido
Bay
Escambia
River
Escambia
Bay
Blackwater
River
Yellow
River
Choctawhatchee
River
Apalachicola
River
Econfina
River
Fenholloway
River
Apalachee Bay
Apalachicola Bay
Choctawhatchee Bay
Blackwater Bay
Gulf of Mexico
N
100 0 100 Kilometers
Alabama Georgia
Florida
Northeast Gulf of Mexico
(a)
1966_book.fm Page 56 Friday, June 3, 2005 9:20 AM
© 2006 by Taylor & Francis Group, LLC
eastern drainages to the more populous areas to the west (Figure 3.1b). The Apalachicola
Chapter 3: Industrial Pollution: Pulp Mills 57
FIGURE 3.1b
Population density in the Northwest Florida area of study. This figure is a composite of information provided by
the National Oceanic and Atmospheric Administration (NOAA), the Florida Department of Environmental Pr
otection (FDEP), and
the ESRI Corporation.
Elevenmile
Creek
Perdido
River
Escambia
River
Blackwater
River
Yellow
River
Choctawhatchee
River
Apalachicola
River
Econfina
River
Fenholloway
River
Apalachicola
N
100 0 100 Kilometers
Ft. Walton
Beach
Destin
Niceville
Blountstown
Tallahassee
Perry
Panama
City
Pensacola
Population density
(number of people per square mile)
0–100
100–200
200–400
400–800
800–1600
1600–3200
>3200
(Data not included)
Milton
(b)
1966_book.fm Page 57 Friday, June 3, 2005 9:20 AM
© 2006 by Taylor & Francis Group, LLC
58 Restoration of Aquatic Systems
FIGURE 3.1c
Distribution of point sources of discharges to coastal waters in the northwest Florida study area. This figur
e is a composite
of information provided by the National Oceanic and Atmospheric
Administration (NOAA), the Florida Department of Environmental
Protection (FDEP), and the ESRI Corporation.
Elevenmile
Creek
Pensacola
Escambia
River
Blackwater
River
Yellow
River
Choctawhatchee
River
Apalachicola
River
Econfina
River
Fenholloway
River
Apalachicola
N
100 0 100 Kilometers
Ft. Walton
Beach
Destin
Niceville
Blountstown
Tallahassee
Panama
City
Milton
Point Sources of Pollution
Hazardous materials sites, 1997
Sewage treatment facilities
NPDES permit sites
(data not included)
(c)
Perry
Perdido
River
1966_book.fm Page 58 Friday, June 3, 2005 9:20 AM
© 2006 by Taylor & Francis Group, LLC
Chapter 3: Industrial Pollution: Pulp Mills 59
Destin/Fort Walton Beach/Niceville (western Choctawhatchee Bay), and Panama City
The distribution of sewage treatment facilities, hazardous waste sites, and NPDES
permit sites follows closely the distribution of human populations along the northeast
system include a pulp mill in the upper bay, and agricultural and urban runoff in the
lower bay. The highest concentration of point and non-point sources of pollution occurs
in the Pensacola Bay system. In recent years, there have been major increases in urban
storm water runoff in western Choctawhatchee Bay. Apalachicola Bay and Apalachee Bay
remain relatively free of such discharges, and are among the least polluted coastal systems
in the conterminous United States. In the Apalachicola system, the single most important
pollution source is a sewage treatment plant in Apalachicola that discharges into a creek
north of the city. In Apalachee Bay, the primary source of pollution is a pulp mill on the
Fenholloway River, with discharges near the inland city of Perry, Florida.
There are significant differences in the development of emergent and submergent
vegetation in the subject coastal systems of the northeast Gulf. Perdido Bay and the
Pensacola system have moderate concentrations of marshes, whereas the Choctawhatchee
system is practically devoid of emergent vegetation (EV). The Apalachicola and Apalachee
Bay systems have extensive and well-developed marsh systems. The big alluvial river-
bay systems have limited development of submerged aquatic vegetation (SAV), whereas
Apalachee Bay is characterized by one of the highest concentrations of seagrass beds in
the Northern Hemisphere. The Econfina and Fenholloway estuaries are distinguished from
the alluvial river–bay systems to the west by the relatively low flow/watershed and
flow/open water ratios, and by the well-developed marsh areas relative to the flow rates
of the contributing rivers to Apalachee Bay. The shallowness of Apalachee Bay, together
with the relatively low freshwater flows and considerable development of fringing coastal
wetlands, contribute to the seagrass beds as the dominant offshore habitat along the Big
Bend area of north Florida.
of the active Gulf Coast geosyncline, and is a shallow to moderately deep (average depth;
2.2 m) inshore water body oriented along a northeast–southwest axis. A study outline is
(1) lower Perdido River, (2) upper Perdido Bay (north of the Route 98 bridge), (3) lower
Perdido Bay, and (4) the Perdido Pass complex. The bay system has a length of 53.4 km
and an average width of 4.2 km. The primary source of freshwater input to the estuary
is the Perdido River system that flows southward about 96.5 km, draining an area of about
2937 km
2
(Livingston, 1998b, 2000, 2002). The Elevenmile Creek system (including Elev-
enmile Creek; Figure 3.2) is a small drainage basin (about 70 km
2
) that receives input from
a small municipal waste system and a paper mill. The Bayou Marcus Creek drains a
residential area of western Pensacola with input from urban storm water runoff. A sewage
treatment plant (STP) (recently diverted to adjoining marshes) occupies the area north of
the Bayou Marcus Creek. The Gulf Intracoastal Waterway (GIWW) runs through the lower
end of Perdido Bay about 5.6 km northeast of Perdido Pass. The U.S. Army Corps of
Engineers maintains the Perdido Pass channel at about 4 m as part of the GIWW (U.S.
Army Corps of Engineers, 1976). As in the Choctawhatchee Bay system, there is a shelf
that can extend up to 400 m in width around the periphery of the Perdido estuary. This
shelf usually does not exceed 1 m in depth. The upper bay is shallow, and depth tends
to increase southward. The deepest parts of the estuary are located at the mouth of the
Perdido River and in the lower bay.
Prior to the opening of Perdido Pass in the early 1900s, Perdido Bay was a largely
freshwater system, covered with freshwater plants (Brush, 1991). Access to the Gulf was
1966_book.fm Page 59 Friday, June 3, 2005 9:20 AM
© 2006 by Taylor & Francis Group, LLC
(St. Andrews Bay) (Figure 3.1b).
Gulf coast (Figure 3.1c). Outstanding sources of pollution loading in the Perdido Bay
The Perdido Bay system (Figure 3.2) lies in an area of submergence on the north flank
given in Appendix I. The bay can be divided into four distinct geographic regions:
60 Restoration of Aquatic Systems
Figure 3.2
Perdido drainage systems and near-shore parts of the Gulf of Mexico with distributions of permanent sampling
stations used in the long-term studies of the area. The Florida Geographic Data Library (FGDL) pr
ovided geographic data.
N
S
WE
Agricultural
Runoff
Wolf
Bay
U.S. 98
Bridge
Perdido
Bay
ECUA
STP
Mill
Outfall
Perdido Key
Perdido
Pass
Ono Island
Urban Runoff
46
47
45
48
43
44
40
41
42
42A
42C
42B
37
SC1
SC2
33
31
29
25 26
23
22
21
18
09
Perdido River
Elevenmile
Creek
GULF
OF
MEXICO
1966_book.fm Page 60 Friday, June 3, 2005 9:20 AM
© 2006 by Taylor & Francis Group, LLC
Chapter 3: Industrial Pollution: Pulp Mills 61
restricted by the shallow, shifting body of freshwater. At the time of an early survey (1767),
the pass had a depth of approximately 2 m. During an outbreak of malaria in the early
1900s, the mouth of the bay was opened to the Gulf. This transformed the bay into the
saltwater system it is today. This action resulted in the creation of the Ono Island/Old
River complex. The history of Perdido Bay is thus comparable to that of the Choc-
tawhatchee Bay system (Livingston, 1986a,b, 1989b) that was also opened at the mouth
by another group of citizens with shovels in 1929. Since the turn of the century, there has
been a steady increase in the human population in the Perdido basin. Problems of sewage
treatment and urban storm water runoff remain unresolved in various residential areas
around the bay to the present day. Agricultural runoff, based largely in Alabama, contrib-
Detailed, long-term analyses of the Perdido drainage system have been carried out
for the past 16 years (Livingston, 1992b, 1994, 1995d, 1997b, 1998b, 2000, 2002; Livingston
et al., 1998a) that include long-term, bay-wide synoptic analyses at fixed stations (Figure 3.2).
According to a U.S. Fish and Wildlife Service Report (1990), SAV was largely concentrated
in the lower bay. Historically, SAV has decreased by more than half from 1940–1941 to
1979. Dredging of the Gulf Intracoastal Waterway (GIWW) in the 1930s and continuous
pass enlargement and open water spoil disposal have been postulated as factors in the
decline of SAV in the lower bay (Bortone, 1991). SAV development has been restricted to
the dominant species. Field/laboratory experiments (Livingston, 1992b) indicated light as
the chief limiting factor with grass development not extending deeper than 0.8 to 1.0 m.
Based on the success of previous grass bed transplant experiments, Davis et al. (1999)
concluded that
V. americana
beds in upper Perdido Bay were recruitment-limited rather
than constrained by water quality, toxic substances, light inhibition, or unsuitable sub-
strate. The Perdido Bay system has been adversely affected by pulp mill effluents and
overloads from the sewage treatment plant in the upper bay, the dredged opening to the
Gulf, and urbanization, and agricultural runoff in the lower bay.
The region along the upper Gulf coast of peninsular Florida from the Ochlockonee
River to the Suwannee River has a series of drainage basins that include the Aucilla,
which occupies a broad, shallow shelf along the Gulf coast. The smaller basins are wholly
within the coastal plain as part of a poorly drained region that is composed of springs,
lakes, ponds, freshwater swamps, and coastal marshes. The Econfina and Fenholloway
river estuaries both originate in the San Pedro Swamp (Figure 3.3). A study outline is
long-term physical modifications through forestry activities. However, most of Apalachee
Bay remains in a relatively natural state due to the almost complete lack of human
development in the primary drainage basins.
The dominant habitat feature of Apalachee Bay is an extensive series of seagrass beds
that extends from Florida Bay in the south to Ochlockonee Bay in the north (Iverson and
Bittaker, 1986). The one area of significant anthropogenous effect in an otherwise pristine
system is the Fenholloway River estuary where pulp mill discharges have caused adverse
effects due to high DOC and water color, high BOD, low dissolved oxygen (DO), and high
nutrient loading (ammonia and orthophosphate) (Livingston 1980a, 1982a, 1985a,b, 1988a;
Livingston et al., 1998b). The Econfina River remains one of the most natural black water
streams along the coast, and has been used as a reference area for studies in the Fenholloway
mon meteorological regime. River flow characteristics in the two drainages are comparable
in rate and seasonal variation.
1966_book.fm Page 61 Friday, June 3, 2005 9:20 AM
© 2006 by Taylor & Francis Group, LLC
utes to nutrient loading in Wolf Bay at the lower end of the basin (Figure 3.2).
Grassy Point on the west side of the upper bay (Figure 3.4) with Vallisneria americana as
Econfina, and Fenholloway Rivers (Figure 3.3). These streams drain into Apalachee Bay,
system since 1971. Both the Econfina and Fenholloway drainages (Figure 3.5) share a com-
given in Appendix I. This basin has been affected, in terms of water flow characteristics, by
62 Restoration of Aquatic Systems
Figure 3.3
Econfina-Fenholloway drainage systems and near-shore parts of the Gulf of Mexico with distributions of permanent
sampling stations used in the long-term studies of the area. The Florida Geographic Data Library (FGDL) provided geographic data.
E12
E09
E26
E25
E10
E08
E13
T21
T17
T19
T22
T23
T20
F12
F11
P25
P26
P14
P15
P16
E11
N
S
EW
GULF OF
MEXICO
Mill
Outfall
1966_book.fm Page 62 Friday, June 3, 2005 9:20 AM
© 2006 by Taylor & Francis Group, LLC
Chapter 3: Industrial Pollution: Pulp Mills 63
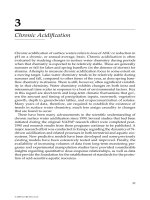
Figure 3.4
River flows of the Econfina and Fenholloway Rivers and Elevenmile Creek (monthly,
January 1990–December 1991).
Figure 3.5
Ammonia loading in the Econfina and Fenholloway Rivers and Elevenmile Creek (monthly,
January–December 1999).†
1
10
100
Jan
Feb
March
April
May
June
July
Aug
Sept
Oct
Nov
Dec
Jan
Feb
March
April
May
June
July
Aug
Sept
Oct
Nov
Dec
month
11-mile Creek-90/01 Econ. Riv 90/91 Fen. Riv 90/91
1
10
100
1000
10000
Jan
Feb
March
April
May
June
July
Aug
Sept
Oct
Nov
Dec
month
Econ. NH
3
load-99 Fen. NH
3
load-99 11-Mile NH
3
load-99
1966_book.fm Page 63 Friday, June 3, 2005 9:20 AM
© 2006 by Taylor & Francis Group, LLC
64 Restoration of Aquatic Systems
Comparative analyses were conducted of various features of the rivers affected by
kraft pulp mills (Fenholloway River, Elevenmile Creek) and the reference blackwater
stream, the Econfina River. Methods used for the comparison of monthly data (river flows,
nutrient loading, water quality) were developed to determine significant differences
between matching Amelia and Nassau sites (polluted and unpolluted) over the 12-month
study periods (Livingston, 2001a). A detailed explanation of the statistics used is given in
the parametric
t
-test was used to compare the sample means. For cases where one or both
of the data sets violated the assumption of normality, a data transformation was made to
bring the data into normality. Tests were also developed to compare two serially correlated
populations of numbers taken at subject stations by calculating differences of the obser-
vations and plotting the autocorrelations (months) of the differences. If differences were
not serially correlated, we applied the Wilcoxon sign-rank test to compare (0.05 confidence
level) the two sets of numbers.
3.2 River Flows, Nutrient Loading, and Water Quality Changes
(P < 0.05) higher than that in the Econfina River. Ammonia loading was higher in the
Fenholloway River than that in Elevenmile Creek. In both streams affected by pulp mill
effluents, ammonia loading was generally high throughout the season, whereas loading
in the reference stream generally followed seasonal changes in river flow. Orthophosphate
loading (Figure 3.6) was also significantly (P < 0.05) higher in the rivers affected by pulp
effluents compared to the Econfina system. However, such loading was significantly
Figure 3.6
Orthophosphate loading in the Econfina and Fenholloway Rivers and Elevenmile Creek
(monthly, January–December 1999).
1
10
100
1000
Jan
Feb
March
April
May
June
July
Aug
Sept
Oct
Nov
Dec
month
Econ. PO4 load-99 Fen. PO4 load-99 11-Mile PO4 load-99
1966_book.fm Page 64 Friday, June 3, 2005 9:20 AM
© 2006 by Taylor & Francis Group, LLC
River flow rates of the three rivers were comparable (Figure 3.4). However, ammonia
loading in the Fenholloway River and Elevenmile Creek (Figure 3.5) were significantly
Appendix II. For independent, random samples from normally distributed populations,
Chapter 3: Industrial Pollution: Pulp Mills 65
(P < 0.05) lower in Elevenmile Creek than that in the Fenholloway River. This was due in
part to differences in treatment facilities of the mills associated with these rivers. Overall,
however, the loading rates of the primary nutrients in streams affected by pulp mill
releases were 2 to 3 orders of magnitude greater than such loadings in a natural stream.
Orthophosphate concentrations in Elevenmile Creek have been successfully reduced, how-
ever, using alum treatments during periods of high loading of this nutrient. Recently, the
pulp mill on Elevenmile Creek has been successful in reducing both ammonia and ortho-
phosphate using various methods that include within-mill changes in the treatment sys-
tem. This restoration effort will be described in depth in a subsequent chapter.
A comparison of DO concentrations in the subject rivers is shown in Figure 3.7.
Dissolved oxygen in the Fenholloway River was uniformly low during all months of the
year, and was significantly lower (P < 0.05) than the DO levels in the Econfina River. In
Elevenmile Creek, the DO was uniformly higher than that in the Fenholloway River, but
was generally below 4 mg L
–1
from April through August. The DO concentrations in
Elevenmile Creek, although generally lower than those in the Econfina system, were not
significantly (P < 0.05) different from those in the reference stream. The complex relation-
ships of DO in Elevenmile Creek will be treated more completely below.
Specific conductance was significantly (P < 0.05) higher in both contaminated streams
to restore, and, as noted, both the Fenholloway River and Elevenmile Creek have conduc-
tivity levels that usually exceed water quality standards for freshwater systems. In Florida,
the requirement for specific conductance is 1275 µmhos cm
–1
.
Watercolor in the Fenholloway River was significantly higher in the Fenholloway
in Elevenmile Creek was not significantly different from the reference site as a result of a
treatment system that was initiated in the early 1990s. Watercolor and light penetration
Figure 3.7
DO concentrations in the Econfina and Fenholloway Rivers and Elevenmile Creek
(monthly, January–December 1999). Data were taken from Station P13 in Elevenmile Creek, Station
E001 in the Econfina River, and Station F01 in the Fenholloway River.
0
1
2
3
4
5
6
7
8
Jan
Feb
March
April
May
June
July
Aug
Sept
Oct
Nov
Dec
month
Econ. D.O 99 Fen. D.O 99 11-Mile D.O 99
1966_book.fm Page 65 Friday, June 3, 2005 9:20 AM
© 2006 by Taylor & Francis Group, LLC
than the reference river (Figure 3.8). Total dissolved solids in pulp mill effluents are difficult
system than color concentrations in the Econfina River (Figure 3.9). However, watercolor
66 Restoration of Aquatic Systems
in the Perdido Bay system were not affected by mill effluents subsequent to the successful
treatment by the paper mill, and microcosm and field experimental analyses showed that
submerged aquatic vegetation (
Vallisneria americana
) was not adversely affected by color
levels associated with mill effluents (Livingston, 1992b; Davis et al., 1999).
Figure 3.8
Specific conductance in the Econfina and Fenholloway Rivers and Elevenmile Creek
(monthly, January–December 1999).
Figure 3.9
Watercolor in the Econfina and Fenholloway Rivers and Elevenmile Creek (monthly,
January–December 1999).
1
501
1001
1501
2001
2501
Jan
Feb
March
April
May
June
July
Aug
Sept
Oct
Nov
Dec
month
Econ. Cond-99 Fen. Cond-99 11-Mile Cond 99
1
201
401
601
801
1001
1201
1401
Jan
Feb
March
April
May
June
July
Aug
Sept
Oct
Nov
Dec
month
Econ. Color-99 Fen. Color-99 11-Mile Color-99
1966_book.fm Page 66 Friday, June 3, 2005 9:20 AM
© 2006 by Taylor & Francis Group, LLC
Chapter 3: Industrial Pollution: Pulp Mills 67
Ammonia concentrations in both of the rivers affected by mill effluents were signifi-
cantly higher than those in the reference river (Figure 3.10). However, orthophosphate
concentrations were reduced in Elevenmile Creek relative to the significantly (P < 0.05)
of orthophosphate chemistry in aquatic systems (proclivity of attachment to fine particu-
lates) relative to those of ammonia (largely dissolved in water) provide the basis for
successful treatment of orthophosphate that can reduce loading of this nutrient to back-
ground levels. However, this interpretation of orthophosphate levels in areas receiving
nutrients from pulp mills will be qualified by changes in phytoplankton bloom popula-
tions that will be explained in more detail below.
The water quality data indicate some of the problems associated with the release of
pulp mill effluents contaminated with an assortment of chemicals that significantly alter
water quality in relatively low flow receiving areas with limited assimilative capacities
for such loading. These data also show that some of these factors, such as watercolor and
orthophosphate, can be mitigated by treatment and changes in water treatment systems.
3.3 Biological Responses in Freshwater Receiving Areas
Detailed studies were carried out concerning the biological response of the Fenholloway
River and Elevenmile Creek to releases of high volumes of pulp mill effluents relative to
natural conditions in an unpolluted black water system, the Econfina River (Livingston
1992b, 1993b, 2000, 2002).
3.3.1 Mill Effects on Freshwater Biota: Fenholloway River
3.3.1.1 Periphyton
Periphyton distribution indicated stress in the upper Econfina River and in portions of the
Fenholloway River above the mill outfall (Livingston, 1993b). The highest cumulative
Figure 3.10
Ammonia concentrations in the Econfina and Fenholloway Rivers and Elevenmile Creek
(monthly, January–December 1999).
0
1
2
3
4
5
6
Jan
Feb
March
April
May
June
July
Aug
Sept
Oct
Nov
Dec
month
Econ. NH
3
-99 Fen. NH
3
-99 11-Mile NH
3
-99
1966_book.fm Page 67 Friday, June 3, 2005 9:20 AM
© 2006 by Taylor & Francis Group, LLC
higher concentrations of this nutrient in the Fenholloway River (Figure 3.11). The dynamics
68 Restoration of Aquatic Systems
The periphyton data indicated stress in areas of the Fenholloway River that were associated
with the mill outfall. In the Fenholloway system, the highest numbers were found in Spring
Creek and at the mill outfall. The lowest annual totals were found in the middle and lower
reaches of the Fenholloway River. Seasonal distributions were most evenly spread out at
stations E01 and F01F (Figure 3.3). The periphyton species richness of the Fenholloway
River was considerably lower than that of the Econfina River or Spring Creek. These data
are consistent with the qualitative data that showed stress in the Fenholloway River below
the outfall station. The various diversity and evenness indices followed this pattern closely,
which would indicate that both the species richness component and the evenness compo-
nents of the periphyton reflected adverse effects due to mill effluents. There were thus
indications that there was enrichment at the outfall station with subsequent deterioration
of the periphyton numbers farther downstream in the Fenholloway River.
3.3.1.2 Hester–Dendy Macroinvertebrates
Macroinvertebrate data from the Fenholloway River indicated that conditions caused by
the mill effluent (high summer temperatures, low DO, high conductivity, initially high
ammonia, high nutrients, and high dissolved organic carbon (DOC) were associated with
the dominance of pollution-tolerant species such as the chironomid insects (Livingston,
1993b). These organisms are well adapted for hypoxic conditions and increased stress due
to the high conductivity and periodically high ammonia. Other indicator species such as
the crustacean
Asellus
and the gastropod mollusk
Physella
sp. were also found in areas
affected by mill effluents. There was recovery along the lower Fenholloway River with a
return to species noted in the various unpolluted reference sites. The lowest numbers of
species were found at the mill outfall station as an area of high impact. Low numbers of
species taken during the first 6 months could also have been associated with the relatively
Figure 3.11
Orthophosphate concentrations in the Econfina and Fenholloway Rivers and Elevenmile
Creek (monthly, January–December 1999).
0
1
2
3
Jan
Feb
March
April
May
June
July
Aug
Sept
Oct
Nov
Dec
month
Econ. PO4-99 Fen. PO4-99 11-Mile PO4-99
1966_book.fm Page 68 Friday, June 3, 2005 9:20 AM
© 2006 by Taylor & Francis Group, LLC
numbers of periphyton were noted at Econfina stations E00D, E00F, and E01 (Figure 3.3).
Chapter 3: Industrial Pollution: Pulp Mills 69
high ammonia levels during this period. Increased species richness farther downstream
in the Fenholloway River indicated recovery with distance from the mill outfall.
3.3.1.3 Suction Dredge Macroinvertebrates
Due to the high volumes of water discharged and the loading of organic matter (particulate
organic carbon [POC], dissolved organic carbon) and nutrients to the receiving system, a
reduction in DO (below the ambient condition) is often a secondary impact of pulp mill
effluents (Livingston, 1975a, unpublished data). In freshwater systems, the impact of mill
discharge is often dependent on the assimilative capacity of the receiving water body.
Variables to consider in the impact of the discharge on a freshwater system depend on
water temperature, current/turbulence characteristics, habitat type, and existing biological
conditions. Pearson (1980) and Pearson and Rosenberg (1978) have reported on the effects
of disturbances due to pulp effluents on marine biota. These authors showed that combi-
nations of changes in sediment characteristics (eH, organic content) and hypoxic condi-
tions in the overlying waters can cause changes in the infaunal macroinvertebrates that
are reflected in altered species composition, biomass, and community characteristics.
In the upper parts of the Econfina and Fenholloway Rivers, there was no clear trend
of differences in the various community indices derived from the suction dredge macro-
invertebrates (Livingston, 1993b). Numbers of animals and species richness were generally
high numbers, low species richness, and low species diversity. These trends occurred
throughout the sampling period and were noted farther downstream (F03, F04, F05, F05A)
with some differences. In the estuarine areas (E04, F05, E05, F05A), there were often higher
numbers in the Econfina system or no real difference between the two river biotas. Species
richness and diversity indices, however, were often lower in the upper portions of the
Fenholloway estuary. In the lower estuaries (E06, F06), there were generally higher num-
bers of individuals and species in the Econfina system.
Statistical analyses of the data indicated no significant trends of numbers of organisms
with the various physicochemical factors. However, macroinvertebrate species richness
was significantly correlated with surface and bottom DO concentrations (R
2
= 0.13, P =
0.0001). The data indicated that low DO in the Fenholloway River-estuary was an impor-
tant determinant of the macroinvertebrate community structure compared with the refer-
ence system. Because conductivity and ammonia, the other known forms of stress in the
Fenholloway River, showed longitudinal trends in this system, the close and continuous
association of hypoxia with biotic trends was significant.
Overall, the river–estuarine suction dredge data indicated that species richness and
diversity can reach a “natural” level at DO concentrations approximating 3 mg L
−
1
or
more. In a system characterized by low levels of DO and high organic carbon loading, a
few species can adapt to such conditions and are therefore released in terms of population
increases so that low species richness and diversity are accompanied by high numbers in
the Fenholloway River estuary. There were indications that reduced species richness and
diversity in the Fenholloway were due to other factors in addition to hypoxic conditions.
The data indicated that 24-hour means between 3 and 4 mg L
−
1
with minima between 2 and
3 mg L
−
1
are recommended targets for maintaining viable macroinvertebrate assemblages.
3.3.1.4 Fishes
Freshwater fishes were low in numbers of individuals and species richness in the Fenhol-
temperature and low DO were typified by generally low numbers of fish species in the
Fenholloway River. The outfall area was not always characterized by hypoxia, and was
1966_book.fm Page 69 Friday, June 3, 2005 9:20 AM
© 2006 by Taylor & Francis Group, LLC
loway River compared to the Econfina River (Table 3.1). Summer–fall periods of high
low in both rivers. Data from the mill outfall station (F01F; Figure 3.7) indicated relatively
70 Restoration of Aquatic Systems
Table 3.1
Fishes Taken in the Econfina and Fenholloway Rivers (monthly from 1992 to 1993)
Station Yymm TotalN Nbrtaxa GAMAFFn GAMAFF% station Yymm TotalN Nbrtaxa GAMAFFn GAMAFF%
E00D 92/04 8 5 3 37.5 F01D 92/09 0 0 0 0
E00D 92/05 7 2 0 0 F01D 92/10 1 1 1 100
E00D 92/06 10 2 1 10 F01D 93/02 0 0 0 0
E00D 92/08 56 4 37 66 F01D 92/08 nd nd nd nd
E00D 92/11 194 12 146 75.2 F01D 92/11 nd nd nd nd
E00D 92/12 50 6 28 56 F01D 92/12 nd nd nd nd
E00D 93/02 71 2 70 98.5 F01D 93/02 nd nd nd nd
E00F 92/04 0 0 0 0 F01F 92/04 0 0 0 0
E00F 92/05 1 1 1 100 F01F 92/05 24 3 19 79.1
E00F 92/06 0 0 0 0 F01F 92/06 38 3 36 94.7
E00F 92/08 13 2 2 15.3 F01F 92/08 6 3 4 66.6
E00F 92/09 2 2 1 50 F01F 92/09 2 1 0 0
E00F 92/10 0 0 0 0 F01F 92/10 7 3 5 71.4
E00F 92/11 0 0 0 0 F01F 92/11 3 1 0 0
E00F 92/12 0 0 0 0 F01F 92/12 3 1 0 0
E00F 93/01 1 1 0 0 F01F 93/01 25 4 22 88
E00F 93/02 49 2 48 97.9 F01F 93/02 22 1 22 100
E00F 93/03 6 4 0 0 F01F 93/03 nd nd nd nd
E01 92/04 148 8 133 89.8 F02 92/04 7 1 7 100
E01 92/05 27 2 24 88.8 F02 92/05 0 0 0 0
1966_book.fm Page 70 Friday, June 3, 2005 9:20 AM
© 2006 by Taylor & Francis Group, LLC
Chapter 3: Industrial Pollution: Pulp Mills 71
E01 92/06 70 2 68 97.1 F02 92/06 0 0 0 0
E01 92/08 176 8 54 30.6 F02 92/08 19 3 6 31.5
E01 92/09 31 5 2 6.4 F02 92/09 7 2 0 0
E01 92/10 36 3 30 83.3 F02 92/10 5 1 0 0
E01 92/11 17 3 13 76.4 F02 92/11 0 0 0 0
E01 92/12 6 3 1 16.6 F02 92/12 9 5 1 11.1
E01 93/01 7 3 5 71.4 F02 93/01 7 2 2 28.5
E01 93/02 74 6 67 90.5 F02 93/02 2 1 2 100
E01 93/03 127 4 124 97.6 F02 93/03 2 1 2 100
E01A 92/04 0 0 0 0 F03 92/04 nd nd nd nd
E01A 92/05 4 1 0 0 F03 92/05 2 2 0 0
E01A 92/06 4 3 2 50 F03 92/06 4 1 4 100
E01A 92/08 38 5 12 31.5 F03 92/08 0 0 0 0
E01A 92/09 17 3 3 17.6 F03 92/09 1 1 1 100
E01A 92/10 9 3 7 77.7 F03 92/10 nd nd nd nd
E01A 92/11 9 4 3 33.3 F03 92/11 12 1 12 100
E01A 92/12 9 3 4 44.4 F03 92/12 31 1 31 100
E01A 93/01 10 4 5 50 F03 93/01 32 6 25 78.1
E01A 93/02 8 1 8 100 F03 93/02 nd nd nd nd
E01A 93/03 1 1 0 0 F03 93/03 nd nd nd nd
Average 37.9 2.9 20.8 40.1 Average 8.2 1.5 6.1 43.9
Note:
nd = no data.
1966_book.fm Page 71 Friday, June 3, 2005 9:20 AM
© 2006 by Taylor & Francis Group, LLC
72 Restoration of Aquatic Systems
enriched by the mill effluents: high numbers and high species richness of fishes during
late spring and early summer were found here (Livingston, 1993b). However, based on
the cumulative species richness index, the Econfina River stations had the highest total
numbers of fish species. The progressive deterioration along the Fenholloway River was
probably due to the distribution of hypoxia in this system, with increasingly low DO
downstream from the outfall. Stations along the lower parts of the Fenholloway River
were hypoxic during most months of the year. The initially high ammonia levels and the
high conductivity from the mill effluents also were implicated in the generally reduced
numbers and low species richness in the Fenholloway River.
It should be noted that the mosquitofish (GAMAFF:
Gambusia affinis
) was a major
dominant in the Fenholloway River. This live-bearing topminnow is able to live under
hypoxic conditions through a series of adaptations.
A comparison of marsh fishes taken in the Econfina and Fenholloway systems is given
species richness in the marsh fish associations of the Fenholloway system relative to the
Econfina reference area.
3.3.1.5 Phytoplankton
The blue-green species
Merismopedia tenuissima
did not occur in Perdido Bay until the
centrations of this alga occurred mainly in Elevenmile Creek (Station P22) although some
concentrations of
Merismopedia
were noted at the mouth of the creek (Station P23).
Meris-
mopedia tenuissima
occurred all year long in Elevenmile Creek, with peak numbers during
December and January. This species appeared to have increased numbers during periods
of low creek flow. The drought stimulated this species to bloom levels with high nutrient
concentrations as an added stimulus for the blooms. High salinity and silica and low
orthophosphate and DO were significantly associated with
Merismopedia tenuissima
num-
bers of cells L
–1
(Livingston, 2002). Numbers in the creek peaked during 2002 and there
was a reduction of
Merismopedia
during 2003 and 2004. Increased numbers of
Merismopedia
coincided with the drought of 1999 and 2002 that broke during 2003. This pattern was
also evident at Station P23 in the bay.
Livingston (1992b) indicated that infaunal macroinvertebrates in Elevenmile Creek
were dominated by tubificid (oligochaete) worms such as
Limnodrilus hoffmeisteri
, naidid
worms such as
Dero
spp., and chironomid insects (
Chironomus decorus
group,
Goelldichi-
ronomus
spp.). These species are well adapted to the high levels of organic matter, hypoxic
conditions, and rigorous physical habitat of the creek. Peak numbers of the dominants
occurred in the upper creek near the outfall where the concentrations of organic matter
in the water and sediments were highest. The numbers of infaunal organisms tended to
fall off quickly farther downstream. There was a gradual decrease of infaunal species
richness along the creek from the upper stations to mid portions of the stream. At the end
of the creek, numbers of individuals and species were extremely low, indicating stressful
conditions in the deeper parts of the estuarine parts of the creek. These effects were
precipitous decrease of infaunal numbers and species richness from 1996 to 1999 that
corresponded with increased numbers of
Merismopedia tenuissima
. During late 2003 and
2004, there was a general increase in both indices that again corresponded to decreases
of the blue-green blooms. Trends in the bay (Station P23) were somewhat different. There
was a general decrease in infaunal numbers and species richness from 1992 to 1999 that
followed trends of phytoplankton blooms in the bay (see below). The influence of the
blue-green blooms did not appear to extend into the bay.
1966_book.fm Page 72 Friday, June 3, 2005 9:20 AM
© 2006 by Taylor & Francis Group, LLC
in Table 3.2 (Livingston, 1975a). There was an overall reduction of both numbers and
enhanced orthophosphate and ammonia loading in 1996 (Figure 3.12). The primary con-
associated with low DO. Long-term trends (Figure 3.13 and Figure 3.14) indicated a
Chapter 3: Industrial Pollution: Pulp Mills 73
Table 3.2
Fishes Taken in the Econfina and Fenholloway Saltwater Marshes (monthly fr
om 1974 to 1976)
Date TotalN-E4a Nbrtaxa-E4a Date TotalN-F5b Nbrtaxa-F5b Date TotalN-E6a Nbrtaxa-E6a Date TotalN-F5b Nbrtaxa-F5b
74/01 17 3 74/01 0 0 74/01 15 6 74/01 0 0
74/02 107 4 74/02 0 0 74/02 229 10 74/02 0 0
74/03 0 0 74/03 1 1 74/03 36 3 74/03 1 1
74/04 4 4 74/04 5 3 74/04 nd nd 74/04 5 3
74/05 19 3 74/05 8 2 74/05 11 2 74/05 8 2
74/06 125 5 74/06 8 1 74/06 21 4 74/06 8 1
74/07 27 8 74/07 0 0 74/07 26 6 74/07 0 0
74/08 18 3 74/08 6 3 74/08 11 2 74/08 6 3
74/09 nd 74/09 4 2 74/09 nd nd 74/09 4 2
74/10 27 6 74/10 11 1 74/10 15 3 74/10 11 1
74/11 22 6 74/11 3 2 74/11 82 7 74/11 3 2
74/12 8 5 74/12 6 4 74/12 0 0 74/12 6 4
75/01 6 3 75/01 nd nd 75/01 56 4 75/01 nd nd
75/02 nd nd 75/02 nd nd 75/02 nd nd 75/02 nd nd
75/03 25 4 75/03 nd nd 75/03 5 2 75/03 nd nd
75/04 2 2 75/04 1 1 75/04 46 5 75/04 1 1
75/05 15 5 75/05 21 6 75/05 36 8 75/05 21 6
75/06 26 4 75/06 5 2 75/06 7 2 75/06 5 2
75/07 nd nd 75/07 4 2 75/07 32 3 75/07 4 2
75/08 nd nd 75/08 4 3 75/08 10 3 75/08 4 3
75/09 nd nd 75/09 nd nd 75/09 3 3 75/09 nd nd
75/10 44 7 75/10 4 2 75/10 41 4 75/10 4 2
75/11 12 4 75/11 1 1 75/11 nd nd 75/11 1 1
75/12 1 1 75/12 2 2 75/12 1 1 75/12 2 2
76/01 44 2 76/01 0 0 76/01 nd nd 76/01 0 0
Note:
nd = no data.
1966_book.fm Page 73 Friday, June 3, 2005 9:20 AM
© 2006 by Taylor & Francis Group, LLC
74 Restoration of Aquatic Systems
Results of the principal components analysis (PCA)-regression analyses of Elevenmile
ciated with nutrient loading and nutrient ratio indices in Elevenmile Creek (Station 22),
but were positively associated with drought conditions. This somewhat counterintuitive
result indicated that this bloom species responded to habitat conditions associated with
the drought rather than nutrient loading
per se
. Stabilization of creek flows together with
high concentrations of orthophosphate and ammonia was apparently important for the
initiation of the
Merismopedia
blooms that started to dissipate after a return of increased
rainfall and creek flows.
Merismopedia
was positively associated with salinity and nega-
tively associated with DO and orthophosphate concentrations, thus adding credence to
the above hypothesis.
Merismopedia
numbers were positively associated with total phy-
toplankton abundance and species richness. However, this species was negatively associ-
ated with a full range of biological variables, indicating adverse impacts on the biota of
the creek. The adverse impacts of this blue-green alga appeared to be restricted to Elev-
enmile Creek.
Livingston (1992b) found that Elevenmile Creek was characterized by high conduc-
tivity (which eliminated various primary freshwater fishes and sensitive macroinverte-
brates), high levels of free ammonia (which were associated by the U.S. EPA criteria with
chronic toxicity), and high concentrations of organic carbon (which was stimulatory to
Figure 3.12
Numbers of cells per liter of the blue-green alga
Merismopedia tenuissima
at Stations P22
and P23 taken monthly over the 15-year study period.
1
10
100
1000
10000
100000
1000000
10000000
100000000
1000000000
1988/10
1989/02
1989/06
1989/10
1990/02
1990/06
1990/10
1991/02
1991/06
1991/10
1992/02
1992/06
1992/10
1993/02
1993/06
1993/10
1994/02
1994/06
1994/10
1995/02
1995/06
1995/10
1996/02
1996/06
1996/10
1997/02
1997/06
1997/10
1998/02
1998/06
1998/10
1999/02
1999/06
1999/10
2000/02
2000/06
2000/10
2001/02
2001/06
2001/10
2002/02
2002/06
2002/10
2003/02
2003/06
2003/10
2004/02
2004/06
year/month
MERTENn-22 MERTENn-23
1966_book.fm Page 74 Friday, June 3, 2005 9:20 AM
© 2006 by Taylor & Francis Group, LLC
Creek (Figure 3.15) indicated that Merismopedia tenuissima numbers were negatively asso-
Chapter 3: Industrial Pollution: Pulp Mills 75
resistant chironomids and naidid oligochaetes that were found in high numbers in the
upper creek). Upper Elevenmile Creek was characterized by an almost complete lack of
primary freshwater fishes (cyprinids, cyprinodonts, percids, and atherinids). On the other
hand, secondary freshwater fishes (capable of withstanding high conductivity) such as
the lepomids (
Lepomis macrochirus, L. microlophus, Micropterus salmoides)
and various cat-
fishes (
Ameiurus natalis
,
Ictalurus
sp.) were present in considerable numbers at the outfall
station, along with estuarine types such as
Mugil cephalus
and fishes that were resistant
to organic loading (
Dorosoma cepedianum
). These fishes were subject to periodic (summer)
disease, but were drawn by the rich source of macroinvertebrate food that was a direct
response to the release of high levels of organic carbon. The incidence of high levels of
free ammonia usually preceded or was contemporaneous with the observations of dis-
eased fishes at the outfall station.
Farther downstream in Elevenmile Creek, the fish biota changed, with low numbers
of fishes and high dominance by secondary freshwater types such as the mosquitofish
(
Gambusia affinis, G. holbrooki
). The distribution of fishes in Elevenmile Creek was consistent
with the various microhabitat conditions at each station and the changing water quality
along the length of the stream. The trophic organization of Elevenmile Creek was thus
altered as a direct result of the organic loading at the outfall site.
These data indicate that the effects of pulp mill effluents on small creeks with limited
assimilative capacities show a range of adverse impacts that are affected by drought–flood
conditions and secondary effects associated with phytoplankton blooms.
Figure 3.13
Numbers (per square meter) of infaunal macroinvertebrates at Stations P22 and P23
taken monthly over the study period.
1
10
100
1000
10000
1988/10
1989/02
1989/06
1989/10
1990/02
1990/06
1990/10
1991/02
1991/06
1991/10
1992/02
1992/06
1992/10
1993/02
1993/06
1993/10
1994/02
1994/06
1994/10
1995/02
1995/06
1995/10
1996/02
1996/06
1996/10
1997/02
1997/06
1997/10
1998/02
1998/06
1998/10
1999/02
1999/06
1999/10
2000/02
2000/06
2000/10
2001/02
2001/06
2001/10
2002/02
2002/06
2002/10
2003/02
2003/06
2003/10
2004/02
2004/06
year/month
Inf#/m2-22 Inf#/m2-23
1966_book.fm Page 75 Friday, June 3, 2005 9:20 AM
© 2006 by Taylor & Francis Group, LLC
76 Restoration of Aquatic Systems
Figure 3.14
Species richness of infaunal macroinvertebrates at Stations P22 and P23 taken monthly
over the study period.
0.1
1
10
100
1988/10
1989/02
1989/06
1989/10
1990/02
1990/06
1990/10
1991/02
1991/06
1991/10
1992/02
1992/06
1992/10
1993/02
1993/06
1993/10
1994/02
1994/06
1994/10
1995/02
1995/06
1995/10
1996/02
1996/06
1996/10
1997/02
1997/06
1997/10
1998/02
1998/06
1998/10
1999/02
1999/06
1999/10
2000/02
2000/06
2000/10
2001/02
2001/06
2001/10
2002/02
2002/06
2002/10
2003/02
2003/06
2003/10
2004/02
2004/06
year/month
Inftaxa-22
Inftaxa-23
1966_book.fm Page 76 Friday, June 3, 2005 9:20 AM
© 2006 by Taylor & Francis Group, LLC
Chapter 3: Industrial Pollution: Pulp Mills 77
Figure 3.15
PCA-regression analysis of
Merismopedia tenuissima
numbers per liter against nutrient
loading and nutrient ratios, water quality indices, phytoplankton community indices, and infaunal,
invertebrate and fish indices taken at Station P22 (Elevenmile Creek) monthly over the study period
(1988–2004). Only significant associations are shown for eigenvector values.
11 Mile Creek nutrient loading and
P22/P23 ratios
R2 = 0.82, P = 0.002
Water quality indices
R2 = 0.91, P = 0.0003
Phytoplankton indices
R2 = 0.89, P = 0.0004
Infauna, invertebrae, fish indices
R2 = 0.88, P = 0.0004
1966_book.fm Page 77 Friday, June 3, 2005 9:20 AM
© 2006 by Taylor & Francis Group, LLC