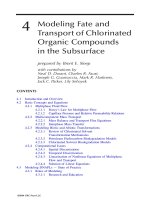
The Water Encyclopedia: Hydrologic Data and Internet Resources - Chapter 4 potx
Bạn đang xem bản rút gọn của tài liệu. Xem và tải ngay bản đầy đủ của tài liệu tại đây (1.66 MB, 102 trang )
CHAPTER 4
Hydrologic Elements
Brian Burke
CONTENTS
Section 4A Hydrologic Cycle 4-2
Section 4B Water Resources — United States 4-5
Section 4C World Water Balance 4-7
Section 4D Hydrologic Data 4-11
Section 4E Interception 4-24
Section 4F Infiltration 4-25
Section 4G Runoff 4-28
Section 4H Erosion and Sedimentation 4-39
Section 4I Transpiration 4-61
Section 4J Evaporation 4-63
Section 4K Consumptive Use 4-69
Section 4L Phreatophytes 4-95
4-1
q 2006 by Taylor & Francis Group, LLC
SECTION 4A HYDROLOGIC CYCLE
Water vapor
Ocean
Non-porous earth and confining rock
Wat
er
well
Surface
runoff
Surface
runoff
E
v
a
p
o
r
a
t
i
o
n
f
r
o
m
l
a
k
e
s
&
r
i
v
e
r
s
Surface
runof
f
T
r
a
n
s
p
i
r
a
t
i
o
n
f
r
o
m
t
r
e
e
s
P
l
a
n
t
s
C
r
o
p
s
Fresh groundwater zone
Infiltration/
percolation
V
a
p
o
r
s
c
o
o
l
t
o
f
o
r
m
C
l
o
u
d
s
&
p
r
e
c
i
p
i
t
a
t
i
o
n
Rain
Hail
Snow
Sun’s heat
causes evaporation
E
v
a
p
o
r
a
t
io
n
f
r
o
m
p
r
e
c
i
p
i
t
a
t
i
o
n
E
v
a
p
o
r
a
t
i
o
n
f
r
o
m
o
c
e
a
n
s
Salty/Brackish
water zone
Septic
system
Soil/Porous earth
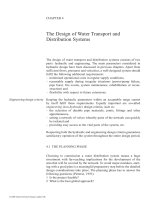
Figure 4A.1 The hydrologic cycle. (From www.dnr.ohio.gov.)
THE WATER ENCYCLOPEDIA: HYDROLOGIC DATA AND INTERNET RESOURCES4-2
q 2006 by Taylor & Francis Group, LLC
Table 4A.1 Hydrologic Effects of Urbanization
Change in Land or Water Use Possible Hydrologic Effect
Transition from Pre-Urban to Early-Urban Stage:
Removal of trees or vegetation Decrease in transpiration and increase in storm flow
Construction of scattered city-type houses and limited water
and sewage facilities
Increased sedimentation of streams
Drilling of wells Some lowering of water table
Construction of septic tanks and sanitary drains Some increase in soil moisture and perhaps a rise in water table.
Perhaps some waterlogging of land and contamination of nearby
wells or streams from overloaded sanitary drain system
Transition from Early-Urban to Middle-Urban State:
Bulldozing of land for mass housing, some topsoil removed,
farm ponds filled in
Accelerated land erosion and stream sedimentation and aggradation.
Increased flood flows. Elimination of smallest streams
Mass construction of houses, paving of streets, building of
culverts
Decreased infiltration, resulting in increased flood flows and lowered
groundwater levels. Occasional flooding at channel constrictions
(culverts) on remaining small streams. Occasional overtopping or
undermining of banks of artificial channels on small streams
Discontinued use and abandonment of some shallow wells Rise in water table
Diversion of nearby streams for public water supply Decrease in runoff between points of diversion and disposal
Untreated or inadequately treated sewage discharged into
streams or disposal wells
Pollution of stream or wells. Death of fish and other aquatic life.
Inferior quality of water available for supply and recreation at
downstream populated areas
Transition from Middle-Urban to Late-Urban Stage:
Urbanization of area completed by addition of more houses
and streets and of public, commercial, and industrial
buildings
Reduced infiltration and lowered water table. Streets and gutters act
as storm drains, creating higher flood peaks and lower base flow of
local streams
Larger quantities of untreated waste discharged into local
streams
Increased pollution of streams and concurrent increased loss of
aquatic life. Additional degradation of water available to
downstream users
Abandonment of remaining shallow wells because of
pollution
Rise in water table
Increase in population requires establishment of new water-
supply and distribution systems, construction of distant
reservoirs diverting water from upstream sources within or
outside basin
Increase in local streamflow if supply is from outside basin
Channels of streams restricted at least in part to artificial
channels and tunnels
Increased flood damage (higher stage for a given flow). Changes in
channel geometry and sediment load. Aggradation
Construction of sanitary drainage system and treatment
plant for sewage
Removal of additional water from the area, further reducing infiltration
and recharge of aquifer
Improvement of storm drainage system A definite effect is alleviation or elimination of flooding of basements,
streets, and yards, with consequent reduction in damages,
particularly with respect to frequency of flooding
Drilling of deeper, large-capacity industrial wells Lowered water-pressure surface of artesian aquifer; perhaps some
local overdrafts (withdrawal from storage) and land subsidence.
Overdraft of aquifer may result in salt-water encroachment in
coastal areas and in pollution or contamination by inferior or
brackish waters
Increased use of water for air conditioning Overloading of sewers and other drainage facilities. Possibly some
recharge to water table, due to leakage of disposal lines
Drilling of recharge wells Raising of water-pressure surface
Waste-water reclamation and utilization Recharge to groundwater aquifers. More efficient use of water
resources
Note: A selected sequence of changes in land and water use associated with urbanization.
Source: U.S. Geological Survey.
HYDROLOGIC ELEMENTS 4-3
q 2006 by Taylor & Francis Group, LLC
Precipitation
Infiltration
Evaporation Evaporation
Evaporation
Increased pollution
Evaporation
Ocean
Ocean
Evapotranspiration
Evapotranspiration
Precipitation
Decreased infiltration
Water table
Condensation
Condensation
Solar
energy
Solar
energy
Runoff
Groundwater flow
Groundwater flow
W
ater tab
le
W
a
t
e
r
v
a
p
o
r
t
r
a
n
s
p
o
r
t
W
a
t
e
r
v
a
p
o
r
t
r
a
n
s
p
o
r
t
I
n
c
r
e
a
s
e
d
r
u
n
o
f
f
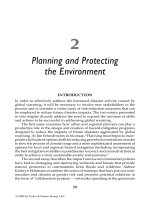
Figure 4A.2 Water cycle before and after urbanization. (From www.unce.unr.edu.)
THE WATER ENCYCLOPEDIA: HYDROLOGIC DATA AND INTERNET RESOURCES4-4
q 2006 by Taylor & Francis Group, LLC
SECTION 4B WATER RESOURCES — UNITED STATES
Table 4B.2 Distribution of Water in the Continental United States
Volume Annual
Circulation
(!10
9
m
3
/yr)
Replacement
Period
(yr)!10
9
m
3
%
Liquid water
Groundwater
Shallow (!800 m deep) 63,000 43.2 310 O200
Deep (O800 m deep) 63,000 43.2 6.2 O10,000
Freshwater lakes 19,000 13.0 190 100
Soil moisture (1-m root zone) 630 0.43 3,100 0.2
Salt lakes 58 0.04 5.7 O10
Average in stream channels 50 0.03 1,900 !0.03
Water vapor in atmosphere 190 0.13 6,200 O0.03
Frozen water, glaciers 67 0.05 1.6 O40
Source: From Ad Hoc Panel on Hydrology, Scientific Hydrology, Washington, DC: Federal Council for Science and
Technology, 1962.
Atmospheric moisture
40,000 bgd
Precipitation
4,200 bgd
Evaporation and transpiration from
surface-water bodies, land surface
and vegetation
2,800 bgd
Well
Recharge
Fresh groundwater
Saline groundwater
Stream flow
to oceans
1,230 bgd
Total surface
and groundwater
flow to oceans
1,300 bgd
Ocean
b
g
d =billion
g
allons per day
Evaporation
from oceans
Consumptive use
100 bgd
Interface
Water table
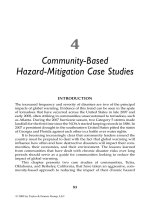
Figure 4B.3 Hydrologic cycle showing the gross water budget of the conterminous United States. (From U.S. Geological Survey, National
Water Summary 1983 — Hydrologic Events and Issues, Water-Supply Paper 2250, 1984.)
HYDROLOGIC ELEMENTS 4-5
q 2006 by Taylor & Francis Group, LLC
Table 4B.3 Some Purposes of Water-Resources Development
Purpose Description Type of Works and Measures
Flood control Flood-damage abatement or reduction, protection of
economic development, conservation storage,
river regulation, recharging of groundwater, water
supply, development of power, protection of life
Dams, storage reservoirs, levees, floodwalls,
channel improvement, floodways, pumping
stations, floodplain zoning, flood forecasting
Irrigation Agricultural production Dams, reservoirs, walls, canals, pumps and pumping
plants, weed-control and desilting works,
distribution systems, drainage facilities,
farmland grading
Hydroelectricity Provision of power for economic development and
improved living standards
Dams, reservoirs, penstocks, power plants,
transmission lines
Navigation Transportation of goods and passengers Dams, reservoirs, canals, locks, open-channel
improvements, harbor improvements
Domestic and industrial
water supply
Provision of water for domestic, industrial,
commercial, municipal, and other uses
Dams, reservoirs, walls, conduits, pumping plants,
treatment plants, saline-water conversion,
distribution systems
Watershed management Conservation and improvement of the soil, sediment
abatement, runoff retardation, forests and
grassland improvement, and protection of
water supply
Soil-conservation practices, forest and range
management practices, headwater-control
structures, debris-detention dams, small
reservoirs, and farm ponds
Recreational
use of water
Increased well-being and health of the people Reservoirs, facilities for recreational use, works for
pollution control, preservation of scenic and
wilderness areas
Fish and wildlife Improvement of habitat for fish and wildlife, reduction
or prevention of fish or wildlife losses associated
with man’s works, enhancement of sports
opportunities, provision for expansion of
commercial fishing
Wildlife refuges, fish hatcheries, fish ladders and
screens, reservoir storage, regulation of
streamflows, stocking of streams and reservoirs
with fish, pollution control, and land management
Pollution abatement Protection or improvement of water supplies for
municipal, domestic, industrial and agricultural
uses and for aquatic life and recreation
Treatment facilities, reservoir storage for
augmenting low flows, sewage-collection
systems, legal control measures
Insect control Public health, protection of recreational values,
protection of forests and crops
Proper design and operation of reservoirs and
associated works, drainage, and extermination
measures
Drainage Agricultural production, urban development and
protection of public health
Ditches, tile drains, levees, pumping stations, soil
treatment
Sediment control Reduction or control of slit load in streams and
protection of reservoirs
Soil conservation, sound forest practices, proper
highway and railroad construction, desilting
works, channel and revetment works, bank
stabilization, special dam construction and
reservoir operations
Salinity control Abatement or prevention of salt-water contamination
of agricultural, industrial, and municipal
water supplies
Reservoirs for augmenting low stream-flow, barriers,
groundwater recharge, coastal jetties
Source: From Chow, V.T., Water as a World Resource, Water International, 4, 6, 1979. With permission.
THE WATER ENCYCLOPEDIA: HYDROLOGIC DATA AND INTERNET RESOURCES4-6
q 2006 by Taylor & Francis Group, LLC
SECTION 4C WORLD WATER BALANCE
1,357,506,000 km
3
(1,167,200 cm or 11,672 m)
total volume
of water
8,506,000 km
3
(7,316 cm or 73.16 m)
total volume
of fresh water
on land and air
1,320,000,000 km
3
(1,135,000 cm or 11,350 m)
or 97.20%
in the oceans
8,506,000 km
3
(7,316 cm or 73.16 m)
or 0.65%
fresh water on land
and air
29,000,000 km
3
(24,900 cm or 249 m)
or 2.15%
frozen water
4,150,000 km
3
(3,570 cm or 35.70 m)
or 48.77%
groundwater
below ½ mile
4,150,000 km
3
(3,570 cm or 35.70 m)
or 48.77%
groundwater
½ mile deep
13,000 km
3
(11 cm or 0.11 m)
or 0.16%
as water vapor
in the atmosphere
67,000 km
3
(57 cm or 0.75 m)
or 0.8%
soil moisture
and seepage
126,250 km
3
(108 cm or 1.08 m)
or 1.5%
lakes, rivers
and streams
Note: figures in brackets indicate the height that the relevant quantites of water would reach if they were placed on the whole non-frozen land area of the
earth which is 116,400,000 km
3
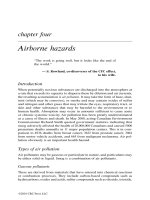
Figure 4C.4 Water availability on earth. (From Doxiadis, C.A., Water and Environment International Conference on Water for Peace,
Washington, DC, 1967.)
HYDROLOGIC ELEMENTS 4-7
q 2006 by Taylor & Francis Group, LLC
Table 4C.4 Estimated Global Water Cycle
Type of Water Location
Volume
Percent of Total VolumeMillions of cu. Miles Millions of cu Kilometer
Salt Water 97.00
Oceans 314.2 1308.0 (96.4%)
Saline bodies 2.1 8.7 (0.6%)
Fresh Water 2.90
Ice & snow 6.9 28.7 (2.1%)
Lakes 0.5 2.1 (0.15%)
Rivers 0.01 0.04 (0.003%)
Accessible groundwater 1.0 4.2 (0.31%)
Atmospheric 0.10
Sea evaporation 0.1 0.42 (0.03%)
Land evaporation 0.05 0.21 (0.015%)
Precipitation over sea 0.09 0.37 (0.03%)
Precipitation over land 0.03 0.12 (0.01%)
Water vapor 0.005 0.02 (0.002%)
Rounded Total 326.00 1357.00 100.0
Source: From National Weather Service Northwest River Forecast Center, www.nwrfc.noaa.gov.
Table 4C.5 World Water Balance, by Continent
Water Balance Elements Europe
a
Asia Africa
North
America
b
South
America Australia
c
Total Land
Area
d
Area, millions of km
2
9.8 45.0 30.3 20.7 17.8 8.7 132.3
in mm
Precipitation (P) 734 726 686 670 1,648 736 834
Total river runoff (R) 319 293 139 287 583 226 294
Groundwater runoff (U) 109 76 48 84 210 54 90
Surface water runoff (S) 210 217 91 203 373 172 204
Total infiltration and soil moisture (W) 524 509 595 467 1,275 564 630
Evaporation (E) 415 433 547 383 1,065 510 540
in km
3
Precipitation 7,165 32,690 20,780 13,910 29,355 6,405 110,303
Total river runoff 3,110 13,190 4,225 5,960 10,380 1,965 38,830
Groundwater runoff 1,065 3,410 1,465 1,740 3,740 465 11,885
Surface water runoff 2,045 9,780 2,760 4,220 6,640 1,500 26,945
Total infiltration and soil moisture 5,120 22,910 18,020 9,690 22,715 4,905 83,360
Evaporation 4,055 19,500 16,555 7,950 18,975 4,440 71,475
Relative values
Groundwater runoff as percent of
total runoff
34 26 35 32 36 24 31
Coefficient of groundwater discharge
into rivers
0.21 0.15 0.08 0.18 0.16 0.10 0.14
Coefficient of runoff 0.43 0.40 0.23 0.31 0.35 0.31 0.36
a
Including Iceland.
b
Excluding the Canadian archipelago and including Central America.
c
Including Tasmania, New Guinea and New Zealand, only within the limits of the continent: P-440 mm; R-47 mm; U-7 mm; S-40 mm;
W-400 mm; E-393 mm.
d
Excluding Greenland, Canadian archipelago and Antarctica.
Source: From Lvovitch, M.I., EOS, 54, 1973. With permission. Copyright by American Geophysical Union.
THE WATER ENCYCLOPEDIA: HYDROLOGIC DATA AND INTERNET RESOURCES4-8
q 2006 by Taylor & Francis Group, LLC
Table 4C.6 World Water Resources by Region
Region
Total Area
(km
2
)
(FAOSTATE,
1999) (1)
Total
Population
(FAOSTAT,
2000) (2)
Average
Precipitation
1961–1990
(km
3
/yr)
(IPCC) (3)
Internal
Resources:
Total (km
3
/yr)
(4)
External
Resources:
Natural
(km
3
/yr)
External
Resources:
Actual
(km
3
/yr)
Total
Resources:
Natural
(km
3
/yr)
Total
Resources:
Natural
(km
3
/yr)
% of World
Resources
IRWR/inhab.
(m
3
/yr)
TRWR
(actual)/inhab.
(m
3
/yr)
1 Northern America 21,899,600 409,895,363 13,384 6,662 47 (5) 47 6,709 6,709 15.2% 16,253 16,368
2 Central America
and Caribbean
749,120 72,430,000 1,506 781 6 (6) 6 787 787 1.8% 10,784 10,867
3 Southern America 17,853,960 345,737,000 28,635 12,380 0 0 12,380 12,380 28.3% 35,808 35,808
4 Western and
Central Europe
4,898,416 510,784 4,096 2,170 11 11 2,181 2,181 5.0% 4,249 4,270
5 Eastern Europe 18,095,450 217,051,000 8,452 4,449 244 244 4,693 4,693 10.2% 20,498 21,622
6 Africa 30,044,850 793,288,000 20,415 3,950 0 0 3,950 3,950 9.0% 4,980 4,980
7 Near East 6,347,970 257,114,000 1,378 488 3 3 491 491 1.1% 1,897 1,909
8 Central Asia 4,655,490 78,563,000 1,270 261 28 28 289 289 0.6% 3,321 3,681
9 Southern and
Eastern Asia
21,191,290 3,331,938 000 24,017 11,712 8 8 11,720 11,720 26.8% 3,515 3,518
10 Oceania and
Pacific
8,058,920 25,388,537 4,772 911 0 0 911 911 2.1% 35,869 35,869
World 133,795,066 6,042,188,900 107,924 43,764 0 0 43,764 43,764 100.0% 7,243 7,243
Notes: (1) No FAOSTAT dataforSpilsbergen (Norway); (2) No FAOSTAT data for West Bank (Palestinianauthority); data from Margat and Valle
´
e (2000); (3) No IPCC data on Near East(Saudi
Arabia, West Bank (Palestinian Authority); Gaza strip (Palestinian Authority)), South Asia (Taiwan Province of China, east Timor), Caribbean (Aruba). Pacific (Polynesia, Guam) so not
included in total. For Europe: no IPCC data for Spilsbergen (Norway), Luxembourg and Belgium; national data source used; (4) No data for various islands in Caribbean (Aruba,
Bermuda, Grenada, Guadeloupe, Martinique, St. Lucia. St. Vincent, Dominica) Pacific (French Polynesia, Guam, New Caledonia, Samoa, Tonga), Asia (Macao, Hong Kong); so not
included in regional and global totals; (5) 47 km
3
/year from Guatemala to Mexico; (6) 6 km
3
/year from North America region (Mexico).
Source: www.fao.org.
q 2006 by Taylor & Francis Group, LLC
HYDROLOGIC ELEMENTS 4-9
Table 4C.7 Water Poor Countries
FAO Code Country
Average
Precipitation
1961–1990
(km
3
/yr)
Internal
Resources
Surface
(km
3
/yr)
Internal
Resources
Groundwater
(km
3
/yr)
Internal
Resources
Overlap
(km
3
/yr)
Internal
Resources
Total (km
3
/yr)
External
Resources
Natural
(km
3
/yr)
External
Resources
Actual
(km
3
/yr)
Total
Resources
Natural
(km
3
/yr)
Total
Resources
Actual
(km
3
/yr)
105 Israel 9.16 0.25 0.50 0.00 0.75 0.92 0.92 1.67 1.67
112 Jordan 9.93 0.40 0.50 0.22 0.68 0.20 0.20 0.88 0.88
124 Libyan Arab Jamahiriya 98.53 0.20 0.50 0.10 0.60 0.00 0.00 0.60 0.60
136 Mauritania 94.66 0.10 0.30 0.00 0.40 11.00 11.00 11.40 11.40
35 Cape Verde 1.70 0.18 0.12 0.00 0.30 0.00 0.00 0.30 0.30
72 Djibouti 5.12 0.30 0.02 0.02 0.30 0.00 0.00 0.30 0.30
225 United Arab Emirates 6.53 0.15 0.12 0.12 0.15 0.00 0.00 0.15 0.15
179 Qatar 0.81 0.00 0.05 0.00 0.05 0.00 0.00 0.05 0.05
134 Malta 0.12 0.00 0.05 0.00 0.05 0.00 0.00 0.05 0.05
76 Gaza Strip (Palestinian
Authority)
0.00 0.00 0.05 0.00 0.05 0.01 0.01 0.06 0.06
13 Bahrain 0.06 0.00 0.00 0.00 0.00 0.11 0.11 0.12 0.12
118 Kuwait 2.16 0.00 0.00 0.00 0.00 0.02 0.02 0.02 0.02
Source: From Review of World Water Resources by Country, www.fao.org/documents.
Table 4C.8 Water Rich Countries
FAO Code Country
Average
Precipitation
1961–1990
(km
3
/yr)
Internal
Resources
Surface
(km
3
/yr)
Internal
Resources
Groundwater
(km
3
/yr)
Internal
Resources
Overlap
(km
3
/yr)
Internal
Resources
Total
(km
3
/yr)
External
Resources
Natural
(km
3
/yr)
External
Resources
Actual
(km
3
/yr)
Total
Resources
Natural
(km
3
/yr)
Total
Resources
Actual
(km
3
/yr)
IRWR/inhab.
(m
3
/yr)
21 Brazil 15,236 5,418 1,874 1,874 5,418 2,815 2,815 8,233 8,233 31,795
185 Russian Federation 7,855 4,037 788 512 4,313 195 195 4,507 4,507 29,642
33 Canada 5,352 2,840 370 360 2,850 52 52 2,902 2,902 92,662
101 Indonesia 5,147 2,793 455 410 2,838 0 0 2,838 2,838 13,381
41 China, Mainland 5,995 2,712 829 728 2,812 17 17 2,830 2,830 2,245
44 Colombia 2,975 2,112 510 510 2,112 20 20 2,132 2,132 50,160
231 United States of
America (Cont.)
5,800 1,862 1,300 1,162 2,000 71 71 2,071 2,071 7,153
170 Peru 1,919 1,616 303 303 1,616 297 297 1,913 1,913 62,973
100 India 3,559 1,222 419 380 1,261 647 636 1,908 1,897 1,249
Source: From Review of World Water Resources by Country, www.fao.org/documents.
q 2006 by Taylor & Francis Group, LLC
THE WATER ENCYCLOPEDIA: HYDROLOGIC DATA AND INTERNET RESOURCES4-10
SECTION 4D HYDROLOGIC DATA
Figure 4D.5 Locations of NASQAN and national hydrologic bench-mark stations in the United States. (From .)
HYDROLOGIC ELEMENTS 4-11
q 2006 by Taylor & Francis Group, LLC
Table 4D.9 National Stream Water Quality Accounting Network (NASQAN) — Stations Operated by NASQAN 1996–2000
USGA
Station ID Station Name
USGS Office
Sampling
Station Latitude Longitude
Hydrologic
Unit Code Location of Stream Gage and Sampling Site Drainage Area Remarks
Mississippi River Basin
03216600 Ohio River at
Greenup
Dam near
Greenup, KY
Louisville, KY 38838
0
48
00
82851
0
38
00
05090103 At left bank at downstream end of lock guidewall in
lower poolat Greenup locks, 1.1 mi upstream
from Grays Branch, 4.7 mi downstream from
Little Sandy River, 5.0 mi north of Greenup and
at mile 341.5
62,000 sq. mi.,
approximately
03303280 Ohio River at
Cannelton
Dam at
Cannelton, IN
Louisville, KY 37853
0
58
00
86842
0
20
00
05140201 At Cannelton Dam, 0.7 mi upstream from Indian
Creek, 3.3 mi upstream from Lead Creek, and at
mile 720.8. Water-quality samples are collected
2.0 mi upstream from discharge station
97,000 sq. mi,
approximately
03378500 Wabash River at
New
Harmony, IN
Paducah, KY 38807
0
55
00
87856
0
25
00
05120113 At bridge on U.S. Highway 66 at New Harmony and
at mile 51.5
29,234 sq. mi Water discharge obtained from
station Wabash river at Mount
Carmel, IL (03377500)
03609750 Tennessee River
at Highway 60
near
Paducah, KY
Paducah, KY 37802
0
16
00
88831
0
46
00
06040006 At auxiliary gaging station at bridge on U.S.
Highway 60, 16.3 mi downstream from gagin
station, 2.4 mi east of Paducah, and at mile 5.3
40,330 sq. mi.,
40,200 sq. mi.
at gage
Records of daily discharge are
taken from gaging station near
Paducah (03609500). Flow
completely regulated. Barkley-
Kentucky Cannal (03438190)
diverts water from and to Lake
Barkley in the Cumberland
River Basin
03612500 Ohio River at
Dam 53 near
Grand Chain,
IL
Paducah, KY 37812
0
11
00
89802
0
30
00
05140206 At auxiliary gaging station, 0.5 mi upstream from
Gar Creek, 3.0 mi southwest of Grand Chain,
18.1 mi downstream from gaging station at
Metropolis, and at mile 962.2
203,100 sq. mi,
approximately
Water discharge obtained from
Ohio River at Metropolis, IL
(03611500). Flow regulated by
many dams and reservoirs
05420500 Mississippi River
at Clinton, IA
Iowa City, IA 41846
0
50
00
90815
0
07
00
07080101 At river end of 3rd St., at downstream end of ADM
repair dock, 10.3 miles upstream from
Wapsipinicon River, 4.8 mi upstream from
Camanche gage, 5.9 mi downstream from Lock
and Dam 13, and at mile 516.6 upstream from
Ohio River. Water-quality samples collected at
Fulton-Lyons Bridge, 6.4 mi upstream of
discharge station
85,600 sq. mi.,
approximately,
at Fulton-Lyons
Bridge in
Clinton
05587455 Mississippi River
below
Grafton, IL
Rolla, MO 38858
0
05
00
90825
0
42
00
07110009 On left bank 0.2 mi downstream from the mouth of
the Illinois River, 15.3 mi above Lock and Dam
26, 23.0 mi above mouth of Missouri River and at
mile 218.6 upstream of the mouth o the Ohio
River. Water-quality samples collected 4 mi
downstream of discharge station
171,300 sq. mi.,
approximately
06185500 Missouri River
near
Culbertson,
MT
Fort Peck, MT 48807
0
30
00
104828
0
20
00
10060005 On right bank at upstream side of bridge on State
Highway 16, 2.5 mi southeast of Culbertson, 10
mi downstream from Big Muddy Creek and at
river mile 1,620.76
91,557 sq. mi
q 2006 by Taylor & Francis Group, LLC
THE WATER ENCYCLOPEDIA: HYDROLOGIC DATA AND INTERNET RESOURCES4-12
06329500 Yellowstone
River near
Sidney, MT
Fort Peck, MT 47840
0
42
00
104809
0
22
00
10100004 On left bank at Montana-Dakota Utilities Company
powerplant, 0.2 mi downstream from bridge on
State Highway 23, 2.5 mi south of Sidney, 3.0 mi
downstream from Fox Creek, and at river mile
29.2
69,103 sq. mi;
06338490 Missouri River at
Garrison
Dam, ND
Bismark, ND 47830
0
08
00
101825
0
50
00
10130101 In control structure of Garrison Dam, 2.5 mi west of
Riverdale, 14 mi upstream from Knife River, and
at mile 1,389.9
181,400 sq. mi.,
approximately
06440000 Missouri River at
Pierre SD
Pierre, SD 44822
0
23
00
100822
0
03
00
10140101 On left bank downstream from Dakota Minnesota
and Eastern Railroad bridge, 1.3 mi upstream
from Bad River, 5.8 mi downstream from Oahe
Dam, and at mile 1066.5. Water-quality samples
collected 0.25 mile below Oahe Dam, about 5.55
mile upstream from gaging station. Inflow
between these two locations generally are
negligible
243,500 sq. mi.,
approximately
06610000 Missouri River at
Omaha, NE
Council Bluffs, IA 41815
0
32
00
95855
0
20
00
10230006 On right bank on left side of concrete floodwall, at
foot of Douglas Street, 275 ft downstream of
Interstate 480 Highway bridge in Omaha and at
mile 615.9 Water-quality samples are collected
at Interstate-80 bridge, 2.0 miles downstream of
gaging station
322,800 sq. mi.
approximately.
The 3,959 sq.
mi. in the Great
Divide basin
are not included
Flow regulated by upstream
mainstem reservoirs. US Army
Corps of Engineers raingage
and satellite data collection
platform at station
06805500 Platte River at
Louisville, NE
Linclon, NE 41800
0
55
00
96809
0
28
00
10200202 On the left bank at the upstream side of bridge on
Nebraska Highway 50, 1 mi north of Louisville,
and at mile 16.5
85,370 sq. mi.,
appoximately,
of which about
71,000 sq. mi.,
contributes
directly to
surface runoff
06934500 Missouri River at
Hermann,
MO
Rolla, MO 38842
0
36
00
91826
0
21
00
10300300 On downstream side of third pier from right
abutment of bridge on State Highway 19 at
Hermann, and at mile 97.9
524,200 sq. mi.,
approximately
07022000 Mississippi River
at Thebes, IL
Rolla, MO 37813
0
00
00
89827
0
50
00
07140105 Near center span on downstream side of railroad
bridge at Thebes, 5.0 mi downstream from
Headwater Diversion Channel and at mile 43.7
above Ohio River
713,200 sq. mi.,
approximately
07263620 Arkansas River
at David D.
Terry Lock &
Dam below
Little Rock,
AR
Little Rock, AR 34840
0
07
00
92809
0
18
00
11110207 At upper end of upstream wall at David D. Terry
Lock and Dam. 10.7 mi downstream from Main
Street bridge at Little Rock, and at mile 124.2
158,288 sq. mi., of
which 22,241
sq. mi. is
probably non-
contributing
Discharge is from station
07263450, 16.8 mi. upstream
07373420 Mississippi River
near St.
Francisville,
LA
Baton Rouge, LA 30845
0
30
00
91823
0
45
00
08070100 At State Highway 10 ferry crossing, 2.0 mi
southwest of St. Francisville and at mile 266.0
1,125,300 sq. mi.
contributing
Discharge is from Mississippi
River at Tarbert Landing, MS,
station 07295100
07381495 Atchafalaya
River at
Melville, LA
Baton Rouge, LA 30841
0
26
00
91844
0
10
00
08080101 At bridge on Texas and Pacific Railroad in Melville 93,316 sq. mi Discharge is from station
07381490, Atachafalaya river
at Simmesport, LA
(Continued)
q 2006 by Taylor & Francis Group, LLC
HYDROLOGIC ELEMENTS 4-13
Table 4D.9 (Continued)
USGA
Station ID Station Name
USGS Office
Sampling
Station Latitude Longitude
Hydrologic
Unit Code Location of Stream Gage and Sampling Site Drainage Area Remarks
Rio Grande Basin
08364000 Rio Grand at El
Paso, TX
Albuquerque,
NM
31848
0
10
00
106832
0
25
00
13030102 At gaging stati on the downstream side of the
Courchesne Bridge, 5.6 mi upstream from the
Santa Fe Street-Juarez Avenue bridge betwen
El Paso, Tx, and Cd. Juarez, Chihuahua at mile
1,249 and 1.7 mi upstream from the American
Dam
29,267 sq. mi Discharge measured by
International Boundary and
Water Commission
08377200 Rio Grande at
Foster
Ranch, near
Langtry, TX
San Angelo, TX 29846
0
50
00
101845
0
20
00
13040212 At gaging station 0.1 mi downstream from Terrell-
Val Verde Country line, 16.9 mi from Langtry,
and 597.2 midownstream from the American
Dam at El Paso
80,742 sq. mi Discharge measured by
International Boundary and
Water Commission
08447410 Pecos River near
Langtry, TX
San Angelo, TX 29848
0
10
00
101826
0
45
00
13040212 At gaging station 7.4 mi east of Langtry and 15.0 mi
upstream from confluence with Rio Grande
35,179 sq. mi Discharge measured by
International Boundary and
Water Commission
08450900 Rio Grande
below
Amistad Dam
near Del Rio,
TX
San Angelo, TX 29825
0
30
00
101802
0
27
00
13080001 2.2 mi downstream from Amistad Dam and 10 mi
northwest of Del Rio
123,143 sq. mi Discharge measured by
International Boundary and
Water Commission
08459200 Rio Grande at
Pipeline
Crossing
below Laredo,
TX
San Angelo, TX 27824
0
01
00
99829
0
18
00
13080002 8.7 Mi (14.0 km) downstream from Texas-Mexican
Railway Bridge near Laredo, and at mile 352.69
(567.48 km)
132,578 Discharge measured by
International Boundary and
Water Commission
08461300 Rio Grande
below Falcon
Dam, TX
San Angelo, TX 26833
0
25
00
99810
0
05
00
13090001 U.S. tailrace at Falcon Dam 159,270 sq. mi Discharge measured by
International Boundary and
Water Commission
08470400 Arroyo Colorado
at Harlingen,
TX map of
lower basin
San Angelo, TX 26810
0
24
00
97842
0
01
00
13090002 On downstream side of northbound service road on
U.S. Highways 83&77, about 18 mi from point of
main floodway that divides into North Floodway
and Arroyo Colorado
182 sq. mi Discharge measured by
International Boundary and
Water Commission
08475000 Rio Grande near
Brownsville,
TX map of
lower basin
San Angelo, TX 25852
0
35
00
97827
0
15
00
13090002 At International Boundary and Water Commission
gaging station, 1000 ft downstream from El
Jardin pumping plant, 6.8 mi below International
bridge between Brownsville and Matamoras,
Tamps., Mex. And 48.8 miles above the Gulf of
Mexico
176,333 sq. mi Discharge measured by
International Boundary and
Water Commission
Colorado River Basin
09180500 Colorado River
near Cisco,
UT
Moab, UT 38848
0
38
00
109817
0
34
00
14030005 On left bank 1 mi downstream from Dolores River,
11 mi south of Cisco, 36 mi downstream from
Colorado-Utah state line, 97 mi upstream from
Green River and 235 mi upstream from San Juan
River, at mile 1022.3 from Arizona-Sonora
24,100 sq. mi.,
approximately
q 2006 by Taylor & Francis Group, LLC
THE WATER ENCYCLOPEDIA: HYDROLOGIC DATA AND INTERNET RESOURCES4-14
09315000 Green River at
Green River,
UT
Moab, UT 38859
0
10
00
110809
0
02
00
14060008 On right bank, 1,400 ft upstream from railroad
bridge, 0.9 mi southeast of town of Green River,
22.7 mi upstream from San Rafael River, at mile
117.6 upstream from mouth
44,850 sq. mi. of
which about
4,260 sq. mi.
(including
3,959 sq. mi. in
Great Divide
Basin in
southern
Wyoming) i
noncontributing
Flow regulated by Flaming gorge
Reservoir (09234400)
09379500 San Juan River
near Bluff, UT
Moab UT 37808
0
49
00
109851
0
52
00
14080205 On left bank, 1,600 ft downstream from Gypsum
Creek, 1,800 ft upstream from highway bridge,
20 mi southwest of Bluff, at mile 113.5
23,000 sq. mi.,
approximately
No diversions between station and
mouth of river. Flow regulated
by Navajo Reservoir, NM
(09355100)
09380000 Colorado River
at Lees Ferry,
AZ
Flagstaff, AZ 36851
0
53
00
111835
0
15
00
14070006 In Navajo Indian Reservation, on left bank at head of
Marble gorge at lees ferry, just upstream from
Paria River, 16 mi downstream of Glen Canyon
Dam, 28 mi downstream from UT-AZ state line,
and 61.5 mi upstream from Little Colorado River
111,800 sq. mi.,
approximately,
including 3,959
sq. mi. in Great
Divide basin in
southern
Wyoming,
which is
noontributing
Many diversions above Lake
Powell for irrigation, municipal,
and industrial use. No diversion
or inflow between Lake Powell
and the gage
09404200 Colorado River
above
Diamond
Creek near
Peach
Springs, AZ
Flagstaff, AZ 36846
0
25
00
113821
0
46
00
15010002 In Lake Mead NRA, on the right bank, 0.6 mi
upstream from Diamond Creek, 138 mi
downstream from Phantom Ranch, 25 mi north
of Peach Springs, 242 mi downstream from Glen
Canyon Dam, and 130 mi upstream from Hoover
Dam
149,316 sq. mi.,
including 3,959
sq. mi. in Great
Divide Basin in
southern
Wyoming nand
697 sq. mi. on
the Colorado
Plateau
Several unregulated tributaries
below Glen Canyon Dam
09421500 Colorado River
below Hoover
Dam, AZ-NV
Las Vegas, NV 36800
0
55
00
114844
0
16
00
15030101 In powerhouse at downstream side of Hoover Dam.
Water-quality samples collected at gaging
station 0.3 mi downstream from Hoover Dam
171,700 sq. mi.,
approximately,
included 3,959
sq. mi. in Great
Divide Basin in
southern
Wyoming,
which is non-
contributing
09429490 Colorado River
above
Imperial Dam,
CA-AZ.
schematic
map of Lower
Colorado
River
Yuma, AZ 32852
0
59
00
114827
0
55
00
15030104 Imperial Dam is 5 mi upstream from Laguna Dam,
15 mi northeast of Yuma, 90 mi downstream
from Palo Verde Dam and 147 mi downstream
from Parker Dam. Water-quality samples
collected below trash racks at All-American
Canal headworks at west end of Imperial Dam
188,500 sq. mi.,
approximately,
including 3,959
sq. mi. in Great
Divide basin in
southern
Wyoming,
which is non-
contributing
Records show flow of Colorado
River reaching Imperial Dam
and are synthesized from
records of several other
stations
(Continued)
q 2006 by Taylor & Francis Group, LLC
HYDROLOGIC ELEMENTS 4-15
Table 4D.9 (Continued)
USGA
Station ID Station Name
USGS Office
Sampling
Station Latitude Longitude
Hydrologic
Unit Code Location of Stream Gage and Sampling Site Drainage Area Remarks
09522000 Colorado River
at Northerly
International
Boundary
(NIB), above
Morelos Dam,
near
Andrade, CA
schematic
map of Lower
Colorado
River
Yuma, AZ 32843
0
07
00
114843
0
05
00
15030108 On left bank at northerly international boundary, 0.5
mi east of Andrade. 1.1 mi upstream from
Morelos Dam, 1.1 mi downstream from
Rockwood Gate, and 6.4 mi downstream from
gaging station on Colorado River below Yuma
Main Canal wasteway
246,700 sq. mi.,
approximately,
including all
closed basins
entirely within
the drainage
boundary, also
3,959 sq. mi. in
Great divide
basin in
southern
Wyoming,
which is non-
contributing
Columbia River Basin
12400520 Columbia River
at Northport,
WA
Spokane, WA 48855
0
08
00
117847
0
11
00
17020001 0.4 mi downstream from State Highway 25 bridge at
Northport, 10.3 mi downstream from gaging
station at boundary, and at mile 735.1
60,200 sq. mi.,
approximately
Discharge is routed from gaging
station at international
boundary (12399500)
12472900 Columbia River
at Vernita
Bridge, near
Priest Rapids
Dam WA
Pasco, WA 46838
0
34
00
119843
0
54
00
17020016 At State Highway 24 Vernita Bridge crossing, 9.0 mi
downstream from Priest Rapids Dam and at mile
388.1
96,000 sq. mi.,
approximately
Discharge determined by routing
flows from the gaging station
below Priest Rapids Dam
(12472800) 6.4 mi upstream
13353200 Snake River at
Burbank, WA
Pasco, WA 46815
0
00
00
118853
0
45
00
17060110 Approximately 1.0 mi downstream from Ice Harbor
Dam
108,800 sq. mi Discharge is obtained and routed
from Ice Harbor Dam, 1.0 mi
upstream
14128910 Columbia River
at
Warrendale,
OR
Portland, OR 45836
0
45
00
122801
0
35
00
17080001 On left bank 0.1 mi downstream from Tumult Creek,
1.0 mi west of Warrendale, 5.1 mi downstream
from Bonneville Dam, and at mile 141.0
240,000 sq. mi.,
approximately
Stream discharge taken from
Columbia River at the Dalles,
OR (14105700) at river mile
188.9
14211720 Willamette River
at Portland,
OR
Portland, OR 45831
0
07
00
122840
0
00
00
17090012 In pier at east end of drawspan, on upstream side of
Morrison bridge in Portland, and at mile 12.8
11,100 sq. mi.,
approximately
Water discharge records obtained
by flow routing procedures usg
sta records
14246900 Columbia river at
Beaver Army
Terminal,
near Quincy,
OR
Portland, OR 46810
0
55
00
123810
0
50
00
17080003 On left bank, 0.7 mi downstream from Crims Island,
3.0 mi northwest of Qunicy, and at mile 53.8
256,900 sq. mi.,
approximately
Source: From
q 2006 by Taylor & Francis Group, LLC
THE WATER ENCYCLOPEDIA: HYDROLOGIC DATA AND INTERNET RESOURCES4-16
NORTHPORT
BEAVER
ARMY
TERMINAL
PORTLAND
VERNITA FERRY
BURBANK
WARRENDALE
Willamette .R
HOOVER
DAM
DIAMOND
CREEK
BLUFF
LEES
FERRY
IMPERIAL DAM
EL PAGO
PRESIDIO
FALCON
DAM
ARROYO COLORADO
BROWNSVILLE
LAREDO
FOSTER RANCH
LANGTRY
AMISTAD RES.
MELVILLE
ST. FRANCISVILLE
ALABAMA
TOMBIGBEE
D. TERRY
DAM
HERMANN
THEBES
PADUCAH
CANNELTON DAM
GREEN LIP DAM
SUSQUEHANNA
EXPLANATION
NASQAN station
NAWQA station
Joint NASQAN/
NAWQA station
Cooperative station
Inactive station
SAINT LAWRENCE
NEW HARMONY
LOUISVILLE GRARTON
OMAHA
JORDAN
Minnesota
Aichafalaya R.
Ohio
HASTINGS
CLINTON
GRAND CHAIN
PIERRE
SIDNEY
GREENR.
CISCO
CULBERTSON
GARRISON DAM
N.I.B
C
o
l
u
m
n
i
a
.
R
.
S
na
k
e
R
i
v
e
r
Y
e
l
l
o
w
s
t
o
n
e
.
R
River
River
River
G
r
e
e
n
R
C
o
l
o
r
a
d
o
R
G
i
l
a
R
i
v
e
r
R
e
d
R
i
v
e
r
P
a
r
u
a
R
i
v
e
r
G
r
a
n
d
e
R
i
n
P
l
a
t
t
e
R
i
v
e
r
A
r
k
a
n
i
a
n
R
ive
r
T
e
n
n
e
s
s
e
r
R
i
ve
r
M
i
s
s
i
s
s
i
p
p
i
W
a
b
a
s
h
R
M
i
s
s
o
u
r
i
Figure 4D.6 NASQAN stations, 1996–2000. (From .)
Table 4D.10 Water Quality Characteristics Are Measured as NASQAN Stations
Code Parameter Description
4S 5S 75S
MAJ 00010 Water temperature (degree Celsius)
MAJ 00061 Discharge, instantaneous (cubic feet per second)
MAJ 00076 Turbidity (nephelometric turbidity units, NTU)
MAJ 00095 Specific conconductance (microsiemens per centimeter at 25 Celsius)
MAJ 00300 Oxygen, dissolved (milligrams per liter)
MAJ 00400 Ph, field (standard units)
MAJ 00452 Carbonate, filtered (milligrams per liter as CO
3
)
MAJ 00453 Bicarbonate, filtered (milligrams per liter as HCO
3
)
MAJ 00608 Ammonia–nitrogen (milligrams per liter as N)
MAJ 00613 Nitrite–nitrogen (milligrams per liter as N)
MAJ 00623 Ammonia-plus-organic-nitrogen, dissolved (milligrams per liter as N)
MAJ 00625 Ammonia-plus-organic-nitrogen (milligrams per liter as N)
MAJ 00631 Nitrite-plus-nitrate-nitrogen, dissolved (milligrams per liter as N)
MAJ 00665 Phosphorus, total (milligrams per liter as P)
MAJ 00666 Phosphorus, dissolved (milligrams per liter as P)
MAJ 00671 Orthophosphate-phosphorus (milligrams per liter as P)
MAJ 00681 Carbon, organic, dissolved (milligrams per liter as C)
MAJ 00689 Carbon, organic, suspended (milligrams per liter as C)
MAJ 00915 Calcium, dissolved (milligrams per liter as Ca)
MAJ 00925 Magnesium, dissolved (milligrams per liter as Mg)
MAJ 00930 Sodium, dissolved milligrams per liter as Na)
MAJ 00935 Potassium, dissolved (milligrams per liter as K)
MAJ 00940 Chloride, dissolved (milligrams per liter as Cl)
MAJ 00945 Sulfate, dissolved (milligrams per liter as SO
4
)
(Continued)
HYDROLOGIC ELEMENTS 4-17
q 2006 by Taylor & Francis Group, LLC
Table 4D.10 (Continued)
Code Parameter Description
MAJ 00950 Fluoride, dissolved (milligrams per liter as F)
MAJ 00955 Silica, dissolved (milligrams per liter as SiO
2
)
MAJ 39086 Alkalinity, filtered (milligrams per liter as CaCO
3
)
MAJ 70300 Residue on evaporation (180 Celsius) (milligrams per liter)
MAJ 70331 Sediment, finer than 63 microns (percent)
MAJ 80154 Sediment, suspended (milligrams per liter)
SEDCHEM 29816 Antimony, sediment, suspended, total (micrograms per gram)
SEDCHEM 29818 Arsenic, sediment, suspended, total (micrograms per gram)
SEDCHEM 29820 Barium, sediment, suspended, total (micrograms per gram)
SEDCHEM 29822 Beryllium, sediment, suspended, total (micrograms per gram)
SEDCHEM 29826 Cadmium, sediment, suspended, total (micrograms per gram)
SEDCHEM 29829 Chromium, sediment, suspended, total (micrograms per gram)
SEDCHEM 29832 Copper, sediment, suspended, total (micrograms per gram)
SEDCHEM 29836 Lead, sediment, suspended, total (micrograms per gram)
SEDCHEM 29839 Manganese, sediment, suspended, total (micrograms per gram)
SEDCHEM 29841 Mercury, sediment, suspended, total (micrograms per gram)
SEDCHEM 29843 Molybdenum, sediment, suspended, total (micrograms per gram)
SEDCHEM 29846 Nickel, sediment, suspended, total (micrograms per gram)
SEDCHEM 29847 Selenium, sediment, suspended, total (micrograms per gram)
SEDCHEM 29850 Silver, sediment, suspended, total (micrograms per gram)
SEDCHEM 29853 Vanadium, sediment, suspended, total (micrograms per gram)
SEDCHEM 29855 Zinc, sediment, suspended, total (micrograms per gram)
SEDCHEM 30221 Aluminum, sediment, suspended, total (percent)
SEDCHEM 30244 Carbon, sediment, suspended, total (percent)
SEDCHEM 30269 Iron, sediment, suspended, total (percent)
SEDCHEM 30292 Phosphorus, sediment, suspended, total (percent)
SEDCHEM 30308 Sulfur, sediment, suspended (percent)
SEDCHEM 30317 Titanium, sediment, suspended, total (percent)
SEDCHEM 35031 Cobalt, sediment suspended, total (micrograms per gram)
SEDCHEM 35040 Strontium, sediment, suspended, total (micrograms per gram)
SEDCHEM 35046 Uranium, sediment, suspended, total (micrograms per gram)
SEDCHEM 35050 Lithium, sediment, suspended, total (micrograms per gram)
SEDCHEM 49955 Thallium, sediment, suspended, total (micrograms per gram)
SEDCHEM 50279 Sediment, suspended (milligrams per liter)
SEDCHEM 50465 Carbon, organic, suspended, total (percent)
TE 01000 Arsenic, dissolved (milligrams per liter as As)
TE 01005 Barium, dissolved (milligrams per liter as Ba)
TE 01010 Beryllium, dissolved (milligrams per liter as Be)
TE 01020 Boron, dissolved (micrograms per liter as B)
TE 01025 Cadmium, dissolved (micrograms per liter as Cd)
TE 01030 Chromium, dissolved (micrograms per liter as Cr)
TE 01035 Cobalt, dissolved (micrograms per liter as Co)
TE 01040 Copper, dissolved (micrograms per liter as Cu)
TE 01046 Iron, dissolved (micrograms per liter as Fe)
TE 01049 Lead, dissolved (micrograms per liter as Pb)
TE 01056 Manganese, dissolved (micrograms per liter as Mn)
TE 01057 Thallium, dissolved (micrograms per liter as Tl)
TE 01060 Molybdenum, dissolved (micrograms per liter as Mo)
TE 01065 Nickel, dissolved (micrograms per liter as Ni)
TE 01075 Silver, dissolved (micrograms per liter as Ag)
TE 01080 Strontium, dissolved (micrograms per liter as Sr)
TE 01085 Vanadium, dissolved (micrograms per liter as V)
TE 01090 Zinc, dissolved (micrograms per liter as Zn)
TE 01095 Antimony, dissolved (micrograms per liter as Sb)
TE 01106 Aluminum, dissolved (micrograms per liter as Al)
TE 01130 Lithium, dissolved (micrograms per liter as Li)
TE 01145 Selenium, dissolved (micrograms per liter as Se)
PEST 04024 Propachlor, dissolved (micrograms per liter)
PEST 04028 Butylate, dissolved (micrograms per liter)
PEST 04035 Simazine, dissolved (micrograms per liter)
(Continued)
THE WATER ENCYCLOPEDIA: HYDROLOGIC DATA AND INTERNET RESOURCES4-18
q 2006 by Taylor & Francis Group, LLC
Table 4D.10 (Continued)
Code Parameter Description
PEST 04037 Prometon, dissolved (micrograms per liter)
PEST 04040 Desethyl atrazine, dissolved (micrograms per liter)
PEST 04041 Cyanazine, dissolved (micrograms per liter)
PEST 04095 Fonofos, dissolved (micrograms per liter)
PEST 22703 Uranium, natural, dissolved (micrograms per liter)
PEST 34253 Alpha BHC, dissolved (micrograms per liter)
PEST 34653 P, P
0
DDE, dissolved (micrograms per liter)
PEST 38933 Chlorpyrifos, dissolved (micrograms per liter)
PEST 39341 Lindane, dissolved (micrograms per liter)
PEST 39381 Dieldrin, dissolved (micrograms per liter)
PEST 39415 Metolachlor, dissolved (micrograms per liter)
PEST 39532 Malathion, dissolved (micrograms per liter)
PEST 39542 Parathion, dissolved (micrograms per liter)
PEST 39572 Diazinon, dissolved (micrograms per liter)
PEST 39632 Atrazine, dissolved (micrograms per liter)
PEST 46342 Alachlor, dissolved (micrograms per liter)
PEST 49260 Acetochlor, dissolved (micrograms per liter)
PEST 82630 Metribuzin, dissolved (micrograms per liter)
PEST 82660 Diethylanilene, dissolved (micrograms per liter)
PEST 82661 Trifluralin, dissolved (micrograms per liter)
PEST 82663 Ethalfluralin, dissolved (micrograms per liter)
PEST 82664 Phorate, dissolved (micrograms per liter)
PEST 82665 Terbacil, dissolved (micrograms per liter)
PEST 82666 Linuron, dissolved (micrograms per liter)
PEST 82667 Methyl parathion, dissolved (micrograms per liter)
PEST 82668 EPTC, dissolved (micrograms per liter)
PEST 82669 Pebulate, dissolved (micrograms per liter)
PEST 82670 Tebuthiuron, dissolved (micrograms per liter)
PEST 82671 Molinate, dissolved (micrograms per liter)
PEST 82672 Ethoprop, dissolved (micrograms per liter)
PEST 82673 Benfluralin, dissolved (micrograms per liter)
PEST 82674 Carbofuran, dissolved (micrograms per liter)
PEST 82675 Terbufos, dissolved (micrograms per liter)
PEST 82676 Pronamide, dissolved (micrograms per liter)
PEST 82677 Disultoton, dissolved (micrograms per liter)
PEST 82678 Triallate, dissolved (micrograms per liter)
PEST 82679 Propanil, dissolved (micrograms per liter)
PEST 82680 Carbaryl, dissolved (micrograms per liter)
PEST 82681 Thiobencarb, dissolved (micrograms per liter)
PEST 82682 DCPA, dissolved (micrograms per liter)
PEST 82683 Pendimethalin, dissolved (micrograms per liter)
PEST 82684 Napropamide, dissolved (micrograms per liter)
PEST 82685 Propargite, dissolved (micrograms per liter)
PEST 82686 Azinphos-methyl, dissolved (micrograms per liter)
PEST 82687 Permethrin, dissolved (micrograms per liter)
PEST 91063 Diazinon, D-10 surrogate (percent)
PEST 91065 HCH, alpha, D-6 surrogate (percent)
PEST 99108 Spike volume (milliters)
PEST 99856 Sample volume (milliters)
Note: ASCII text file containing parameter code definitions for constituents.
Analyzed by the USGS National Stream Quality Accounting Network (1996–2000).
File is tab-delimited.
The first header contains column names.
The second header contains column formats.
CodeZConstituent group, defined as follows:
MAJZinstantaneous Q, field parameters, major ions, nutrients, suspended sediment
SEDCHEMZsediment chemistry
TEZtrace elements (dissolved)
PESTZpesticides
ParameterZWATSTORE code
DescriptionZConstituent name (units of measure)
Source: .
HYDROLOGIC ELEMENTS 4-19
q 2006 by Taylor & Francis Group, LLC
Total stations 7,426
Other Federal
agency programs
1,868
Combined
sources
779
Federal
program
557
Federal−state
cooperative program
4,222
Figure 4D.7 Sources of funds for operation of continuous surface-water discharge stations. (From U.S. Geological Survey Water Data
Program, .)
Table 4D.11 Hydrologic and Related Data Collection Networks in the United States
Type of Network Number of Stations
Automatic meterological observing stations (full parameter); temperature, dew point, wind, pressure,
precipitation) 92
National weather service synoptic and basic observation stations (high quality observations for basic
weather program) 67
Cooperative station services (observations by lay persons):
Temperature and precipitation 5,568
Precipitation only — daigeoly 3,200
Precipitation only — storage 32
Hourly precipitation stations equipped with recording precipitation gages 3,205
Cooperative stations equipped with both recording and nonrecording precipitations gages 1,995
Crop reporting stations 566
River and/or rainfall reporting stations
River stage reports only 998
Rainfall reports only 3,656
River stage and rainfall reports 1,069
Evaporation storage 448
Reference Climatological Stations 21
Automated Hydrologic Observing System (AHOS) — river and rainfall data for flood forecasting
AHOS/T
a
506
AHOS/S
b
75
Special reporting stations 293
Cooperative station data published
Temperature and precipitation 8,256
Precipitation only 3,055
Evaporation 431
Soil temperature 308
Miscellaneous (snow density, special meteorological, etc) 473
a
Data transmitted by telephone.
b
Data transmitted by satellite.
Source: From National Weather Service, Operations of the National Weather Service, 1985.
THE WATER ENCYCLOPEDIA: HYDROLOGIC DATA AND INTERNET RESOURCES4-20
q 2006 by Taylor & Francis Group, LLC
Table 4D.12 USGS Programs Managed by the Water Resources Discipline
† Cooperative Water Program — The Cooperative Program, a partnership between the USGS and state and local agencies, provides
information that forms the foundation for many of the Nation’s water resources management and planning activities
† National Streamflow Information Program (NSIP) — The National Streamflow Information Program (NSIP) is a conceptual plan
developed by the USGS for a new approach to the acquisition and delivery of streamflow information
† National Water Quality Assessment Program (NAWQA) — Since 1991, USGS scientists with the NAWQA program have been collecting
and analyzing data and information in more than 50 major river basins and aquifers across the Nation. The goal is to develop long-term
consistent and comparable information on streams, groundwater, and aquatic ecosystems to support sound management and policy
decisions. The NAWQA program is designed to answer these questions:
1. What is the condition of our Nation’s streams and groundwater?
2. How are these conditions changing over time?
3. How do natural features and human activities affect these conditions?
† Toxic Substances Hydrology (Toxics) Program — provides unbiased earth science information on the behavior of toxic substances in the
Nation’s hydrologic environments. The information is used to avoid human exposure, to develop effective cleanup strategies, and to
prevent further contamination
† Groudwater Resources Program — The Groundwater Resources Program encompasses regional studies of groundwater systems,
multidisciplinary studies of critical groundwater issues, access to groundwater data, and research and methods development. The
program provides unbiased scientific information and many of the tools that are used by Federal, State, and local management and
regulatory agencies to make important decisions about the Nation’s groundwater resources
† Hydrologic Research and Development — Hydrologic Research and Development focuses on long-term investigations that integrate
hydrological, geological, chemical, climatic, and biological information related to water resources issues. The program provides the
primary support for the National Research Program (NRP) in the hydrologic sciences and for Water, Energy, and Biogeochemical
Budgets (WEBB) program
† State Water Resoruces Research Institute Program — A matching grant program to support water resources research, education, and
information transfer at the 54 university based Water Resources Research Institutes. This program includes the National Institutes for
Water Resources USGS Student Internship Program
Subprograms:
† Water Information Coordination Program (WICP) — ensures the availability of water information required for effective decision making for
natural resources management and environmental protection and to do it cost effectively
† Drinking Water Programs — The wide range of monitoring, assessment, and research activities conducted by the USGS to help
understand the protect the quality of our drinking water resources is described on these pages. These studies are often done in
collaboration with other federal, state, tribal, and local agencies
† National Stream Quality Accounting Network (NASQAN) — Focus is on monitoring the water quality of four of the Nation’s largest river
systems — the Mississippi (including the Missouri and Ohio), the Columbia, the Colorado, and the Rio Grande
† Hydrologic Benchmark Network (HBN) — was established in 1963 to provide long-term measurements of streamflow and water quality in
areas that are minimally affected by human activities. These data were to be used to study time trends and to serve as controls for
separating natural from artificial changes in other streams. The network has consisted of as many as 58 drainage basins in 39 State
† National Atmospheric Deposition Program/National Trends Network (NADP/NTN) — A nationwide network of precipitation monitoring
sites. The first sites in the network were established in 1978. The network currently consists of approximately 200 sites
† National Research Program (NRP) — conducts basic and problem-oriented hydrologic research in support of the mission of the U.S.
Geological Survey (USGS)
† National Water Summary Program — a series of publications designed to increase public understanding of the nature, geographic
distribution, magnitude, and trends of the Nation’s water resources. It is often referred to as the USGS “encyclopedia of water”
† National Water-Use Program — examines the withdrawal, use, and return flow of water on local, state, and national levels
† USGS Environmental Affairs Program — provides guidance and information on the National Environmental Policy Act and other
environmental issues
† Water, Energy, and Biogeochemical Budgets (WEBB) — understands the processes controlling water, energy, and biogeochemical
fluxes over a range of temporal and spatial scales and to understand the interactions of these processes, including the effect of
atmospheric and climatic variables
† National Irrigation Water Quality Program — A Department of Interior program to identify and address irrigation-induced water quality and
contamination problems related to Department of Interior water projects in the west
International Programs:
† Cyprus Water Resources Database Development — This project met the USGS goal of supporting U.S. foreign policy. It was requested
by the U.S. Ambassador to Cyprus and coordinated closely through the U.S. Department of State. It took 5 years of negotiations with
senior Cypriot officials, Embassy staff, U.S. Department of State, and selected United Nations offices to design and implement this
project. This project enabled water managers on Cyprus to manage their limited water resources, which will directly contribute to
enhancement and protection of the quality of life for Cypriot citizens
† Public Awareness and Water Conservation — The project, which began in 1996, is part of the Middle East Peace Process and is one of
several projects sponsored by the Multilateral Working Group on Water Resources. The U.S. Department of State requested the USGS
to undertake this activity and has provided political guidance throughout the project. The project meets the USGS goal of supporting
U.S. foreign policy and fostering outreach and public awareness activities
(Continued)
HYDROLOGIC ELEMENTS 4-21
q 2006 by Taylor & Francis Group, LLC
Table 4D.12 (Continued)
† Regional Water Data Banks — The Executive Action Team Multilateral Working Group on Water Resoruces, Water Data Banks Project
consists of a series of specific actions to be taken by the Israelis, Jordanians, and Palestinians that are designed to foster the adoption of
common, standardized data collection and storage techniques among the Parties, improve the quality of the water resources data
collected in the region, and to improve communication among the scientific community in the region
† Ukraine Streamflow Project — Floods are among the most frequent and costly natural disasters in terms of human hardship and
economic loss. In Ukraine, two major floods (one in 1998 and one in 2001) have occurred in the Tisa River Basin in the last 5 years. Both
floods caused several fatalities, damaged or destroyed several thousand homes, destroyed bridges and roads, and created severe
personal and economic hardship for the residents of Zakarpattia Oblast in western Ukraine. Near real-time streamflow data can be used
to forecast and manage floods and improve public safety
† Groundwater Research Program for the Emirate of Abu Dhabi, United Arab Emirates — Since 1988 the USGS has been partnering with
the National Drilling Company (NDC) of the Abu Dhabi Emirate to collect information on the groundwater resources of the Emirate, to
conduct research on the hydrology of the arid environment, to provide training in water resources investigations, and to document the
results of the cooperative work in scientific publications
† Geologic, Hydrologic, and Geochemical Characterization of the Deep Groundwater Aquifer System In the Bengal Delta of Bangladesh —
The USGS is currently conducting research on the deeper aquifer system in Bangladesh in areas associated with high levels of arsenic in
the shallow groundwater. This work is an integral step in the characterization of the hydrogeolocial framework needed to define the
potential for developing safe and sustainable groundwater sources
† Botswana–Village Flood Watch — The Village Flood Watch project, which was completed in 2002, was designed to help establish an
early-warning system for potential flooding events by adding or upgrading six gauging stations to near real-time capabilities and providing
training on hydrologic runoff modeling
† Jordan Groundwater Management — The project objective is to enhance current Jordanian technical capacities for hydrogeologic data
and information development, management and analysis; development and use of groundwater management models; and joint design
and conduct of outreach workshops and meetings to increase public understanding of the benefits of local efforts in groundwater
management and conservation
† Summary of Palestinian Hydrologic Data 2000 — The project provides a critical tool to the USAID Water Resources Program including
several investigative, development, and construction projects, in the West Bank and Gaza, designed to comprehensively develop,
manage, and protect water resources. This activity demonstrates the USGS leadership role in the natural sciences and confirms the
mission of providing scientific information to manage natural resources to enhance and protect the quality of life
Source: From Water Resources of the United States, .
Table 4D.13 Number of USGS Data-Collection Stations Operated in 1994, by Source of Funds
Types of Stations
Federal
Program
Federal-State
Cooperative
Program
Other Federal
Agency Program
Combined
Support Total
Surface water:
Discharge 638 6,419 2,219 964 10,240
Stage-only — streams, lakes and
reservoirs
47 968 850 183 2,048
Quality 778 1,666 426 228 3,098
Groundwater:
Water levels 2,344 27,029 2,421 237 32,031
Quality 691 4,602 1,347 216 6,856
Source: From U.S. Geological Survey Water Data Program, .
THE WATER ENCYCLOPEDIA: HYDROLOGIC DATA AND INTERNET RESOURCES4-22
q 2006 by Taylor & Francis Group, LLC
Table 4D.14 Increasing Global Data Coverage
Regions
Number of
Stations
Number of
Data Point Physical/Chemical
Major
Loans Metals Nutrients
Organic
Contaminants Microbiology Date Range
Africa 138 206907 26712 79889 6439 41289 370 832 1977–2004
Americas 682 417994 47198 73210 88124 47284 3583 10401 1965–2004
Asia 332 641940 118868 159329 83005 98796 6794 32018 1971–2004
Europe 318 823323 146747 136392 154742 108815 14539 27260 1978–2003
Oceania 94 206650 31678 12237 2535 46992 1438 1383 1979–2004
Total 1544 2296814 371203 461087 334845 343176 26734 71894 1965–2004
Source: From GEMS Water, State of the UNEP GEMS/Water Global Network and Annual Report, United Nations Environment Programme, Global Environment Monitoring System
(GEMS) Water Programme, 2004, www.gemswater.org.
q 2006 by Taylor & Francis Group, LLC
HYDROLOGIC ELEMENTS 4-23
SECTION 4E INTERCEPTION
Table 4E.15 Interception by Trees
Type or Species Age or Size Place in Succession Locality Interception (Percent)
Hemlock Mature Climax Connecticut 48
Douglas fir 25 yr Climax Washington 43
Hemlock Mature Climax New Hampshire 38
Spruce-fir Mature Climax Maine 37
Hemlock Mature Climax Adirondacks, New York 34
Douglas fir Mature Climax Washington 34
Hemlock Mature Climax Ithaca, New York 31
Spruce — fir — paper birch Mature Climax Maine 26
White pine — hemlock Mature Climax Massachusetts 24
Western white pine —
western hemlock
Overmature Climax Idaho 21
Maple — beech Mature Climax New York 43
Mixed Mature Climax New York 40
Maple — hemlock Mature, cutover Climax Wisconsin 25
Beech — birch — maple Mature Climax Ontario 21
Ponderosa pine Mature Preclimax Arizona 40
Lodgepole pine Mature Preclimax Colorado 32
Ponderosa pine Mature Preclimax Idaho 27
Jeffrey pine Mature Preclimax Southern California 26
Lodgepole pine 32 yr Preclimax Colorado 23
Ponderosa pine Mature Preclimax Idaho 22
Ponderosa pine Young Pioneer Colorado 18
Calif, scrub oak 6 ft — Southern California 31
Mixed brush Mature Preclimax North Fork, California 19
White pine — red pine 40 yr Preclimax Ontario 37
Jack pine 50 yr Pioneer Wisconsin 21
Shortleaf pine 45 yr Pioneer North Carolina 16
Quaking aspen 32 yr Pioneer Colorado 16
Chaparral, mixed 6 ft Southern California 17
Maple — hemlock Mature (after leaf fall) Climax (under-stocked) Wisconsin 16
Hemlock Mature Climax New York 13
Oak-pine Open, second growth Preclimax New Jersey 13
Ponderosa — lodgepole pine 25 ft Preclimax Idaho 8
Beech — maple Mature Climax New York 6
Chamise 6 ft Pioneer Southern California 3
Note: Interception includes stemflow and is expressed as a percentage of annual precipitation.
Source: From Compilation of data from various references, Kittredge, Forest Influences, McGraw-Hill, Copyright 1948. With permission.
Table 4E.16 Interception by Various Forest Types
Forest Type
Gross Interception Stemflow Net Interception
Net Snow
Interception
(%)
With Leaves
(%)
Without
Leaves (%)
With Leaves
(%)
Without
Leaves (%)
With Leaves
(%)
Without
Leaves (%)
Northern hardwood 20 17 5 10 15 7 10
Aspen — birch 15 12 5 8 10 4 7
Spruce — spruce-fir 35 — 3 — 32 — 35
White pine 30 — 4 — 26 — 25
Hemlock 30 — 2 — 28 — 25
Red pine 32 — 3 — 29 — 30
Source: U.S. Forest Service.
THE WATER ENCYCLOPEDIA: HYDROLOGIC DATA AND INTERNET RESOURCES4-24
q 2006 by Taylor & Francis Group, LLC
SECTION 4F INFILTRATION
Table 4E.17 Interception by Various Crops
Description Alfalfa Corn Soybean Oats
During growing season:
Rainfall (in.) 10.81 7.12 6.25 6.77
Canopy penetration (in.) 6.18 4.84 4.06 6.30
Stemflow (in.) 0.76 1.18 1.28
Interception (in.) 3.87 1.10 0.91 0.47
Interception (%) 35.8 15.5 14.6 6.9
During low-vegetation development (%) 21.9 3.4 9.1 3.1
Source: U.S. Department of Agriculture.
Figure 4F.8 Total annual infiltration and soil moisture in the world (in mm). (From Lvovitch, M.I., EOS, 54, 1973, Copyright by American
Geophysical Union. With permission.)
HYDROLOGIC ELEMENTS 4-25
q 2006 by Taylor & Francis Group, LLC